
Abstract
Objective
A complex association exists between aberrant gait biomechanics and posttraumatic knee osteoarthritis (PTOA) development. Previous research has primarily focused on the link between peak loading during the loading phase of stance and joint tissue changes following anterior cruciate ligament reconstruction (ACLR). However, the associations between loading and cartilage composition at other portions of stance, including midstance and late stance, is unclear. The objective of this study was to explore associations between vertical ground reaction force (vGRF) at each 1% increment of stance phase and tibiofemoral articular cartilage magnetic resonance imaging (MRI) T1ρ relaxation times following ACLR.
Design
Twenty-three individuals (47.82% female, 22.1 ±4.1 years old) with unilateral ACLR participated in a gait assessment and T1ρ MRI collection at 12.25 ± 0.61 months post-ACLR. T1ρ relaxation times were calculated for the articular cartilage of the weightbearing medial and lateral femoral (MFC, LFC) and tibial (MTC, LTC) condyles. Separate bivariate, Pearson product moment correlation coefficients (r) were used to estimate strength of associations between T1ρ MRI relaxation times in the medial and lateral tibiofemoral articular cartilage with vGRF across the entire stance phase.
Results
Greater vGRF during midstance (46%-56% of stance phase) was associated with greater T1ρ MRI relaxation times in the MFC (r ranging between 0.43 and 0.46).
Conclusions
Biomechanical gait profiles that include greater vGRF during midstance are associated with MRI estimates of lesser proteoglycan density in the MFC. Inability to unload the ACLR limb during midstance may be linked to joint tissue changes associated with PTOA development.
Introduction
Aberrant gait biomechanics are associated with deleterious joint tissue changes linked to posttraumatic osteoarthritis (PTOA) development following anterior cruciate ligament (ACL) injury.1-7 Gait biomechanics are modifiable in individuals with an anterior cruciate ligament reconstruction (ACLR),8-10 suggesting that gait retraining could be a viable intervention for PTOA prevention. Therefore, understanding the specific characteristics of gait biomechanics linked to early PTOA-related joint tissue changes is important for optimizing biomechanical interventions to prevent future disease onset. Vertical ground reaction force (vGRF), a measure of the force exerted on the limb in the vertical direction throughout the stance phase of gait, 11 is associated with biochemical5,12 and patient-reported outcomes13,14 related to PTOA development following ACLR. Therefore, vGRF is an important biomechanical variable for studying gait-related changes that associate with PTOA onset.
During gait, vGRF is characterized by an initial impact peak occurring within the first 25% of stance phase, followed by a period of offloading during midstance and subsequent second peak during late stance. 15 Individuals with ACLR often exhibit a less dynamic, or flattened, vGRF waveform throughout stance marked by diminished vGRF peaks and a higher midstance vGRF magnitude. 16 Compared with uninjured age and sex matched-controls, ACLR individuals tend to exhibit more sustained vGRF magnitude throughout stance, characterized by a lower initial vGRF impact peak (−10% BW) in early stance and a greater vGRF magnitude at midstance (+5% BW) in the first 12 months following ACLR. 16 Similarly, individuals reporting clinically relevant symptoms <12 months post-ACLR demonstrate lesser vGRF in early (i.e., 1%-30% of stance) and late (i.e., 70%-100% of stance) stance but greater vGRF during midstance (i.e., 34%-65% of stance) compared with asymptomatic ACLR individuals. 14 A similar flattened vGRF waveform is exhibited in individuals with progressive knee osteoarthritis, 17 suggesting that a less dynamic vGRF waveform may be part of a biomechanical loading profile related to the early onset and progression of knee osteoarthritis. Unfortunately, the portion of the vGRF waveform (e.g., early, midstance, late stance) that most strongly associates with changes in cartilage health following ACLR remains unclear.
Components of the extracellular articular cartilage matrix are mechanosensitive, and the magnitude and duration of load applied to cartilage cells influences overall tissue health. 18 Healthy cartilage responds to normal cyclic loading in a dose-dependent manner. 19 However, exceeding the threshold of optimal loading magnitude and duration of applied load could progress to mechanical fatigue and changes to tissue structure. 20 Lesser vGRF peaks combined with greater vGRF at midstance may lead to sustained loading, a loading pattern which may be detrimental to tissue metabolism and cartilage composition.21-23 T1ρ magnetic resonance imaging (MRI) has been used to assess early in vivo decreases in proteoglycan density of the articular cartilage,24-26 a compositional change associated with tibiofemoral osteoarthritis development. 27 Greater tibiofemoral articular cartilage T1ρ relaxation times, indicative of lesser proteoglycan density, are exhibited within the first 12 months following ACLR.26,28 Proteoglycans contribute to the hydration and creation of interstitial pressure within the cartilage to withstand applied loads during locomotion, 29 thereby applying aberrant loading to cartilage tissue with already diminished proteoglycan density may accelerate harmful changes within the articular cartilage. Increases in vGRF impact peak at 6 months post-ACLR have been associated with higher tibiofemoral T1ρ relaxation times at 1 and 2 years post-ACLR. 6 Conversely, in another cohort, lesser vGRF impact peaks at 6 months post-ACLR were associated with higher tibiofemoral T1ρ relaxation times, 30 suggesting that both excessive and insufficient vGRF impact peak loading may be linked to compositional changes within the articular cartilage. Previous studies suggest an association exists between vGRF and in vivo MRI measures of cartilage composition;6,30 yet, the relationship between these factors has exclusively evaluated peak vGRF and the link between vGRF in other portions of stance phase and tibiofemoral articular cartilage composition is unknown. The purpose of this study is to explore the associations between vGRF and tibiofemoral articular cartilage composition (T1ρ relaxation times) throughout stance phase of gait in individuals who were 12 months post-ACLR. We hypothesized that lesser vGRF in the first 25% of stance would be most strongly associated with greater tibiofemoral articular cartilage T1ρ relaxation times (lesser proteoglycan density), while greater vGRF in midstance would also associate with greater tibiofemoral articular cartilage T1ρ relaxation times.
Methods
We performed a cross-sectional study using all available data from a larger longitudinal cohort study. All participants were recruited within 15 days of ACL injury and went on to undergo primary ACLR an average of 30.0 ± 13.5 days following ACL injury. The participants selected for this study all underwent an arthroscopic bone-patellar-tendon-bone ACLR autograft procedure 5 and participated in standard physical therapy. T1ρ MRI collection and gait biomechanics testing occurred at 12 months post-ACLR (12.3 ± 0.6 months). We also collected all five subscales of the Knee Osteoarthritis Outcome Scale (KOOS) at the 12-month follow-up examination to characterize patient-reported function of the study cohort. 31 The Institutional Review Board at University of North Carolina at Chapel Hill approved the study protocols and participants provided written, informed consent prior to study participation.
Participants
All participants between the ages of 18 and 35 with primary unilateral ACL injuries were included in this study. Participants were excluded if there was previous history of more than one ACL injury, presence of additional ligament tears that required surgery, previous lower extremity surgery, radiographic knee osteoarthritis, or a body mass index (BMI) >35kg/m2. Women who were pregnant at time of screening, or who planned to become pregnant within 12 months, were also excluded from the study. Concomitant meniscal injuries, particularly affecting the lateral menisci, commonly occur with ACL injury.32-34 Therefore, the presence of medial and lateral meniscal injuries as well as chondral injuries were recorded by the orthopedic surgeon and presented as part of participant demographics in Table 1 .
Participant Demographics and Outcome Measures (Means ± SD).
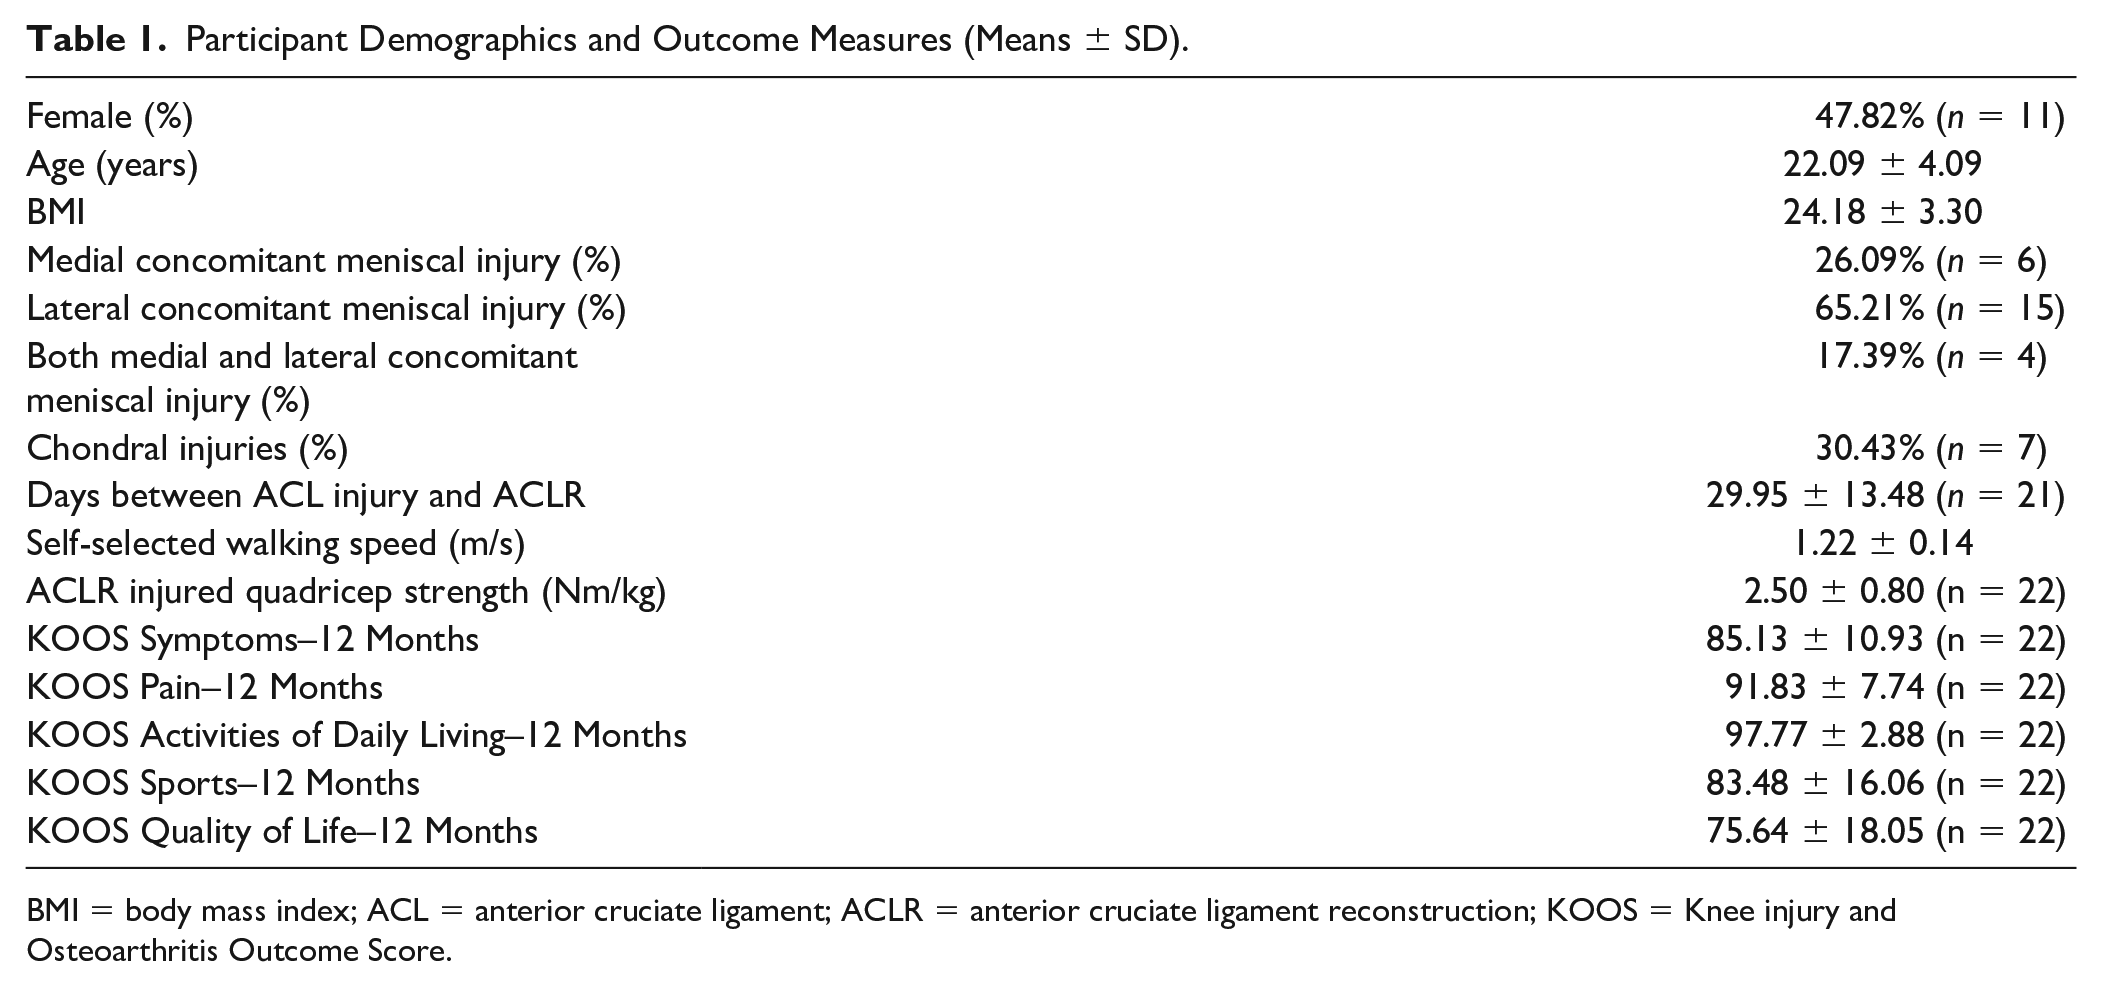
BMI = body mass index; ACL = anterior cruciate ligament; ACLR = anterior cruciate ligament reconstruction; KOOS = Knee injury and Osteoarthritis Outcome Score.
Gait Analysis
All gait trials were performed barefoot at the participants’ habitual walking speed according to a previously established protocol. 2 Practice trials allowed all participants to become acclimated to walking across the 6 m laboratory walkway prior to data collection. Once participants reported feeling comfortable, a minimum of five walking trials were collected to determine self-selected walking speed using timing gates (TF100, TracTronix). The laboratory walkway included 3 embedded force plates (Bertec, Columbus, OH) staggered in a manner that allowed for ground reaction force collection from both limbs during a single trial. Five testing trials were collected, and force data were sampled at 1200 Hz and lowpass filtered at 10Hz (4th-order recursive Butterworth). vGRF trials were averaged for each participant, time-normalized to 101 unique points of stance phase between heel strike (vGRF>20N) and toe off (vGRF<20N) and normalized to the participant’s body weight (N, [BW]; Fig. 1 ). Data extraction, filtering, and time normalization were performed using Visual 3D (C-Motion, Germantown, MD; 2020 x64).
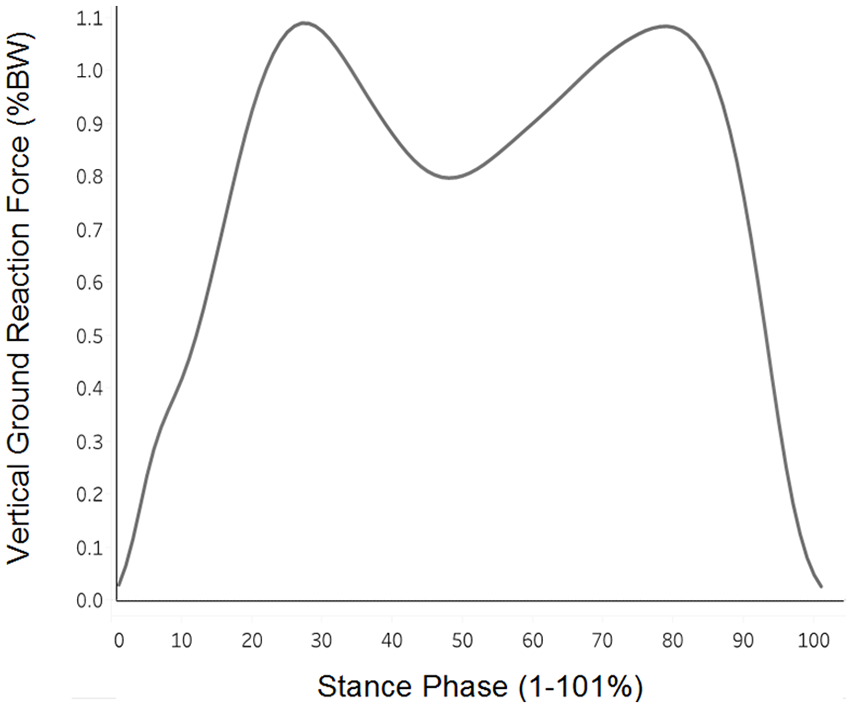
Vertical ground reaction force (vGRF) across stance phase: Group mean vGRF (% body weight) is illustrated across 100 points of stance phase (1%-101%), beginning from heel strike to toe off.
MRI Acquisition and T1ρ Calculation
MRI was acquired on the ACLR limb using either a Siemens Magnetom TIM Trio 3T scanner using a 4-channel Siemens large flex coil (516 mm × 224 mm, Siemens, Munich, Germany), or a Siemens Magnetom Prisma 3T PowerPack scanner with a XR 80/200 gradient coil (60 cm × 213 cm, Siemens, Munich, Germany). High inter-scanner reliability was demonstrated previously (intra-class correlation coefficient [ICC] >0.96, coefficient of variation range = 1.46%-5.02%). 30 All participants were subjected to an unloading period of 30 minutes prior to the scan to offload knee cartilage. The study utilized T1ρ prepared 3-dimensional Fast Low Angle Shot (FLASH) with a spin-lock power at 500 Hz, 5 different spin-lock durations (40, 30, 20, 10, 0 ms) and a voxel size of 0.8 mm × 0.4 mm × 3 mm (field of view = 288 mm, slice thickness = 3.0 mm, repetition time [TR] = 9.2 ms, echo time [TE] = 4.6 ms, averaging = 1, bandwidth = 350Hz, acquisition time range: 700-900 seconds [depending on the number of slices], range of number of slices acquired = 28-36 slices, 160 × 320 matrix, gap = 0 mm, flip angle = 10°, echo-train duration time = 443 ms, phase encode direction of anterior/posterior).2,23 Voxel by voxel T1ρ relaxation times were created from a 5-image sequence using a custom MatLab program (MatLab R2014b [8.4.0] MathWorks, Natick, MA, USA) using the following equation: S(TSL) = S0 exp(-TSL/T1ρ). 30 TSL denotes the duration of the spin-lock time, S0 is signal intensity when TSL equals zero, S corresponds to signal intensity, and T1ρ is the T1 relaxation time in the rotating frame.
MRI Segmentation
Articular cartilage was manually segmented using ITK-Snap software. 35 An expert segmentor utilized the images acquired during the 0 ms spin-lock duration to manually segment articular cartilage of the medial and lateral portions of the femoral and tibial condyles. Strong reliability has been reported for all regions of interest (ROI) using these methods (intra-rater reliability, N = 8, ICC = 0.80-0.97; inter-segmentor reliability, N = 10, ICC = 0.75-0.98).2,28 A fellowship-trained musculoskeletal radiologist (DN) confirmed the segmentation accuracy. Anterior, central, and posterior regions of interest (ROI) were determined for the medial and lateral femoral (MFC and LFC) and tibial (MTC and LTC) condyles. ROI were determined by the location of the meniscus in the sagittal plane and included (1) the articular cartilage communicating with the anterior horn of the meniscus (anterior MFC/LFC and MTC/LTC), (2) the central portion of the articular cartilage between the anterior and posterior horns of the meniscus (central MFC/LFC and MTC/LTC), and (3) the articular cartilage communicating with the posterior horn of the meniscus (posterior MFC/LFC and MTC/LTC). 28 Primary analyses for this study utilized global weightbearing T1ρ relaxation time values made up of the anterior, central, and posterior ROI for each condyle. Greater T1ρ MRI relaxation times are interpreted as lesser cartilage proteoglycan density. 36
Statistical Analysis
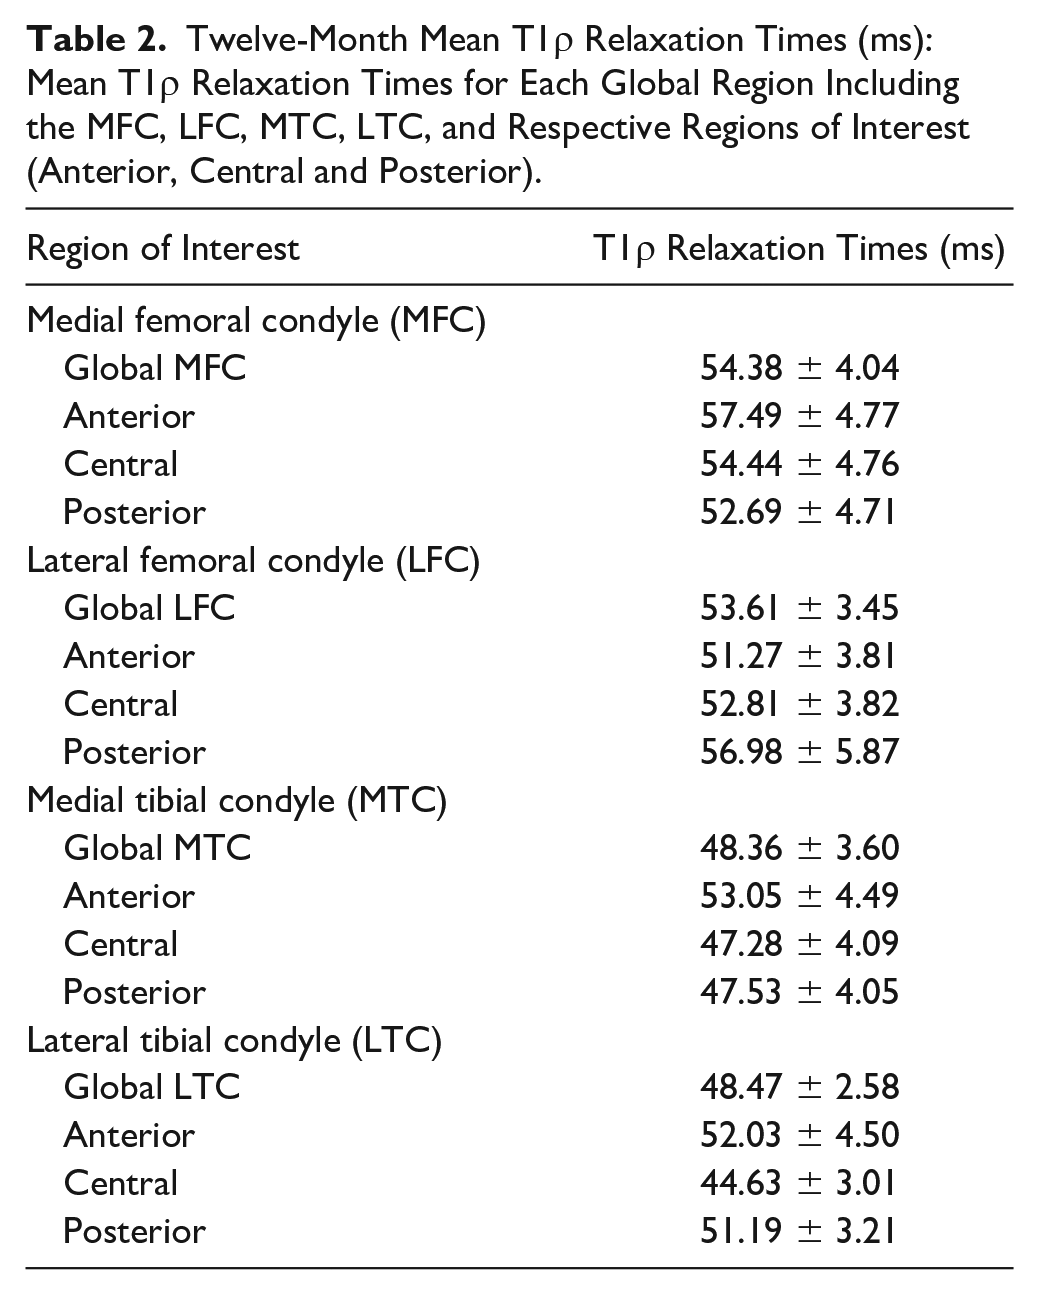
As appropriate, frequencies and percentages or means and standard deviations were calculated for participant demographics ( Table 1 ) and T1ρ relaxation times for each global region ( Table 2 ). Box-and-whisker plots were used to assess normality of T1ρ relaxation times, and any data points exceeding 3 standard deviations from the mean would be identified as statistical outliers and removed from final analysis.
Twelve-Month Mean T1ρ Relaxation Times (ms): Mean T1ρ Relaxation Times for Each Global Region Including the MFC, LFC, MTC, LTC, and Respective Regions of Interest (Anterior, Central and Posterior).
Primary analyses
Bivariate, Pearson product moment correlation coefficients (r) were used to estimate strength of associations between T1ρ relaxation times in the medial and lateral tibiofemoral cartilage with vGRF separately at each 1% increment of stance phase (1%-101%). We categorized associations as weak (|r| between 0.0 and 0.29), moderate (|r| between 0.3 and 0.5), or strong (|r|>0.5). 37
Corresponding 95% confidence intervals (CI) were constructed for each Pearson correlation coefficient at each 1% of stance phase using Fisher’s transformation. Strength, magnitude, and direction of associations were reported. Data were not corrected for multiple comparisons due to the exploratory nature of the analysis. We reported correlations for portions of the stance phase that demonstrated at least moderate Pearson product moment correlation coefficient (≥ 0.30); yet, we sought to focus our discussion around specific correlation coefficients with 95% CIs that did not include 0. All statistical analyses were conducted using Statistical Analysis Software (SAS; Cary, NC).
Secondary follow-up analyses of anterior, central, and posterior subsections
If correlations with 95% CIs not including 0 were found between vGRF and a global weightbearing ROI, we conducted further secondary analyses to determine the associations between vGRF and anterior, central, and posterior ROI subsections of the global region. Pearson product moment correlation coefficient (r) values estimated the strength of relationship between T1ρ relaxation times in the ROI subsections with vGRF in increments of 1% across stance phase. The 95% CIs were calculated around each Pearson product moment correlation coefficient using Fisher’s transformation. Associations with 95% CIs that did not include 0 were reported in the narrative.
Post hoc analysis
Our a priori primary analyses identified the strongest associations between T1ρ relaxation times and vGRF during midstance portions of stance phase. Therefore, we conducted post hoc analyses to determine whether discrete measures related to midstance vGRF values were associated with global tibiofemoral T1ρ relaxation times and accompanying ROI. First, we defined the local minimum of the vGRF waveform as the lowest vGRF (%BW) between the first and second vGRF peaks. Next, we determined the first and second vGRF peaks and calculated difference scores between the first (Peak 1-Minimum) and second (Peak 2-Minimum) vGRF peaks and the local vGRF minimum. A lower Peak 1-Minimum or Peak 2-Minimum value was indicative of a flatter waveform between those two points. In the same manner as the primary and secondary analyses, Pearson product moment correlation coefficients (r) were used to estimate the strength of relationship between these variables with T1ρ relaxation times. The 95% CIs were constructed, and correlations with 95% CIs that did not include 0 were discussed in the narrative. Primary analyses found the strongest associations between T1ρ relaxation times with vGRF within the weightbearing global MFC; therefore, we conducted post hoc analyses between variables with the global MFC, as well as with the anterior, central, and posterior MFC ROI subsections. Furthermore, walking speed is associated with T1ρ relaxation times 2 and alterations in vGRF in ACLR individuals; 16 therefore, we conducted partial correlations between T1ρ relaxation times and discrete vGRF outcomes accounting for walking speed as a sensitivity analysis.
Results
Twenty-three participants (22.09 ± 4.09 years; 47.82% female) were included in this study and no statistical outliers were identified ( Table 1 ). Mean T1ρ relaxation times are reported by weightbearing global region and ROI subsections ( Table 2 ).
A Priori Analysis
Medial femoral condyle
Greater vGRF during midstance of gait (46%-56% of stance phase) was associated with greater MFC T1ρ MRI relaxation times (r ranging between 0.43 and 0.46 with all 95% CIs not including 0) ( Fig. 2A ). As a secondary analysis, weak associations (r ranging between −0.29 and 0.29 with all 95% CIs including 0) were observed between vGRF and the anterior MFC throughout the entire stance phase ( Fig. 3A ). In the central MFC, greater vGRF during midstance (45%-55% of stance) was associated with greater T1ρ MRI relaxation times (r ranging between 0.43 and 0.50 with all 95% CIs not including 0), and lesser vGRF during late stance (74%-78% of stance) was associated with greater T1ρ MRI relaxation times (r ranging between −0.45 and −0.43 with all 95% CIs not including 0; Fig. 3B ). In the posterior MFC, greater vGRF during midstance (36%-53% of stance) was associated with greater T1ρ MRI relaxation times (r ranging between 0.43 and 0.54 with all 95% CIs not including 0; Fig. 3C ).
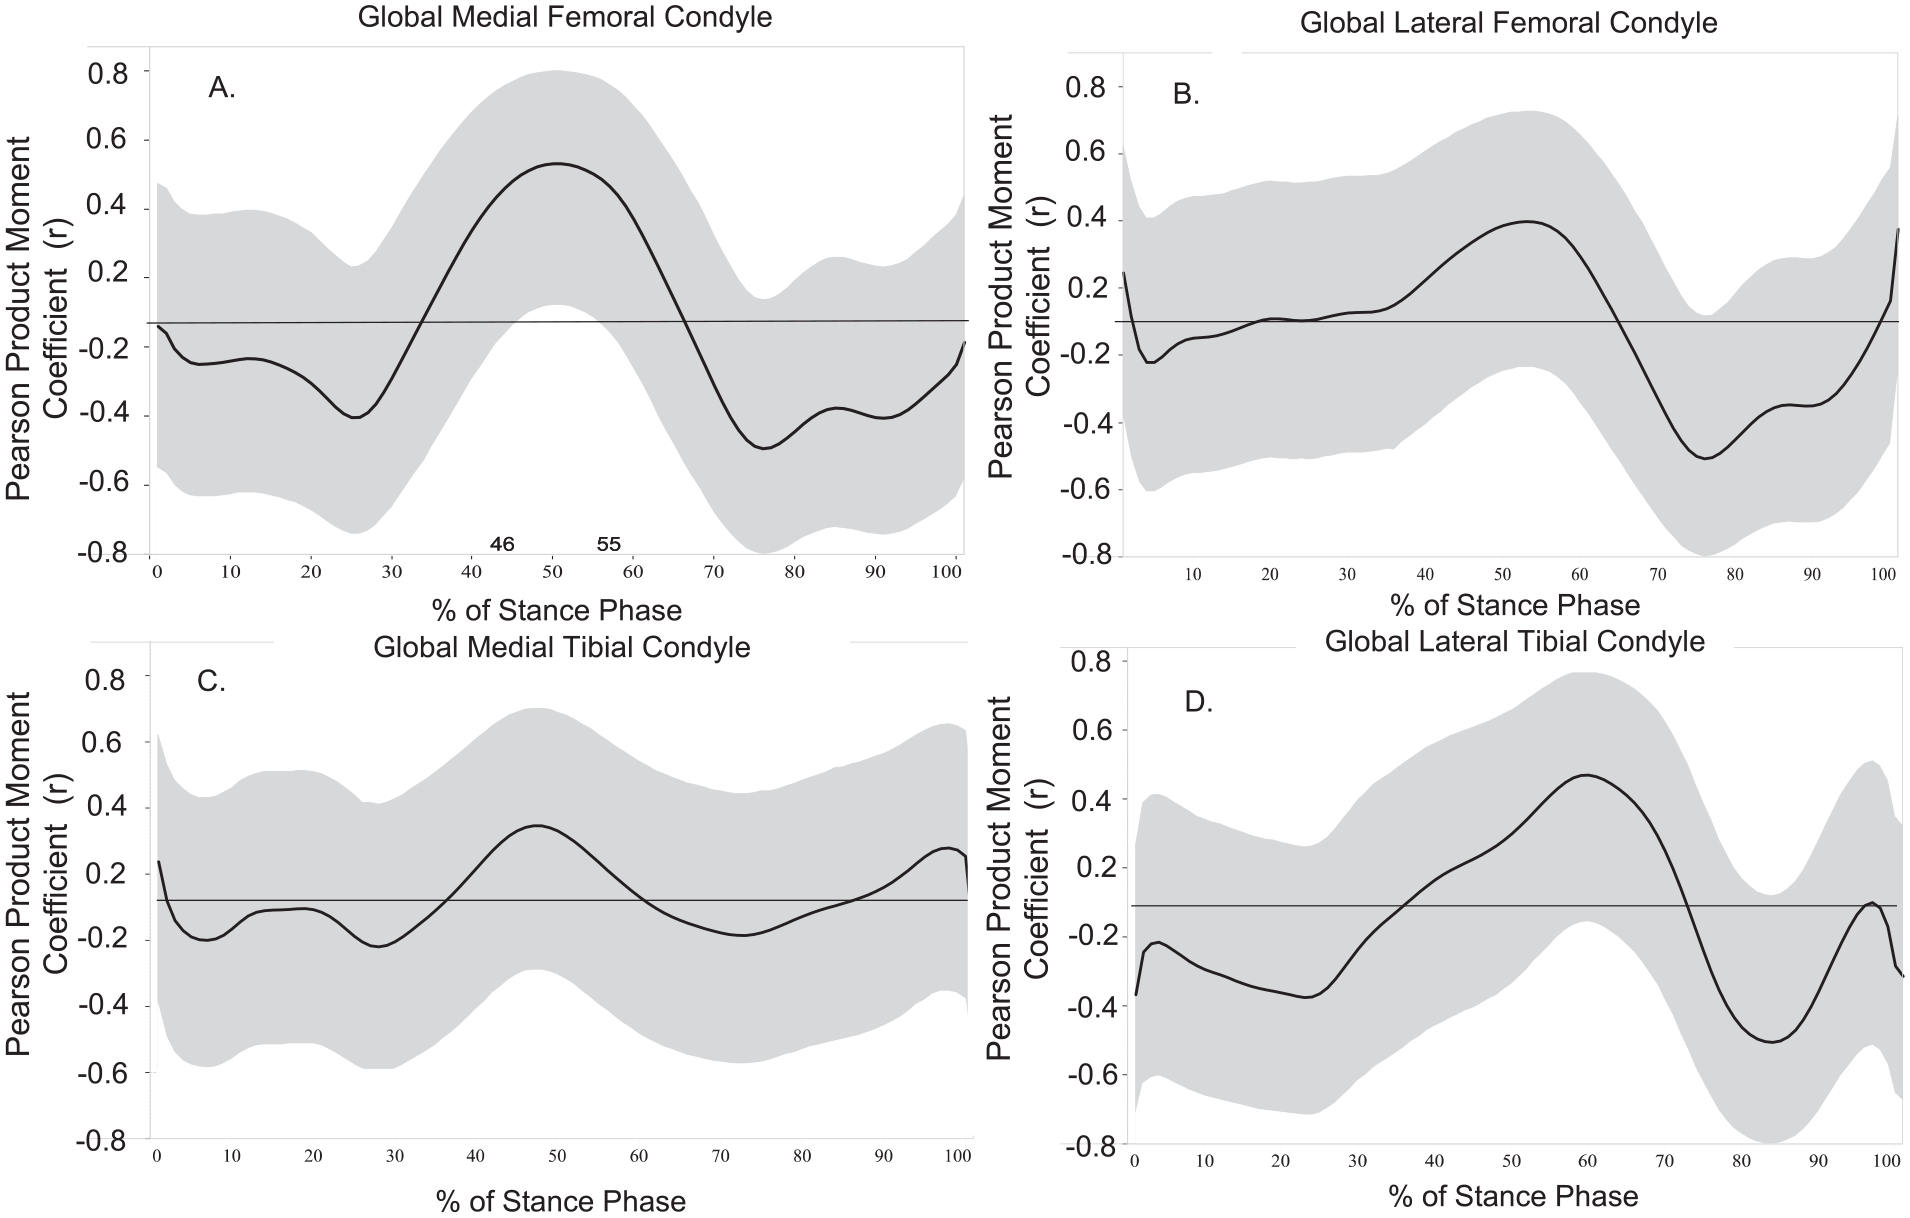
Vertical ground reaction force (vGRF) and global T1ρ relaxation times (ms): Associations between global tibiofemoral articular cartilage regions (
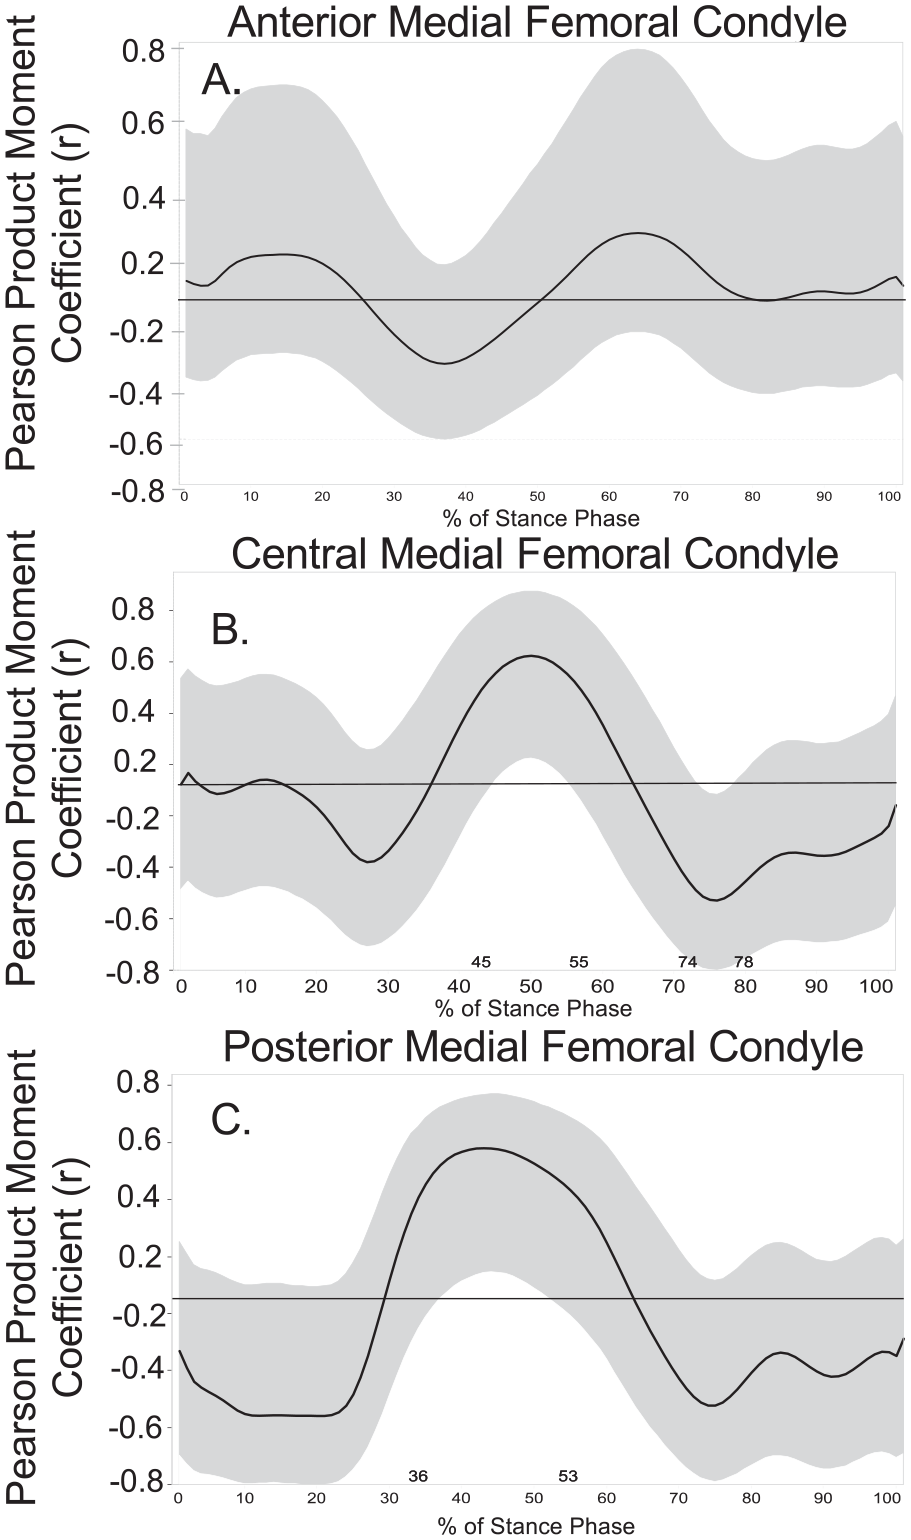
Vertical ground reaction force (vGRF) and regions of interest (ROI) T1ρ relaxation times (ms). Associations between Medial Femoral Condyle T1ρ relaxation times with vGRF by ROI (
Lateral femoral condyle
Weak to moderate associations were found between global LFC T1ρ relaxation times and vGRF across the entire stance phase; however, all 95% CIs in the LFC included 0 (r ranging between 0.31 and −0.40; Fig. 2B ). The moderate associations identified included greater vGRF during midstance (51%-55% of stance) and greater T1ρ relaxation times (r ranging between 0.30 and 0.31), as well as lesser vGRF during late stance (72%-82% of stance phase) and greater T1ρ relaxation times for the global LFC (r ranging between −0.40 to −0.30).
Medial tibial condyle
Weak associations were found between global MTC T1ρ relaxation times and vGRF across the entire stance phase (r ranging between −0.14 and 0.23 with all 95% CIs including 0; Fig. 2C ).
Lateral tibial condyle
Greater vGRF during midstance (54%-66% of stance phase) was moderately associated with greater LTC T1ρ relaxation times (r ranging between 0.30 and 0.38 with all 95% CIs including 0; Fig. 2D ). Lower vGRF during late stance (79%-88% of stance phase) was moderately associated with greater LTC T1ρ relaxation times (r ranging between −0.39 and −0.32 with all 95% CIs including 0).
Post hoc analysis
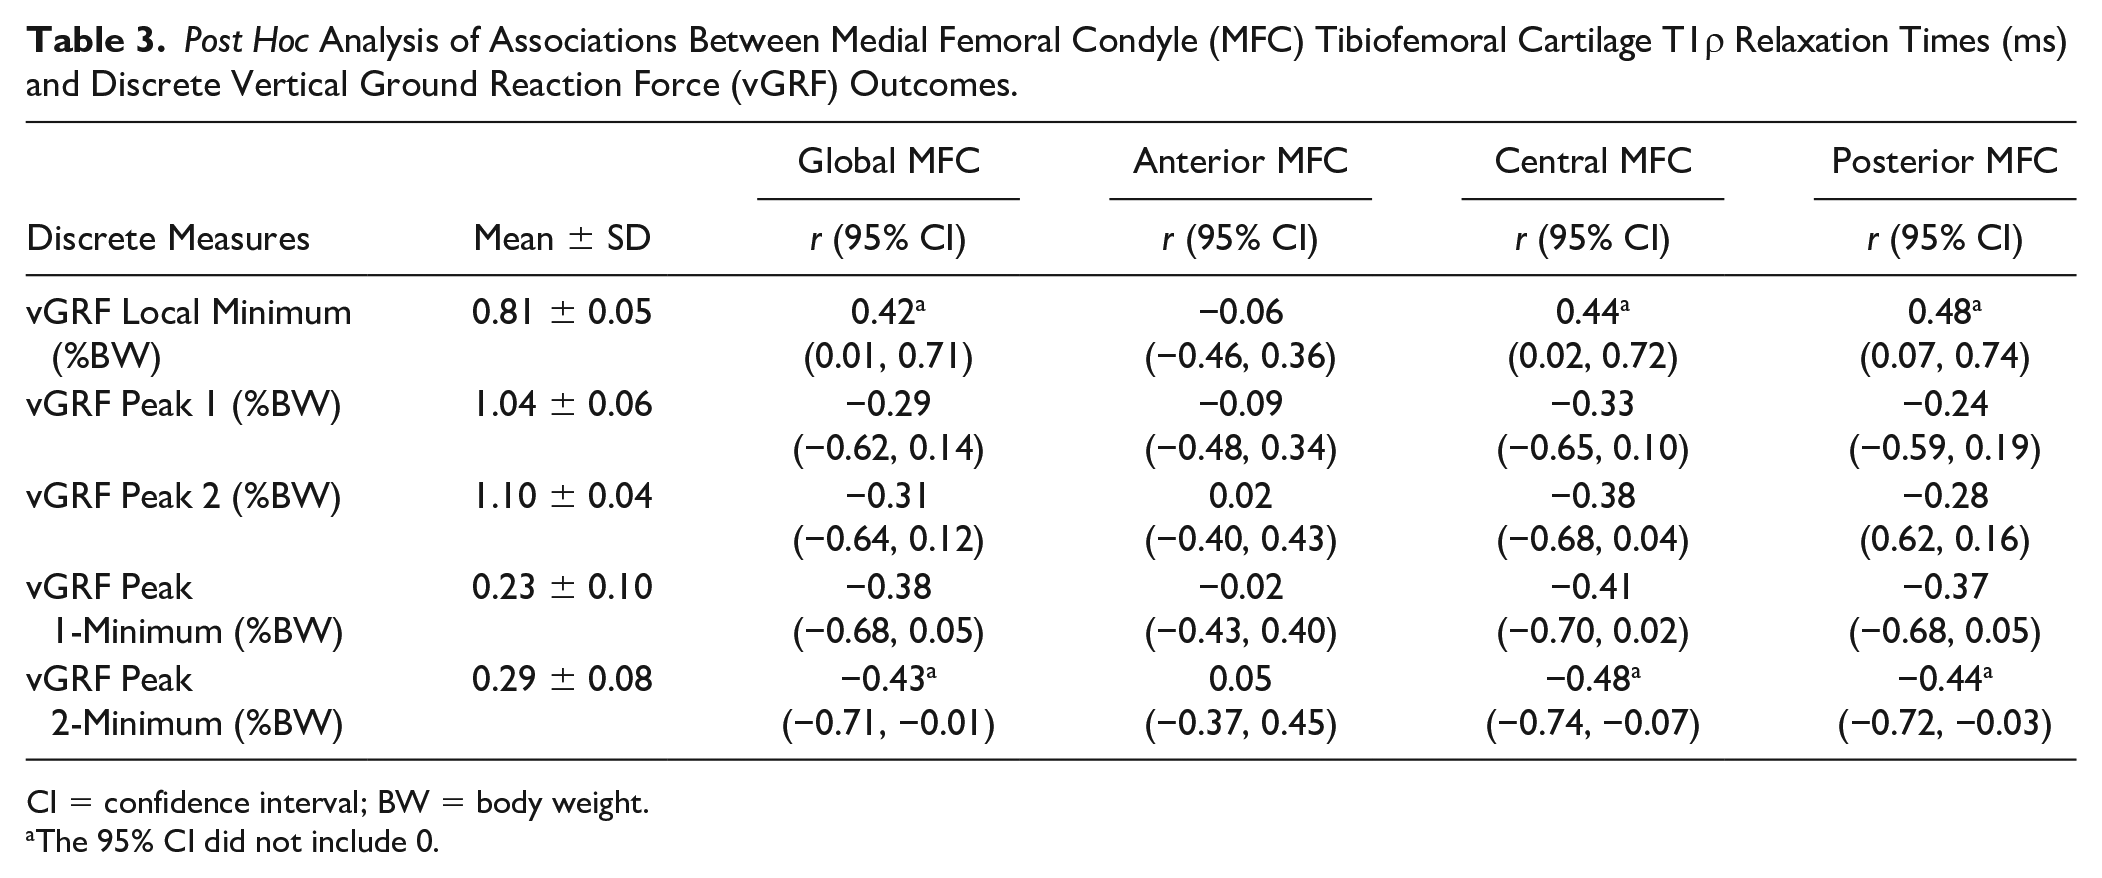
A greater local minimum was associated with greater MFC T1ρ relaxation times in the global (r = 0.42; 95% CI [0.01, 0.71]), central (r = 0.44; 95% CI [0.02, 0.72]), and posterior (r = 0.48; 95% CI [0.07, 0.74]; Table 3 ) MFC ROI. Smaller Peak 1–minimum values were associated with greater T1ρ relaxation times in both the central (r = −0.41; 95% CI [−0.70, 0.02]) and posterior (r = −0.37; 95% CI [−-0.68, 0.05]) MFC ROI. Smaller Peak 2-minimum values were associated with greater T1ρ relaxation times in the global (r = −0.43; 95% CI [−0.71, −0.01]), central (r = −0.48; 95% CI [−0.74, −0.07]] and posterior (r = −0.44; 95% CI [−0.72, −0.03]) MFC ROI. Lower vGRF at Peak 1 (r = −0.33; 95% CI [−0.65, 0.10]) and Peak 2 (r = −0.38; 95% CI [−0.68, 0.04]) were associated to greater MFC T1ρ relaxation times in the central subregion. All other correlations demonstrated|r|< 0.3 and a 95% CI that included 0 ( Table 3 ). Walking speed demonstrated negligible influence on post hoc discrete outcome measures (Supplementary Table S1).
Post Hoc Analysis of Associations Between Medial Femoral Condyle (MFC) Tibiofemoral Cartilage T1ρ Relaxation Times (ms) and Discrete Vertical Ground Reaction Force (vGRF) Outcomes.
CI = confidence interval; BW = body weight.
The 95% CI did not include 0.
Discussion
We hypothesized that associations between vGRF and MRI estimates of articular cartilage composition would extend beyond the first vGRF peak, which has been exclusively evaluated by previous studies,25,26,32 to other portions of stance phase of gait. Consistent with our hypothesis, greater vGRF during midstance associated with greater T1ρ relaxation times in the MFC, with the strongest associations found in the central and posterior MFC ROIs. Our higher local minimum was associated with greater T1ρ MRI relaxation times in the central and posterior MFC. A smaller range between the second vGRF peak and the local vGRF minimum was also associated with greater T1ρ MRI relaxation times in the same central and posterior MFC. To our knowledge, this is the first study to examine the association between T1ρ MRI relaxation times and vGRF sequentially across the entire vGRF waveform and introduce discrete measures to characterize the association between T1ρ MRI relaxation times and the midstance of gait. Previous work, studying primarily peak kinetic outcomes, demonstrates a complex interplay between gait biomechanics and tibiofemoral joint tissue health following ACLR.1,4,14,38,39
Our study further indicates the link between greater loading during midstance and greater MFC T1ρ relaxation times, suggesting the potential importance that offloading the ACLR limb during midstance may have on articular cartilage health. These data suggest that future studies evaluating gait kinetics and joint tissue health following ACLR consider the importance of including outcomes related to midstance.
Our cross-sectional study is not able to determine causality between gait outcomes and tibiofemoral articular cartilage T1ρ relaxation times. Indeed, previous work has demonstrated deleterious changes in tibiofemoral articular cartilage T1ρ relaxation times may be associated with biological joint tissue changes that occur early following ACL injury, 40 suggesting that factors other than joint loading have a role in early articular cartilage composition changes. Specifically, other work demonstrates higher synovial fluid concentrations of biomarkers related to joint inflammation collected within 15 days of ACL injury associate with aberrant joint loading 6-months following ACLR, 41 thereby offering evidence that early biological and joint tissue compositional changes may influence the development of aberrant gait biomechanics. Conversely, there is evidence that altered loading of the tibiofemoral joint may influence T1ρ relaxation times. Specifically, non-weightbearing for 6 to 8 weeks following an ankle injury results in increased T1ρ relaxation times (i.e. decreased proteoglycan density) of the tibiofemoral articular cartilage, which was reversible within 4 weeks of reintroduction to normalized loading. 42 Therefore, it is plausible that suboptimal gait biomechanics developed following ACLR may contribute to alter tibiofemoral articular cartilage composition.
Previous research demonstrates that ACLR individuals exhibit flatter or less dynamic vGRF waveforms (i.e. lesser vGRF peaks and a greater midstance vGRF) in the ACL injured limb compared with both the contralateral uninjured limbs and uninjured controls in the first 12 months following ACLR. 16 A flatter and less dynamic vGRF waveform with greater vGRF during midstance may be reflective of greater sustained loading across the limb during a single step. Articular cartilage is viscoelastic and responds to the application of load in a time-dependent and non-linear manner.43,44 Healthy articular cartilage is heavily hydrated, reflective of its mechanistic dependency upon water during weightbearing load applications. 45 Proteoglycans bind to water and help to maintain hydration levels within the tissue.29,45 When a load is applied, pressure within the extracellular matrix increases and fluid exits only to return when the load is removed. 45 Sustained loading across the extremity without a period of unloading during midstance may result in reduced interstitial fluid flow within the cartilage and may be problematic for cartilage metabolism, limiting the capacity to transport necessary nutrients to the tissue and subsequently alter the articular cartilage composition over time.16,18 We found greater vGRF during midstance, a portion of stance that typically exhibits unloading following the first vGRF peak and prior to the second vGRF peak, exhibited the strongest associations with T1ρ relaxation times. Our findings may support the hypothesis that sustained lower extremity loading, represented by a greater midstance vGRF, is linked to altered tibiofemoral articular cartilage composition following ACLR; yet, future research is needed to determine whether modifying vGRF during midstance can alter T1ρ relaxation times of the articular cartilage.
The strongest associations between vGRF and T1ρ relaxation times were located in the central and posterior MFC. Our results are consistent with previous research demonstrating that the medial tibiofemoral compartment is most commonly associated with the development of early knee osteoarthritis onset 46 and T1ρ relaxation times in the MFC compartment are elevated in the ACLR limb within the first 12 to 16 months compared with the contralateral limb 26 and healthy controls at 12 months post-ACLR. 47 Previous work demonstrates that cuing ACLR individuals to walk with a flattened vGRF waveform results in the development of “crouched gait pattern” characterized by greater overall knee flexion and less overall knee excursion throughout stance. 8 Previous research has shown lesser quadricep strength associates with greater T1ρ relaxation times in the MFC 48 and further emphasizes the importance of addressing quadricep strength deficits early post-ACLR. While our study focused on vGRF and did not measure kinematics, it is possible that gait profiles combining a flattened vGRF waveform and “crouched gait” kinematics may contribute to the strongest associations between vGRF and T1ρ relaxation times found in the central and posterior MFC articular cartilage regions. Future studies should evaluate the influence of knee kinematics and other knee kinetics throughout stance on tibiofemoral articular cartilage T1ρ MRI relaxation times to understand how changes in vGRF and knee kinematics may contribute to altered loading in specific tibiofemoral regions. Biomechanical interventions that seek to modify gait kinetics following ACLR should consider the ability of the intervention to properly modify loading at midstance in addition to peak loading at early and late stance. Previous research suggests that peak gait biomechanics in patients with knee osteoarthritis may not be responsive to pain relieving interventions 49 suggesting other portions of stance phase should be assessed to determine if therapeutic interventions impact other percentages of stance phase in patients with musculoskeletal conditions. In addition, previous research has demonstrated that using real-time gait biofeedback (RTGBF) to cue an increase in the first vGRF peak results in a subsequent decrease of vGRF during midstance and greater overall knee flexion excursion. 8 Therefore, RTGBF may be a plausible intervention to increase the overall dynamic nature of the vGRF waveform and decrease vGRF at midstance. Future studies should examine the mechanistic link between restoring normal gait through RTGBF and its effects on tibiofemoral articular cartilage composition.
While the current study provides novel information regarding the link between lower extremity loading during midstance and tibiofemoral articular cartilage composition, there are some limitations that can inform future research. The current study is cross-sectional and references a 12-month post-ACLR timepoint; therefore, we are unable to generalize these findings to other clinical timepoints before and after ACLR. All participants were prescribed physical therapy; however, compliance was not measured as a part of this study. We did not evaluate associations between vGRF loading and T1ρ relaxation times with respect to the contralateral limb, and future studies should consider evaluating similar associations in uninjured limbs. Our post hoc sensitivity analysis did not find habitual gait speed to strongly influence the associations between the local vGRF minimum and T1ρ MRI relaxation times; yet, it remains unknown how these associations would be influenced by different walking speeds. We also recognize kinetic testing occurred in a laboratory environment and future studies should examine the association between vGRF collected in a real-world setting and T1ρ MRI relaxation times. We consider this initial exploratory study to be hypothesis-generating and correspondingly, did not perform any statistical testing or correct for multiple testing; instead, our discussion focused on moderate associations with definitive 95% CI. While all participants received a standardized bone-patellar-tendon bone autograft, we did not correct for concomitant intra-articular knee injury due to the exploratory nature of the analysis. Approximately, 68% and 46% of ACL injured patients exhibit a concomitant meniscal injury or articular cartilage lesion (i.e., chondral), respectively. 34 Similarly, a high percentage of concomitant injuries was present within our sample, with only 2 individuals sustaining isolated ACL injuries. Unfortunately, we were not powered in the current study to explore whether our outcomes would differ for individuals with and without concomitant injuries. Future research should explore the influence of concomitant intra-articular injuries and other graft types on the associations between vGRF during midstance and T1ρ MRI relaxation times.
In conclusion, greater vGRF during midstance was most strongly associated with greater T1ρ relaxation times within the MFC. This study may suggest that a greater loading magnitude during midstance relates to deleterious tibiofemoral articular cartilage compositional changes within weightbearing regions of the tibiofemoral joint and is concerning for early PTOA development.
Supplemental Material
sj-docx-1-car-10.1177_19476035211072220 – Supplemental material for Loading during Midstance of Gait Is Associated with Magnetic Resonance Imaging of Cartilage Composition Following Anterior Cruciate Ligament Reconstruction
Supplemental material, sj-docx-1-car-10.1177_19476035211072220 for Loading during Midstance of Gait Is Associated with Magnetic Resonance Imaging of Cartilage Composition Following Anterior Cruciate Ligament Reconstruction by Elizabeth Bjornsen, Todd A. Schwartz, Caroline Lisee, Troy Blackburn, David Lalush, Daniel Nissman, Jeffrey Spang and Brian Pietrosimone in CARTILAGE
Footnotes
Acknowledgments and Funding
The author(s) disclosed receipt of the following financial support for the research, authorship and/or publication of this article: Research reported in this article was supported by the National Institute of Arthritis and Musculoskeletal and Skin Diseases of the National Institutes of Health (R03AR066840), Core Center for Clinical Research (P30AR072580), North Carolina Translational and Clinical Sciences Institute, and National Athletic Trainers Association Research and Education Foundation (NewInv001). The results of the current study are presented clearly, honestly, and without fabrication, falsification, or inappropriate data manipulation.
Declaration of Conflicting Interests
The author(s) declared no potential conflicts of interest with respect to the research, authorship, and/or publication of this article.
References
Supplementary Material
Please find the following supplemental material available below.
For Open Access articles published under a Creative Commons License, all supplemental material carries the same license as the article it is associated with.
For non-Open Access articles published, all supplemental material carries a non-exclusive license, and permission requests for re-use of supplemental material or any part of supplemental material shall be sent directly to the copyright owner as specified in the copyright notice associated with the article.