
Abstract
Objective
Cartilage tissue engineering has evolved as one of the therapeutic strategies for cartilage defect, which relies on a large number of viable chondrocytes. Because of limited availability of cartilage and low chondrocytes yield from cartilage, the need for an improve isolation protocol for maximum yield of viable cells is a key to achieving successful clinical constructs. This study optimizes and compares different protocols for isolation of chondrocytes from cartilage.
Design
We employed enzymatic digestion of cartilage using collagenase II and trypsin. The chondrocytes yield, growth kinetics, aggrecan, and collagen type 2 (COL2) expression were evaluated. Collagen type 1 (COL1) mRNA expression was assessed to monitor the possibility of chondrocytes dedifferentiation.
Results
Chondrocyte yield per gram of cartilage was significantly higher (P < 0.05) using collagenase II in Hank’s balanced salt solution (HBSS) compared with 0.25% trypsin. The number of chondrocyte yield per gram was higher in cartilage digested with collagenase in HBSS compared with Dulbecco’s modified Eagle medium/F12; however, the difference was not statistically significant. Chondrocytes seeded at lower densities had shorter population doubling time compared to those seeded at higher density. Protein and gene expression of chondrocyte phenotype indicates the expression of aggrecan and COL2. The expression of COL1 was significantly increased (P < 0.05) in passage 3 compared with primary chondrocytes. The mRNA expression of chondrocyte phenotype was similar in primary and passaged one cells.
Conclusions
Collagenase in HBSS yield the highest number of viable chondrocytes and the isolated cells expressed chondrocyte phenotype. This protocol can be employed to generate large number of viable chondrocytes, particularly with limited cartilage biopsies.
Introduction
Articular cartilage defect is a major cause of morbidity and socioeconomic burden in the ageing population. 1 One major therapeutic strategy for articular cartilage repair is matrix-assisted autologous chondrocyte implantation (MACI), an improved form of the first generation, autologous chondrocyte implantation (ACI), which has shown promising results. 2 The technique involves isolation, culture expansion, and implantation of autologous chondrocytes on membrane or scaffold. 1 ACI was first used for the treatment of cartilage defects in humans in 1987 and was first reported by Brittberg et al. 3 in 1994. A key step in ACI/MACI is cell isolation, which is usually obtained through the mechanical or enzymatic breakdown of tissue biopsies and subsequent expansion in culture medium in a sterile condition. The use of collagenase for chondrocyte isolation from cartilage has been previously reported.3-5
Cartilage is somewhat acellular tissue with only 5% to 10% of its volume comprising chondrocytes. 6 The need for large populations of viable chondrocytes has been a major challenge for tissue engineering using primary cells for the repair of cartilage defects. The cell yield from cartilage digest is typically low (less than 20% of the total available cells) and the procedure outcome varies due to disparities between donors and user competency. 7 Despite this limitation, a high cell density is critical for the maintenance of chondrocyte phenotype and matrix synthesis 8 and remains a major challenge in cartilage repair. In order to improve on the cell yield required for cartilage repair, in vitro cell expansion has been employed. This process may be futile because chondrocytes expansion in a monolayer or passaged chondrocytes can undergo dedifferentiation, thereby exhibiting a more fibroblastic phenotype characterized by increased expression of collagen type 1 relative to collagen type 2.9,10 As such, this may negatively affect the capacity of chondrocytes for effective cartilage regeneration9,11 and poses a considerable limitation in existing regenerative therapeutic approaches using expanded populations of chondrocytes.
A report indicated that total knee replacement surgeries contributed large amounts of biological waste to operating rooms waste production. 12 Cartilage biopsies that are removed during total knee arthroplasties are biological waste that can be harness for the isolation of viable primary chondrocytes for cartilage tissue engineering. Chondrocytes represent the most frequently used cell type for cartilage tissue engineering. Subsequently, tissue engineering always consumes many cells and as such, optimized protocol for isolation of chondrocytes could form a powerful tool to boost the yield of chondrocytes for cartilage regeneration. Oseni et al. 6 stated that the necessity to include a predigest step in multistep approaches for the isolation of chondrocytes added no advantage in increasing the number of viable chondrocytes. In manipulating the exposure of cartilage to enzymatic digestion, the concentration and incubation time are key determinants factors for isolation of viable chondrocytes. This is because prolonged exposure to harsh enzyme condition could affect the viability, proliferative and matrix forming capacities of isolated chondrocytes. 1 Furthermore, isolation of chondrocytes can be utilized for MACI to repair cartilage defect or could allow valuable models to study the preservation of cartilage-specific phenotype, molecular characteristics, and responses to cellular changes in the cartilage tissues. 13
Therefore, this study optimizes protocol for isolation of primary chondrocytes from cartilage for possible tissue engineering or study in vitro osteoarthritis model.
Materials and Methods
Cartilage Biopsies
The protocol was approved by the Medical Research and Ethics Committee, Ministry of Health, Malaysia with reference number [KKM.NIHSEC/P17-1554 (5)]. Written informed consent was obtained from the patients. Cartilage specimens of osteoarthritic patients (n = 24, age = 40-70 years) undergoing total knee arthroplasty (TKA) in Serdang Hospital, Selangor, Malaysia were obtained from femoral condyles and tibial plateau of the knee joint under aseptic conditions and immersed in a sterile bottle containing an appropriate amount of phosphate buffered saline (PBS) with 1% penicillin-streptomycin-amphotericin B (Corning, NY, USA) and transported immediately to laboratory for further processing.
Cartilage Preparation for Digestion
Three methods were employed for the isolation of primary chondrocytes. Macroscopically healthy part of the cartilage was washed 3 times with PBS (Gibco, Waltham, MA, USA) containing 1% penicillin-streptomycin-amphotericin B (Corning). The cartilage was then minced with sterile scalpel blade into small pieces (approximately 2 × 2 mm) in a petri dish containing PBS. The minced cartilage was then digested with either trypsin or collagenase II. The latter was either dissolved in Hank’s balanced salt solution (HBSS with calcium and magnesium; Gibco) or Dulbecco’s modified Eagle medium/Nutrient Mixture F-12 (DMEM/F-12) supplemented with 5% fetal bovine serum (FBS).
Cartilage Digestion Using Trypsin-EDTA
Cartilage digestion was done as described previously 13 with slight modification. The 1× PBS containing minced cartilage was carefully removed by a pipette and the petri dish was immediately filled with 10 mL solution of 0.25% trypsin-EDTA (ScienCell, Carlsbad, CA, USA) per gram of cartilage. The cartilage pieces were then digested for 3 hours or overnight (20 hours) at 37°C and 5% CO2, followed by addition of 20 mL of DMEM/F-12 with glutamine (Gibco) to the cell suspension. The cell suspension was then filtered with 70-µm cell strainer (Falcon, BD, Franklin Lakes, NJ, USA) into to a 50 mL Falcon tube and centrifuged at 300g (4°C) for 10 minutes. The supernatant was carefully discarded and the cell pellet was resuspended in 20 mL of DMEM/F-12 and centrifuged at 200g for 5 minutes. The supernatant was again carefully discarded and the cell pellet was resuspended in 10 mL of DMEM/F-12 supplemented with 10% FBS (Gibco) and 1% antibiotic-antimycotic (Corning). The cell number and viability was determined by trypan blue dye exclusion test.
Cartilage Digestion Using Collagenase II in HBSS
In this protocol, collagenase II in HBSS was utilized for the dissociation of cells from primary tissue. The PBS containing minced cartilage was carefully removed with a pipette and the petri dish was immediately filled with 10 mL solution of different concentration (0.1% and 0.2%) of collagenase II (275 U/mg; Gibco) in HBSS per gram of cartilage. The cartilage pieces were then digested overnight (20 hours) at 37°C and 5% CO2. After overnight incubation, cell suspension was dispersed through a cell strainer (70 µm; Falcon) and washed 2 times by centrifugation in PBS without collagenase. The cell pellet was then resuspended after the final wash in DMEM/F-12 supplemented with 10% FBS (Gibco) and 1% antibiotic-antimycotic (Corning). Cell viability was determined by trypan blue dye exclusion test.
Cartilage Digestion Using Collagenase II in DMEM/F-12
The isolation of primary chondrocytes was done according to the method described by Tew et al. 14 with modification. Cartilage was diced in serum-free DMEM/F-12 and the media was then carefully removed by a pipette. The diced cartilage was digested in either 0.1% or 0.2% of collagenase II in DMEM/F-12 supplemented with 5% FBS (Gibco) and 1% antibiotic-antimycotic (Corning). Then, the diced cartilage was incubated overnight (20 hours) in 10 mL of collagenase II solution per gram of cartilage in an incubator at 37°C, 5% CO2. The cell suspension was then strained through a cell strainer (70 µm) and was centrifuged at 300g for 5 minutes to obtain a cell pellet. The pellet was then washed 2 times with DMEM/F-12 containing 10% FBS. Then, the cells were gently re-suspended in culture media and counted using trypan blue exclusion test. At the end of cartilage digestion with the three protocols, the cells were plated in tissue culture flasks at a density of 1 × 10⁴ or 2 × 10⁴ cells/cm2. The cells were observed regularly with the microscope and culture medium was changed every 3 days.
Chondrocyte Expansion
The morphology of the cells was examined regularly and the image was taken with a microscope. When the cells reached 80% to 90% confluence, they were trypsinized and the harvested chondrocytes (P0) were centrifuged and resuspended in culture medium. The cells were then replated at a density of 1 × 10⁴ cells/cm2 in a culture flask and this was repeated until 3 passages.
Chondrocyte Growth Curve
At 80% to 90% confluence, the chondrocytes (P2) were trypsinized and seeded at different densities (5 × 10³, 10 × 103, and 20 × 103 cells/ cm2) in 96-well plates (Corning). One hundred microliters of cell suspension was added to each well in quadruplicates for each seeding density and incubated at 37°C, 5% CO2 for 1, 2, 3, 4, 5, 6, and 7 days, respectively. Then, 10 µL of cell counting kit (CCK)-8 (Nacalai Tesque, Japan) was added to each well and incubated for another 3 hours. The background/control wells contain only the culture medium without the cells and the absorbance was measured at 450 nm using microplate reader (Sunrise, Tecan). The absorbance of the background was then subtracted from the absorbance of the samples. Growth rate (k) was determined from the growth curve using exponential regression as previously described. 15 The exponential regression model gives a fitted curve in the form of equation as shown below:

where Ni = number of live cells at time ti, N0 = initial number of cells, and k = growth rate.

Then, the equation was used to calculate the population doubling time (PDT). Regression analysis was performed to determine the type of relationship between seeding density and PDT.
Population Doubling Time of Chondrocytes
To validate the result of CCK-8, the PDT of chondrocytes were determined using cell count. The primary chondrocytes were trypsinized and plated in 6-well plates at densities of 5 ×10³, 10 ×103, and 20 × 103 cells/cm2 in triplicates. The cells were then incubated at 37°C, 5% CO2. At confluence, the cells were harvested by trypsinization (0.05% trypsin-EDTA) and the cells were counted using trypan blue exclusion test. PDT was calculated as previously described. 16
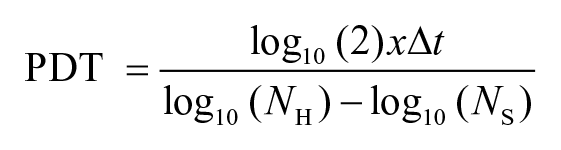
where NH = number of cells harvested, NS = number of cells seeded, and ∆t = duration of incubation.
Chondrocyte Staining for Proteoglycan
Proteoglycan synthesis by chondrocytes was evaluated with Alcian blue staining as previously described with slight modification. 17 Cells were seeded at a density of 10 × 103 cells/cm2 in a 24-well plate and incubated for 5 days. After incubation, the cells were fixed in 4% paraformaldehyde for 20 minutes at room temperature and stained with 1% Alcian blue (pH 2.5; Nacalai Tesque, Japan) overnight. Then, the cells were washed 3 times with distilled water and images were captured using a Nikon inverted microscope (Nikon Eclipse TS100).
Immunofluorescence
Isolated chondrocytes (P1) were seeded at a density of 4 × 10⁴ cells/well in 24-well plates and incubated at 37°C, 5% CO2 for 5 days. At day 5 of culture, the media was removed and cells in the monolayer were fixed in 4% paraformaldehyde for 20 minutes after washing with PBS at room temperature for protein expression using immunofluorescence. The cells were then permeabilized with PBS supplemented with 0.1% Triton X-100 and incubated at room temperature for 15 minutes, followed by washing of the cells 3 times with PBS supplemented with Tween 20 (PBST). Cells were blocked using 1% bovine serum albumin (BSA) supplemented with 0.1% Tween 20 for 30 minutes at room temperature to block the nonspecific binding of antibodies. After washing the cells three times with PBST, the cells were incubated with primary antibodies (mouse monoclonal antibodies to human collagen type 2 and aggrecan; GeneTex, Irvine, CA, USA) overnight at 4°C. After incubation, the cells were washed 3 times with cold PBST and incubated with secondary antibody (goat anti-mouse IgG (H&L)-FITC conjugated; GeneTex) for 2 hours at room temperature. The primary and secondary antibodies were diluted using a blocking solution (1% BSA in PBS and 0.1% Tween 20). The respective concentrations of the antibodies were as follows: collagen type 2 (10 µg/mL), aggrecan (5µg/mL) and goat anti-mouse IgG (H&L)-FITC (5 µg/mL). Cells incubated with secondary antibody without the primary antibody was used to assess the specificity of the antibodies. Finally, the cells were counterstained with DAPI (Nacalai Tesque, Japan) for 10 minutes and PBS was added to avoid dehydration of the cells. The images were then captured using a Zeiss fluorescence microscope (Axio Vert A10).
q-RTPCR
Collagen type 2 and aggrecan expression was performed to determine the chondrogenic phenotype of the isolated chondrocytes, whereas the expression of collagen type 1 was evaluated to monitor the possibility of chondrocytes dedifferentiation into fibroblast-like cells. At 80% confluence, primary and passaged (P1 and P3) chondrocytes were washed with PBS and trypsinized for RNA extraction. The trypsinized cells (1 × 10⁶) were centrifuged at 300g for 5 minutes at 4°C. The RNA was then extracted using FavorPrep total RNA mini kit (Favorogen Biotech, Taiwan) according to the manufacturer’s instructions. After RNA extraction, the concentration and purity of the total RNA was determined using spectrophotometer (Eppendorf BioSpectrometer kinetic).
A quantity of 100 ng of extracted RNA was used to synthesize cDNA with qPCRBIO cDNA synthesis kit (PCR Biosystems, London, UK) according to the manufacturer’s instructions. Briefly, 1 µL of 20× reverse transcriptase (RTase) and 3 to 5µL of total RNA were added to 4 µL of cDNA synthesis mix and made up to 20 µL final volumes with polymerase chain reaction (PCR) grade H2O. The mixture was then incubated at 42°C for 30 minutes and later incubated at 85°C for 10 minutes to denature RTAse. After cDNA was synthesized from RNA, 2 µL of template DNA (cDNA) and 0.8 µL each of forward and reverse primers (Integrated DNA Technologies, Singapore) was added to 10 µL of 2× qPCRBIO SyGreen Blue mix (PCR Biosystems) and made up to 20 µL final volume with PCR grade H2O. Data were collected and processed with sequence detection system software (BioRad CFX96 qPCR Detection System, Hercules, CA, USA) using 1 cycle at 95°C for 2 minutes to activate the polymerase, followed by 40 cycles at 95°C, 5 seconds for denaturation and 60°C, 30 seconds for annealing/extension. Primers for aggrecan (forward: TGAGGAGGGCTGGAACAAGTACC; reverse: GGAGGTGGTAATTGC AGGGAACA) and collagen type 1 (forward: CGGCTCCTGCTCCTCTTAG; reverse: CACACG TCTCGGTCATGGTA) were obtained from Naranda et al. 13 whereas that of collagen type 2 (forward: CCCTGAGTGGAAGAGTGGAG; reverse: GAGGCGTGAGGTCTTCTGTG) and GAPDH (forward: CAGAACATCATCCCTGCCTCT; reverse: GCTTGA CAAAGTGGTCGTTGAG) were sourced from Yoon et al. 18 and Chabane et al., 19 respectively.
The Ct values of the gene of interest were normalized to GAPDH. Finally, the gene expression level of passage 1 and 3 chondrocytes was normalized to primary chondrocyte and fold change was calculated using 2−∆∆Ct. Amplification efficiency of each primers was determined using a standard curve.
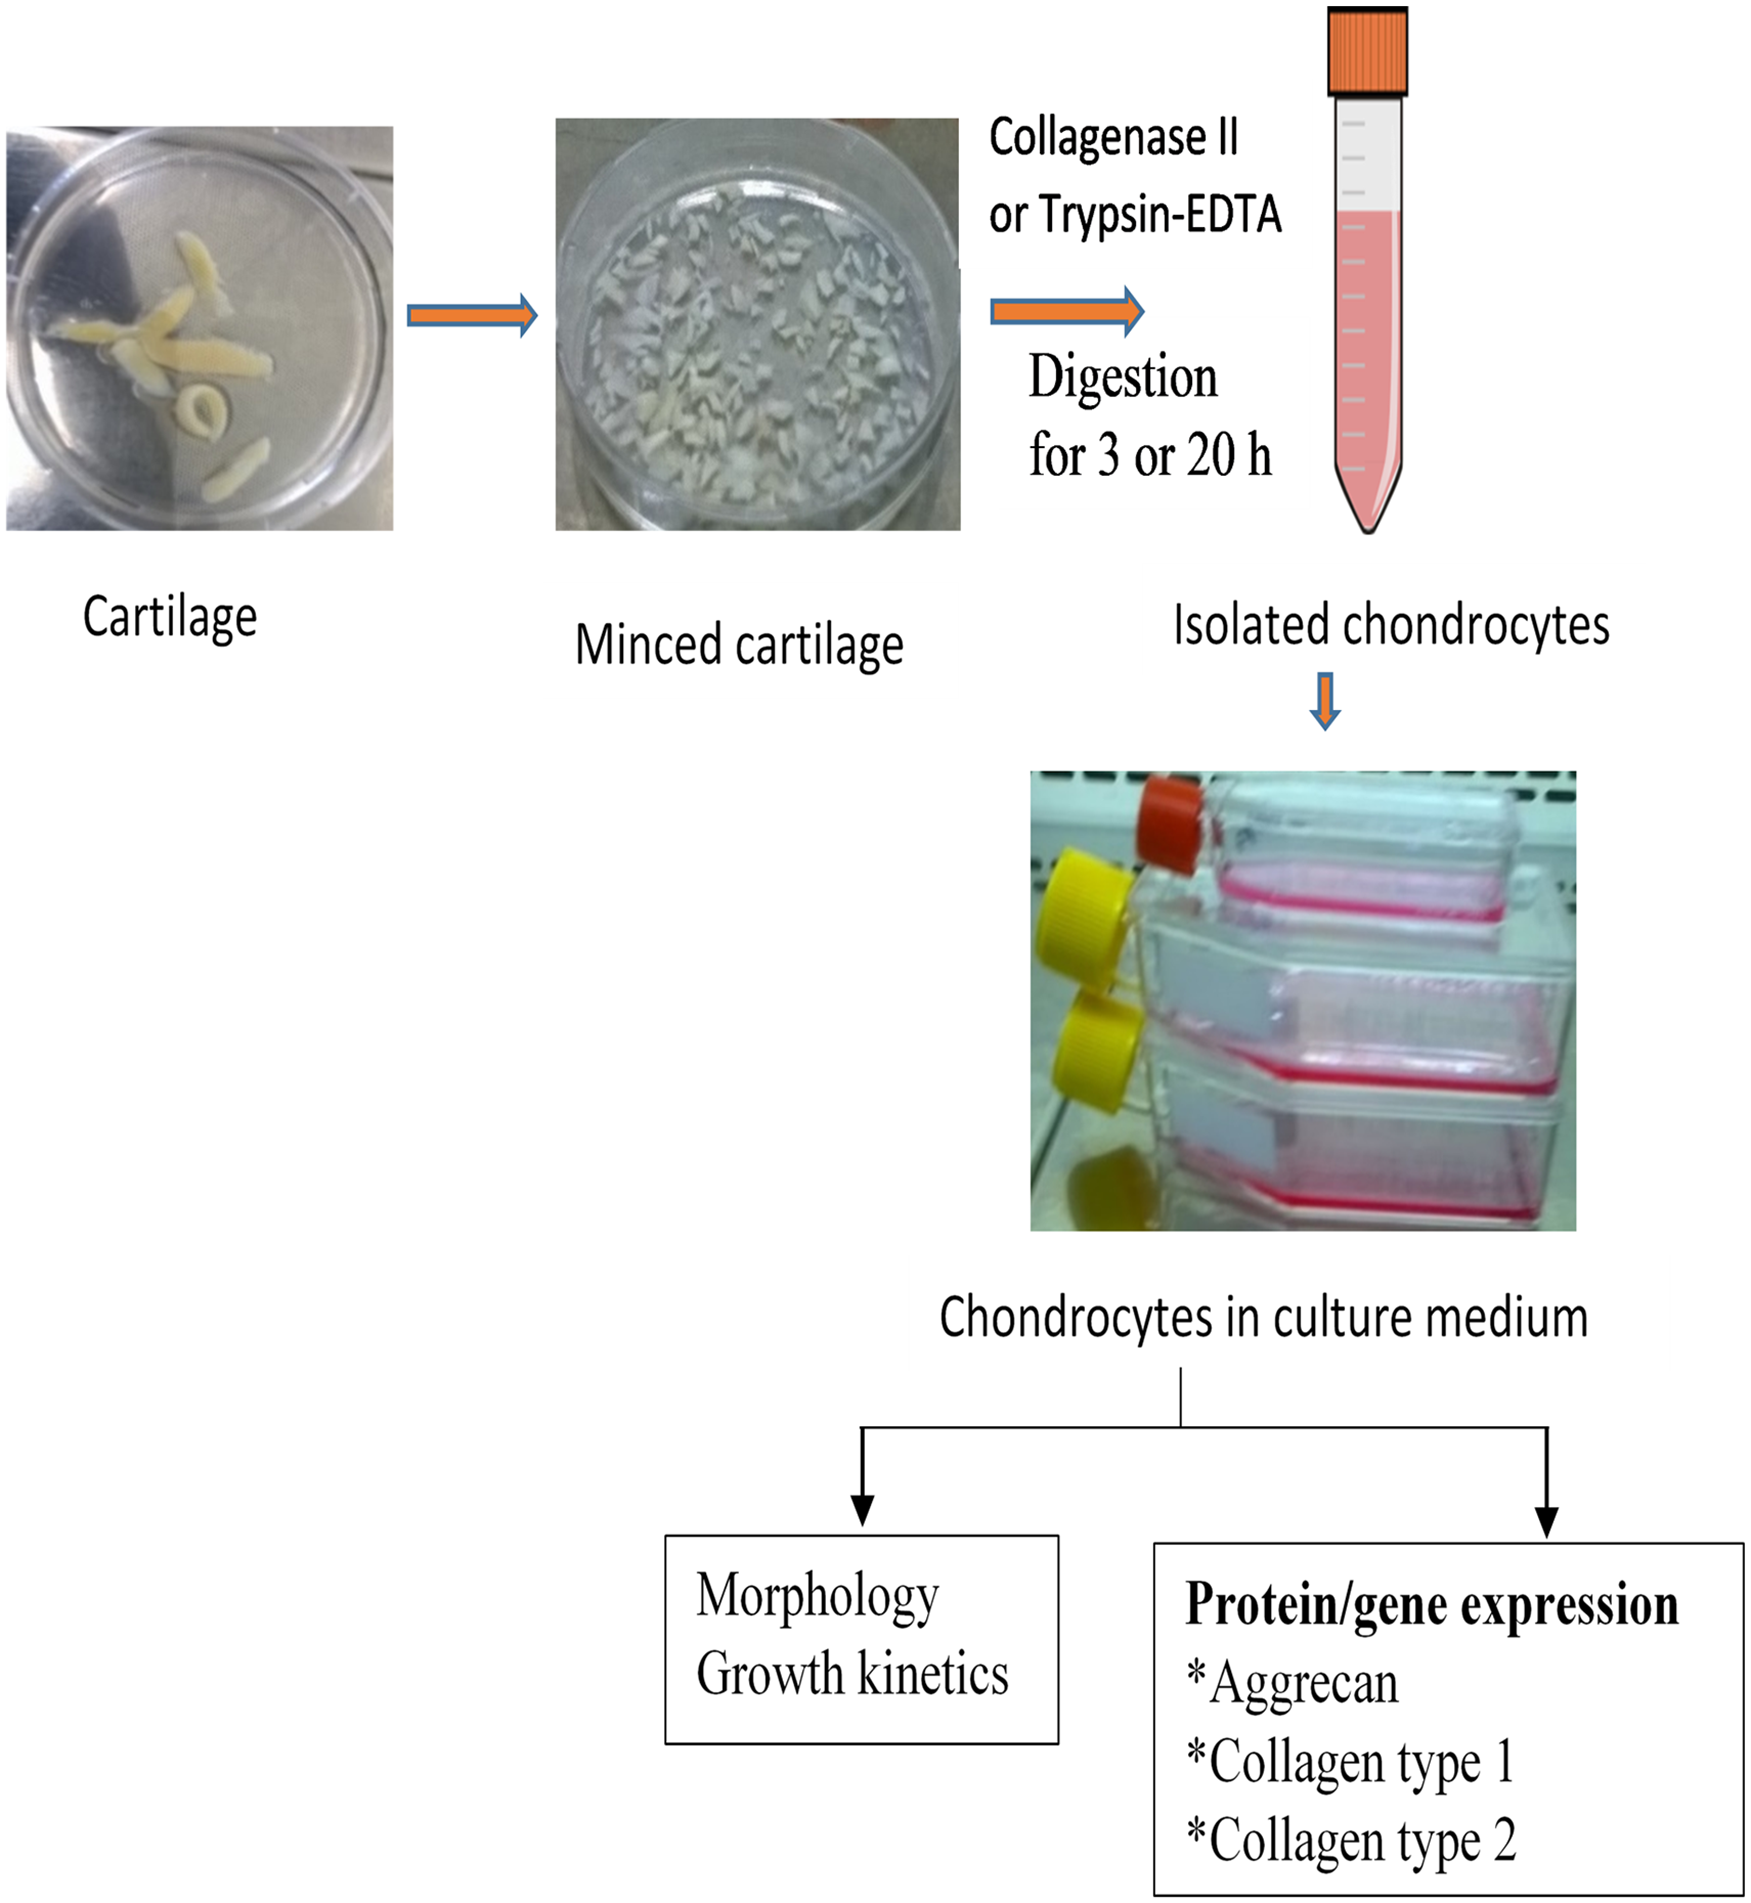
Experimental design.
Data Analysis
Data are mean ± standard deviation (SD) with n ≥ 3. Statistical Package for the Social Sciences (IBM SPSS, Armonk, NY, USA; version 20) was used for the data analysis. Data were tested for normality using Shapiro-Wilk test, whereas Levene’s test was used to test for the homogeneity of variance. Welch’s analysis of variance (ANOVA) was used to analyze the data with more than 2 variables, followed by Games-Howell post hoc test if a significant difference was observed because the data did not satisfy the ANOVA assumption of homogeneity of variance. Two variable data were analyzed using unpaired t test. A value of P < 0.05 was set as a significant level.
Results
Chondrocytes Yield after Digestion of Cartilage
Viable chondrocytes yield per wet gram of cartilage of different digestion method is presented in
Viable Chondrocytes Yield of Different Digestion Methods.*
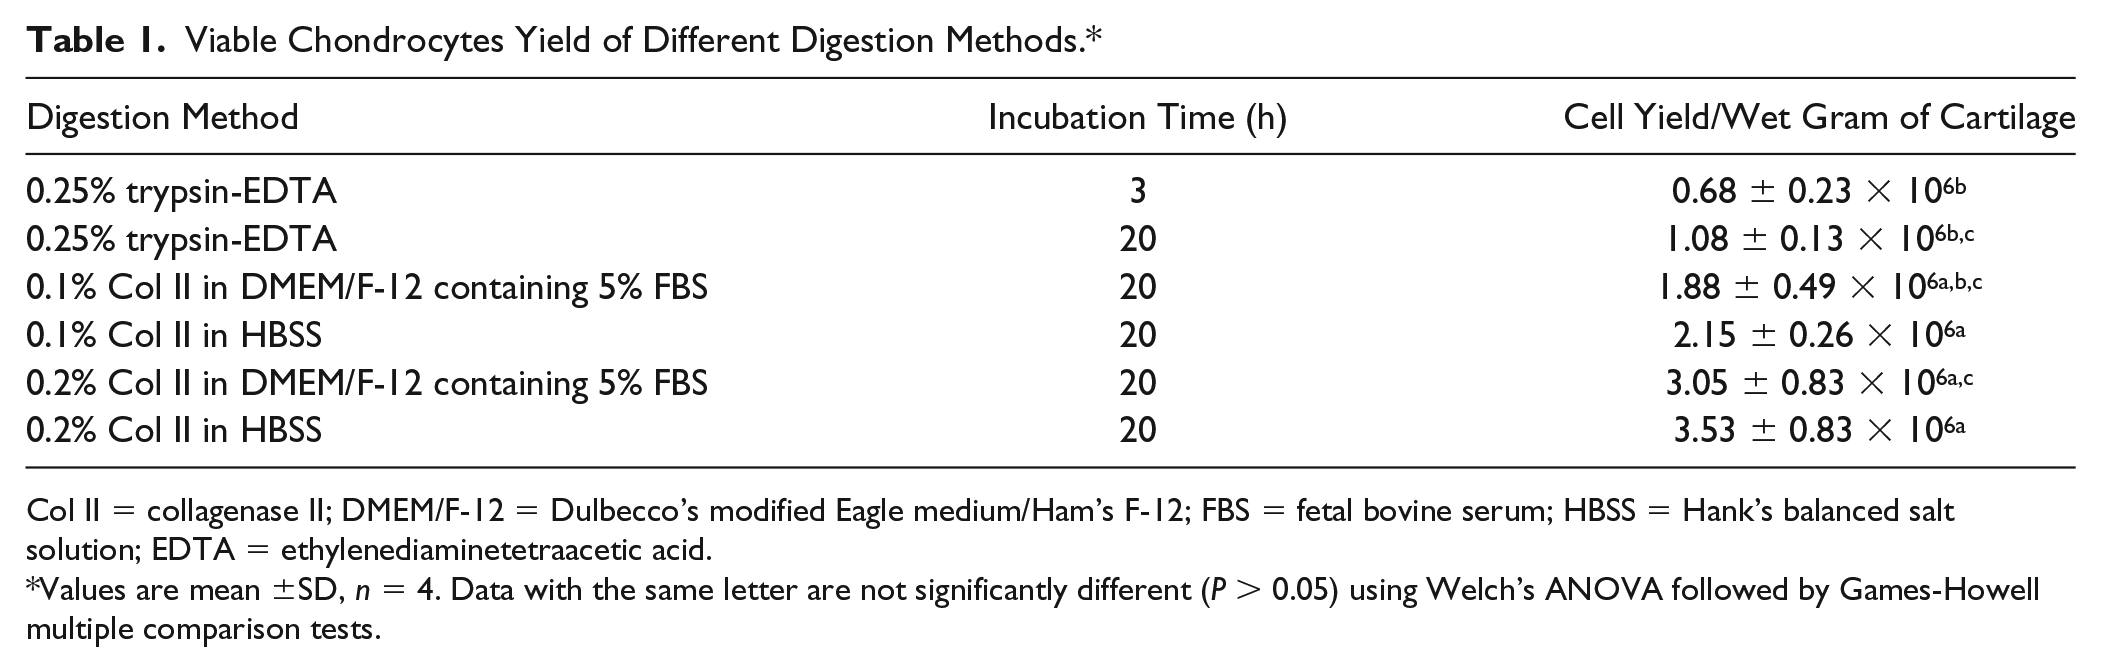
Col II = collagenase II; DMEM/F-12 = Dulbecco’s modified Eagle medium/Ham’s F-12; FBS = fetal bovine serum; HBSS = Hank’s balanced salt solution; EDTA = ethylenediaminetetraacetic acid.
Values are mean ±SD, n = 4. Data with the same letter are not significantly different (P > 0.05) using Welch’s ANOVA followed by Games-Howell multiple comparison tests.
Morphology of Primary Chondrocytes
The morphology of primary chondrocytes at day 3 and 6 (
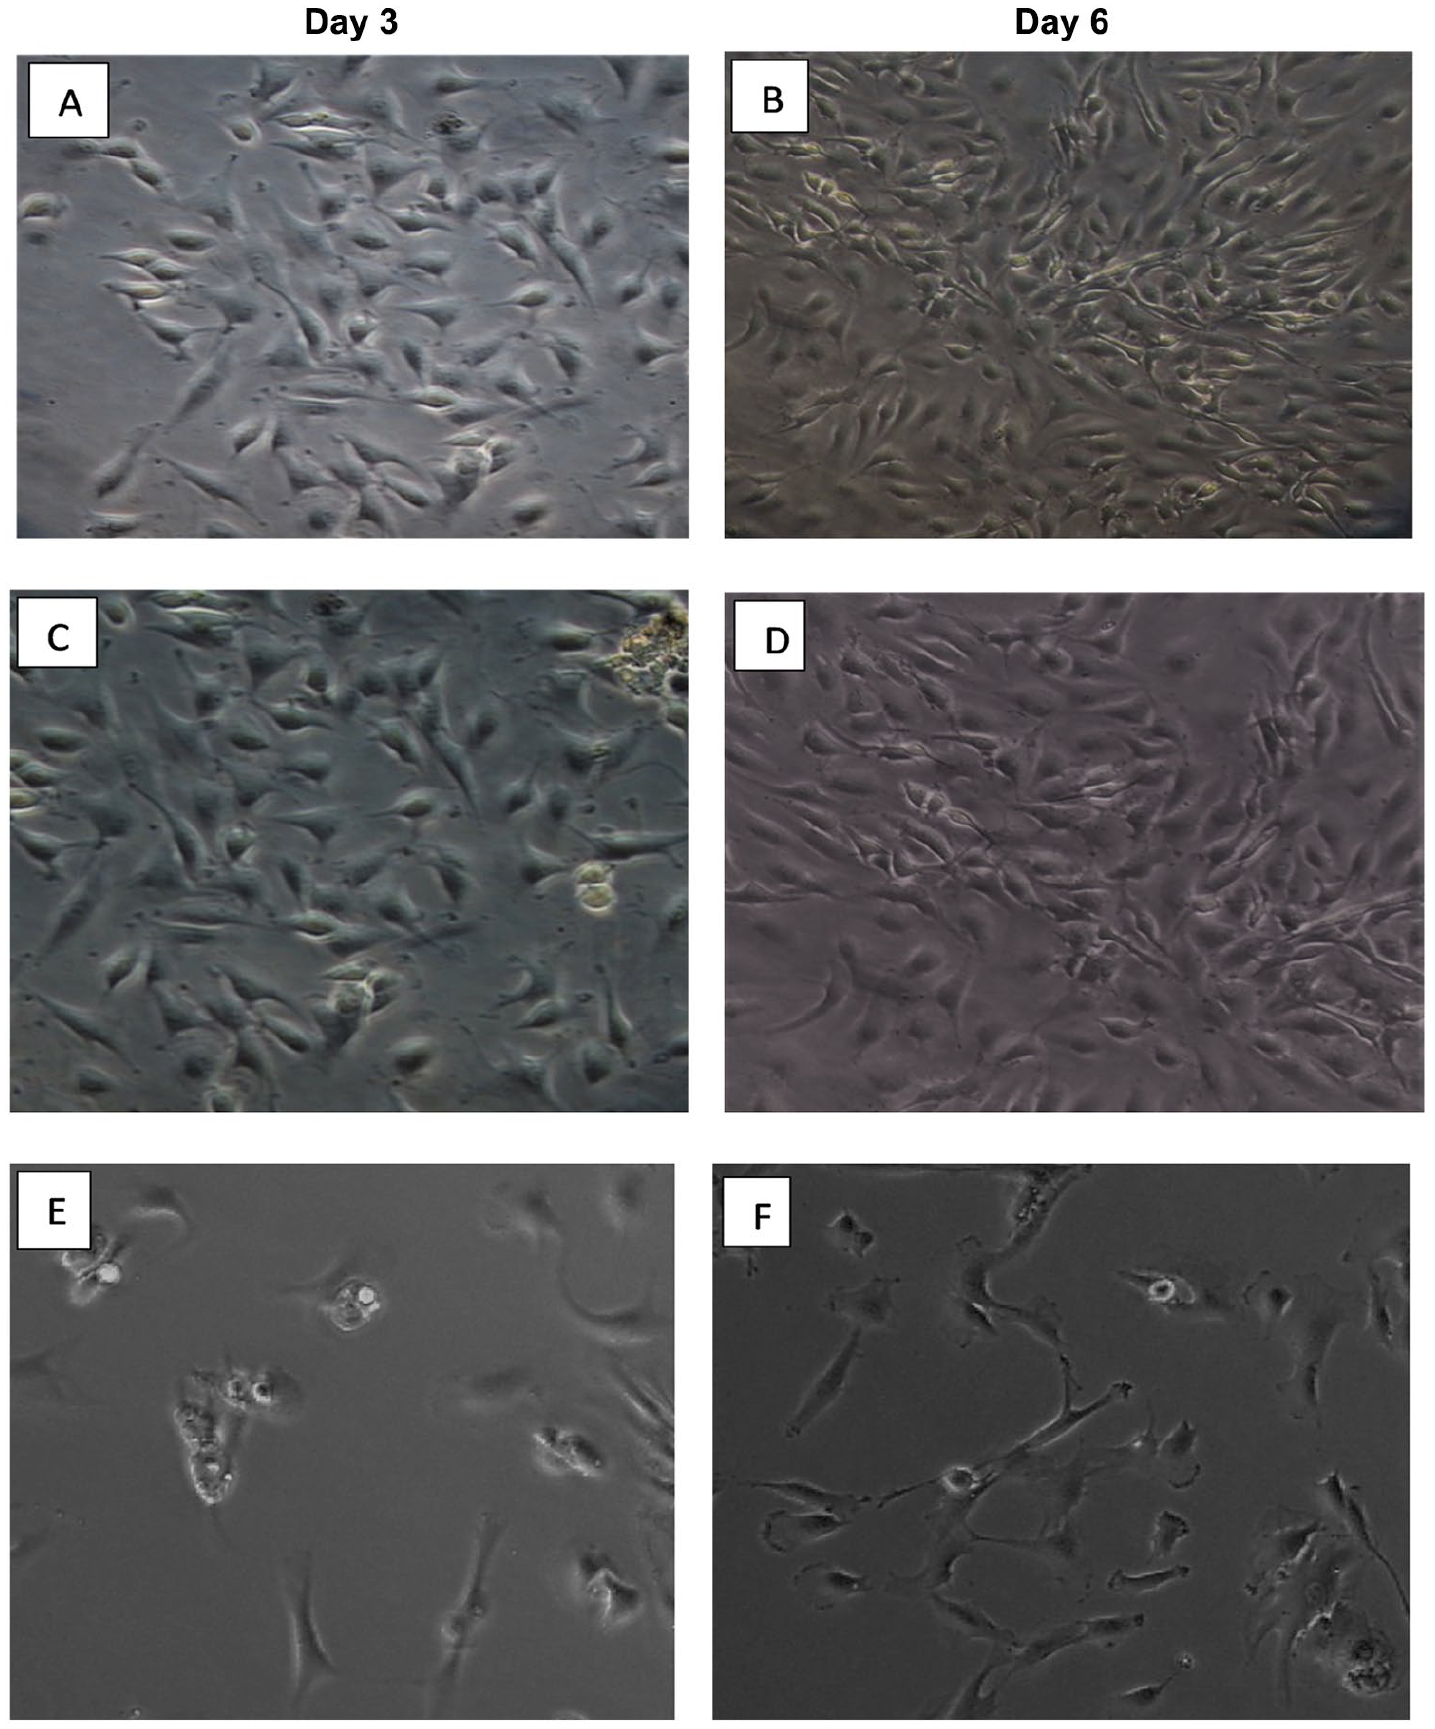
Morphology of primary chondrocytes isolated using different digestion methods. Morphology of chondrocytes isolated using different methods at days 3 and 6. (
The morphology of different passages (P1-P3) of chondrocytes isolated with 0.2% collagenase II in HBSS was examined and depicted in
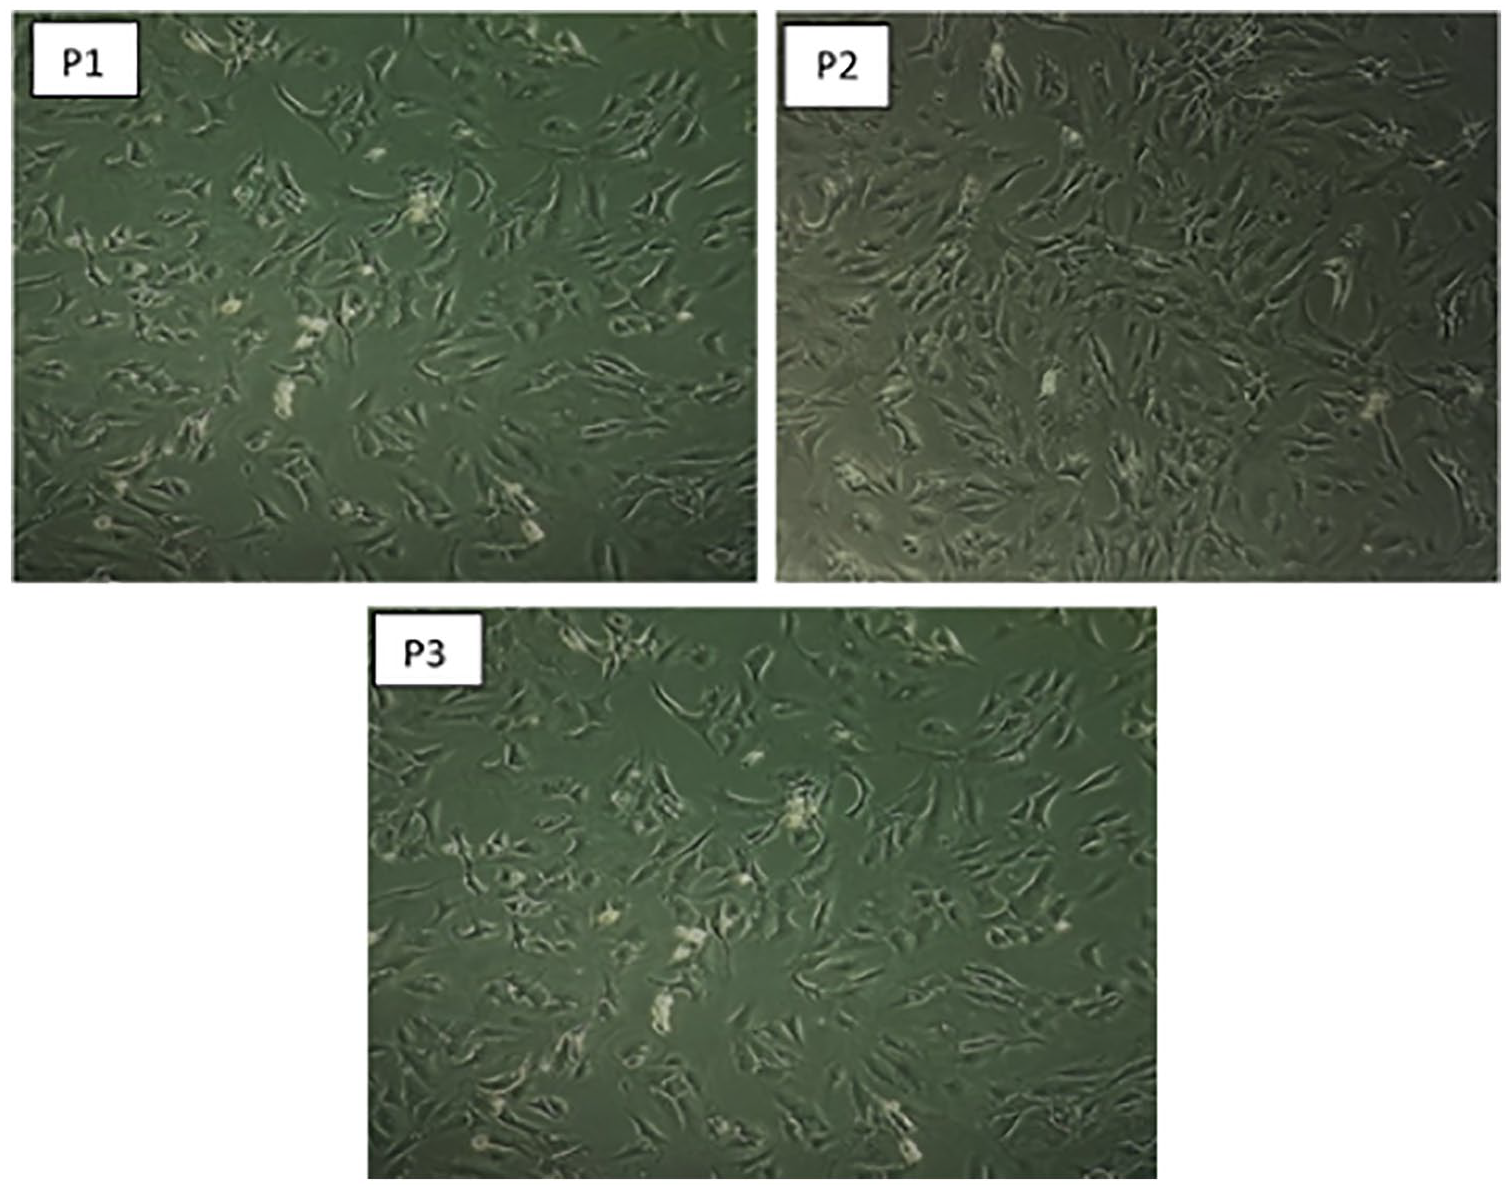
Morphology of different passage of chondrocytes isolated with collagenase II in HBSS. P1, P2, and P3 are passage 1, 2, and 3 chondrocytes, respectively, cultured in DMEM/F-12 supplemented with 10% FBS at confluence displaying round/polygonal shape. The initial seeding density was 10 × 103 cells/cm3. Magnification 100×. DMEM/F-12 = Dulbecco’s modified Eagle medium/Ham’s F-12; FBS = fetal bovine serum; HBSS = Hank’s balanced salt solution.
Alcian Blue Staining for Proteoglycan
Alcian blue staining was used to characterize the deposition of proteoglycan in the cells isolated with 0.2% collagenase II in HBSS. The results indicated a strong positive blue staining of isolated chondrocytes and cultivated in media supplemented with FBS (
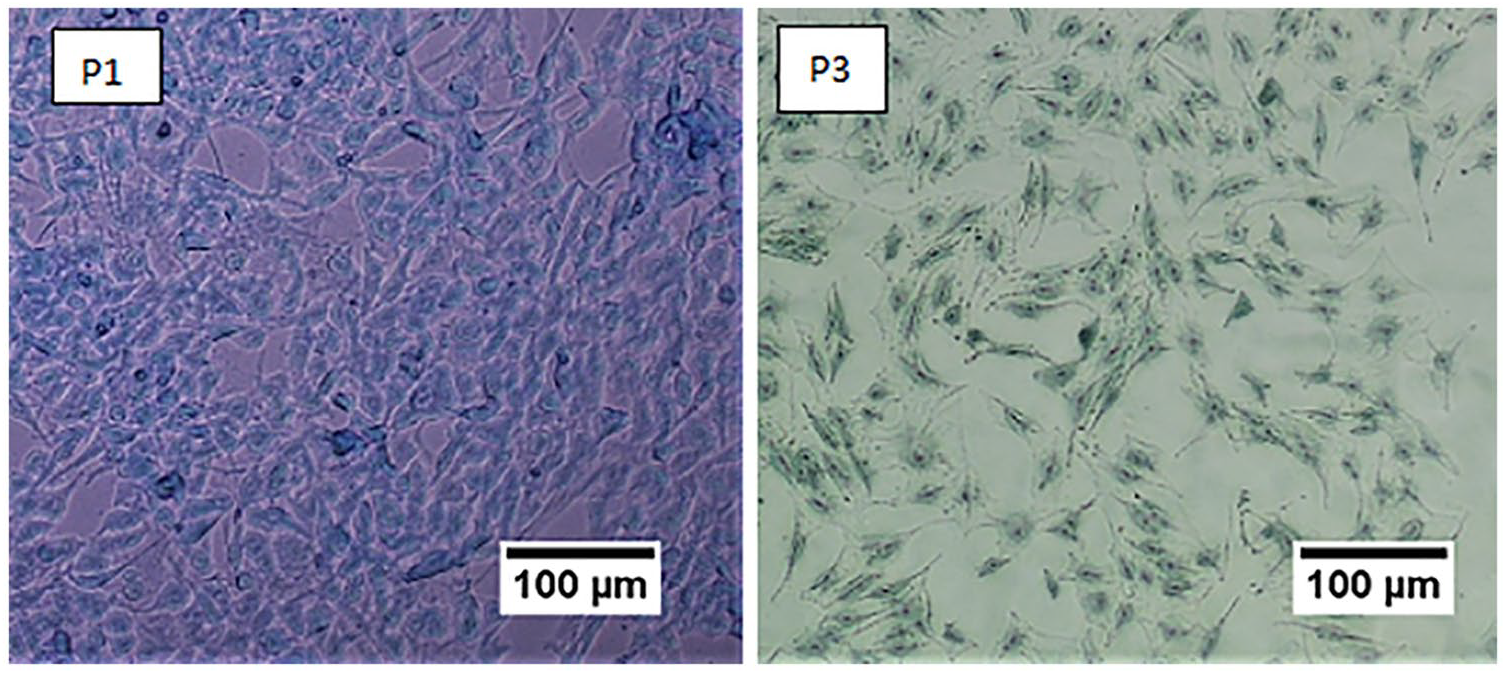
Chondrocytes stained with Alcian blue for proteoglycan. P1 and P3: passages 1 and 3 chondrocytes isolated using 0.2% collagenase II in HBSS and cultured in DMEM/F-12 supplemented with 10% FBS showing positive stain for proteoglycan. Scale bars: 100 µm. DMEM/F-12 = Dulbecco’s modified Eagle Medium/Ham’s F-12; FBS = fetal bovine serum; HBSS = Hank’s balanced salt solution.
Growth Kinetics of Chondrocytes
The growth kinetics of chondrocytes isolated with 0.2% collagenase II in HBSS was studied using different seeding densities and the growth rate of the cells was monitored for 7 days (
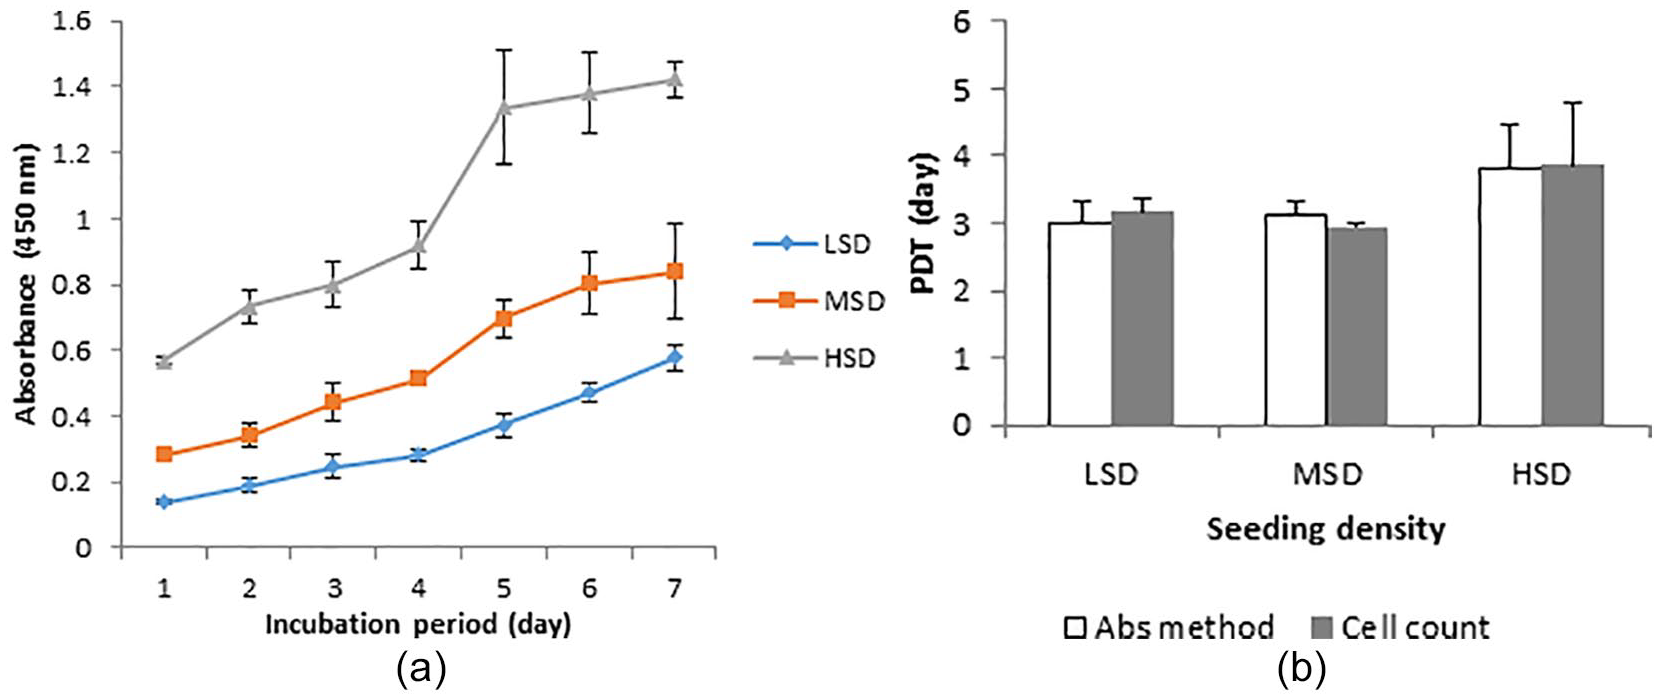
Growth kinetics of chondrocytes seeded at different densities. Values are mean ± SD, n = 3 for cell count or n = 4 for Abs method. Growth curve (
The results of growth rate for absorbance method are presented in
Growth Rate of Chondrocytes. a
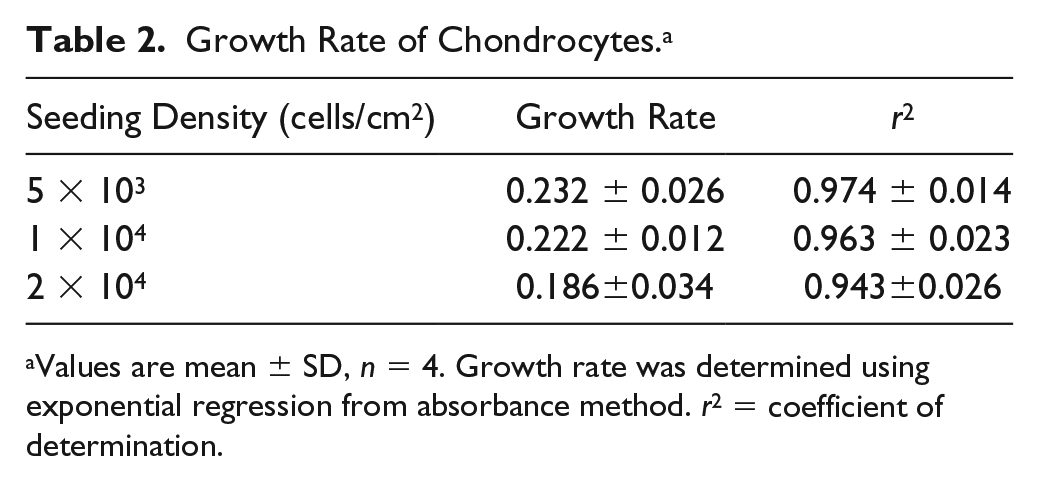
Values are mean ± SD, n = 4. Growth rate was determined using exponential regression from absorbance method. r2 = coefficient of determination.
Regression analysis showed a positive relationship between seeding density and PDT, suggesting lower seeding density had a shorter duration of PDT (
Regression Analysis Between Seeding Density and Population Doubling Time (PDT). a
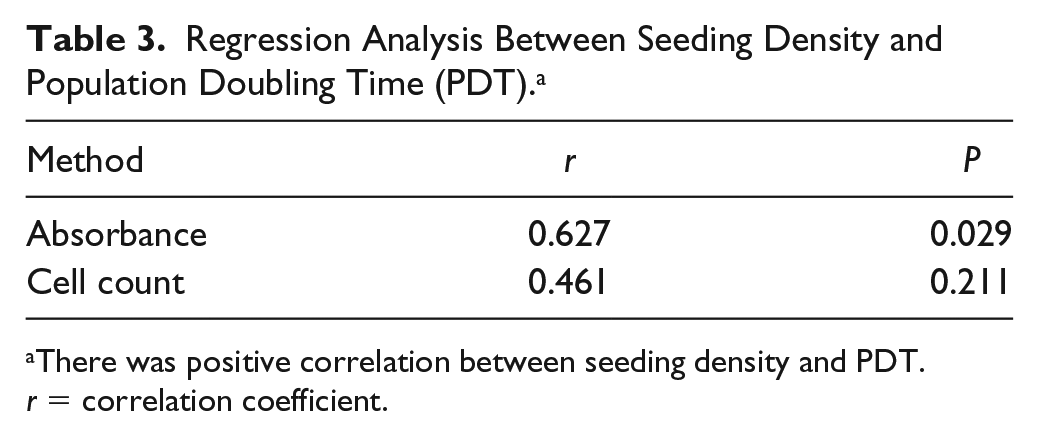
There was positive correlation between seeding density and PDT. r = correlation coefficient.
Protein Expression of Aggrecan and Collagen Type 2
The cartilage-specific phenotype was studied using immunofluorescence to observe newly formed collagen type 2 and aggrecan after cultivation of the freshly isolated chondrocytes. Immunocytochemical staining of the chondrocytes revealed high expression of aggrecan (
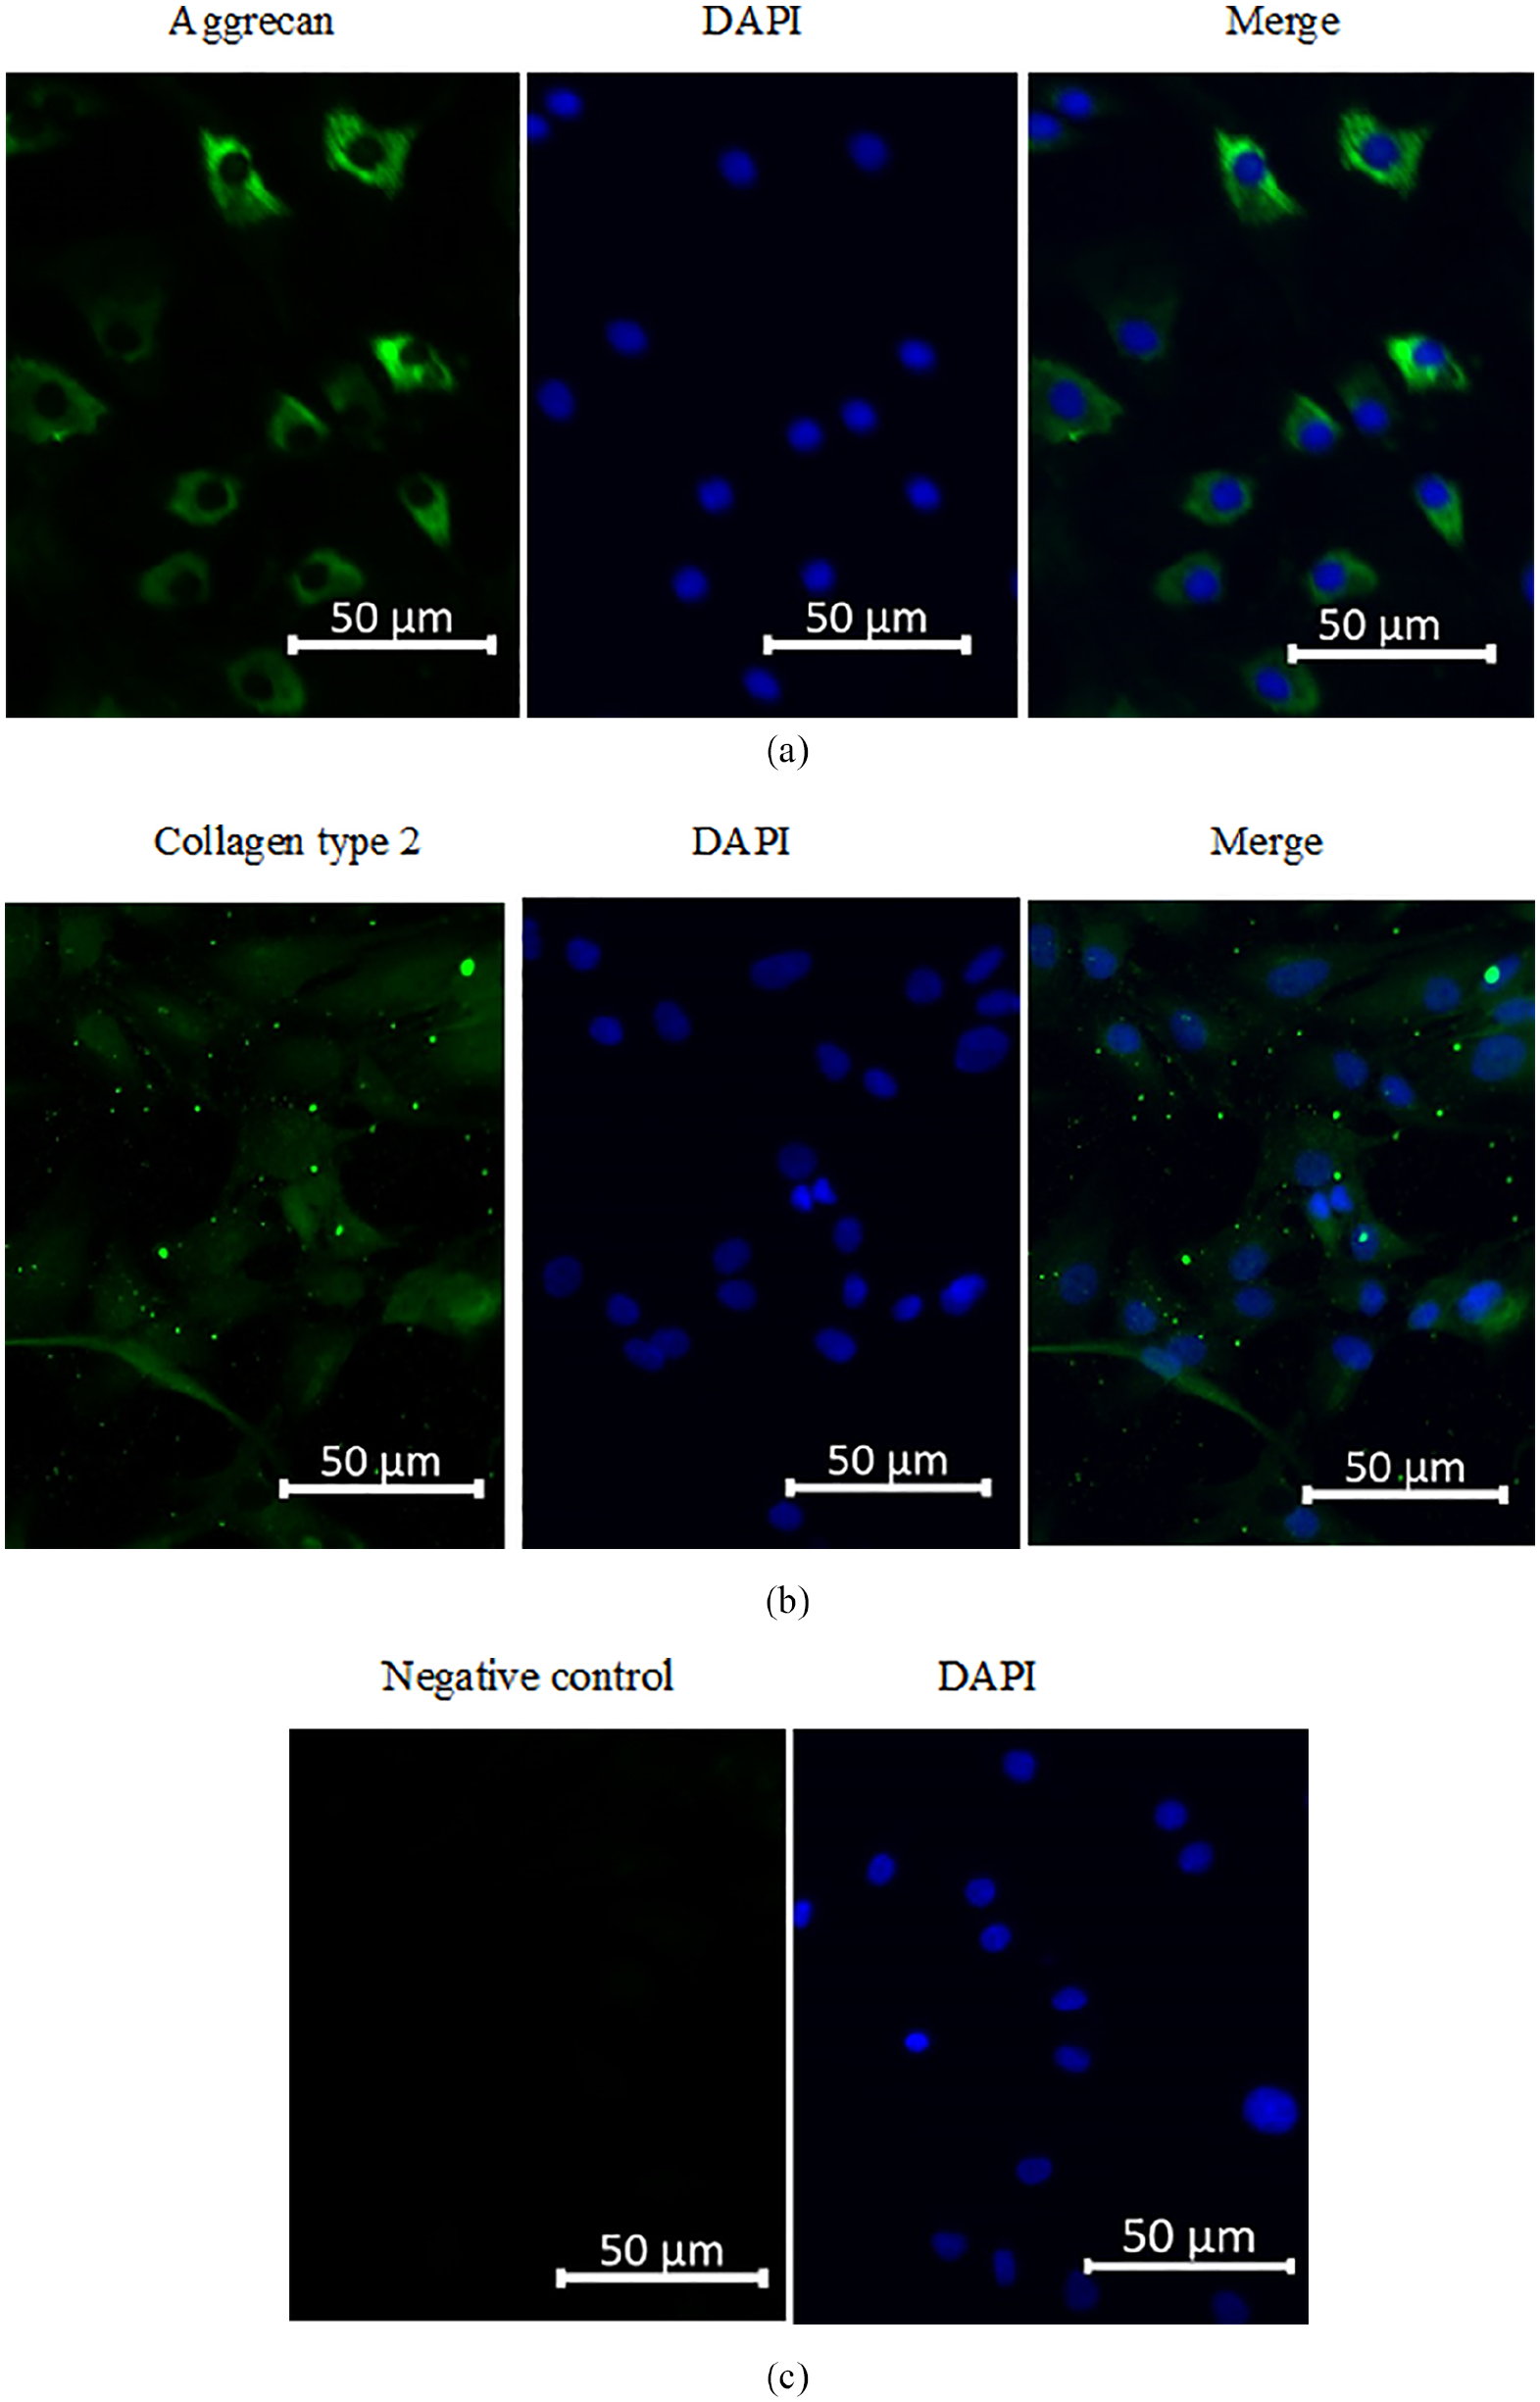
Expression of aggrecan and collagen type 2 by immunofluorescence. Expression of aggrecan (
Gene Expression of Cartilage-Specific Phenotype
The mRNA expression of collagen type 2 in primary and passaged chondrocytes is depicted in
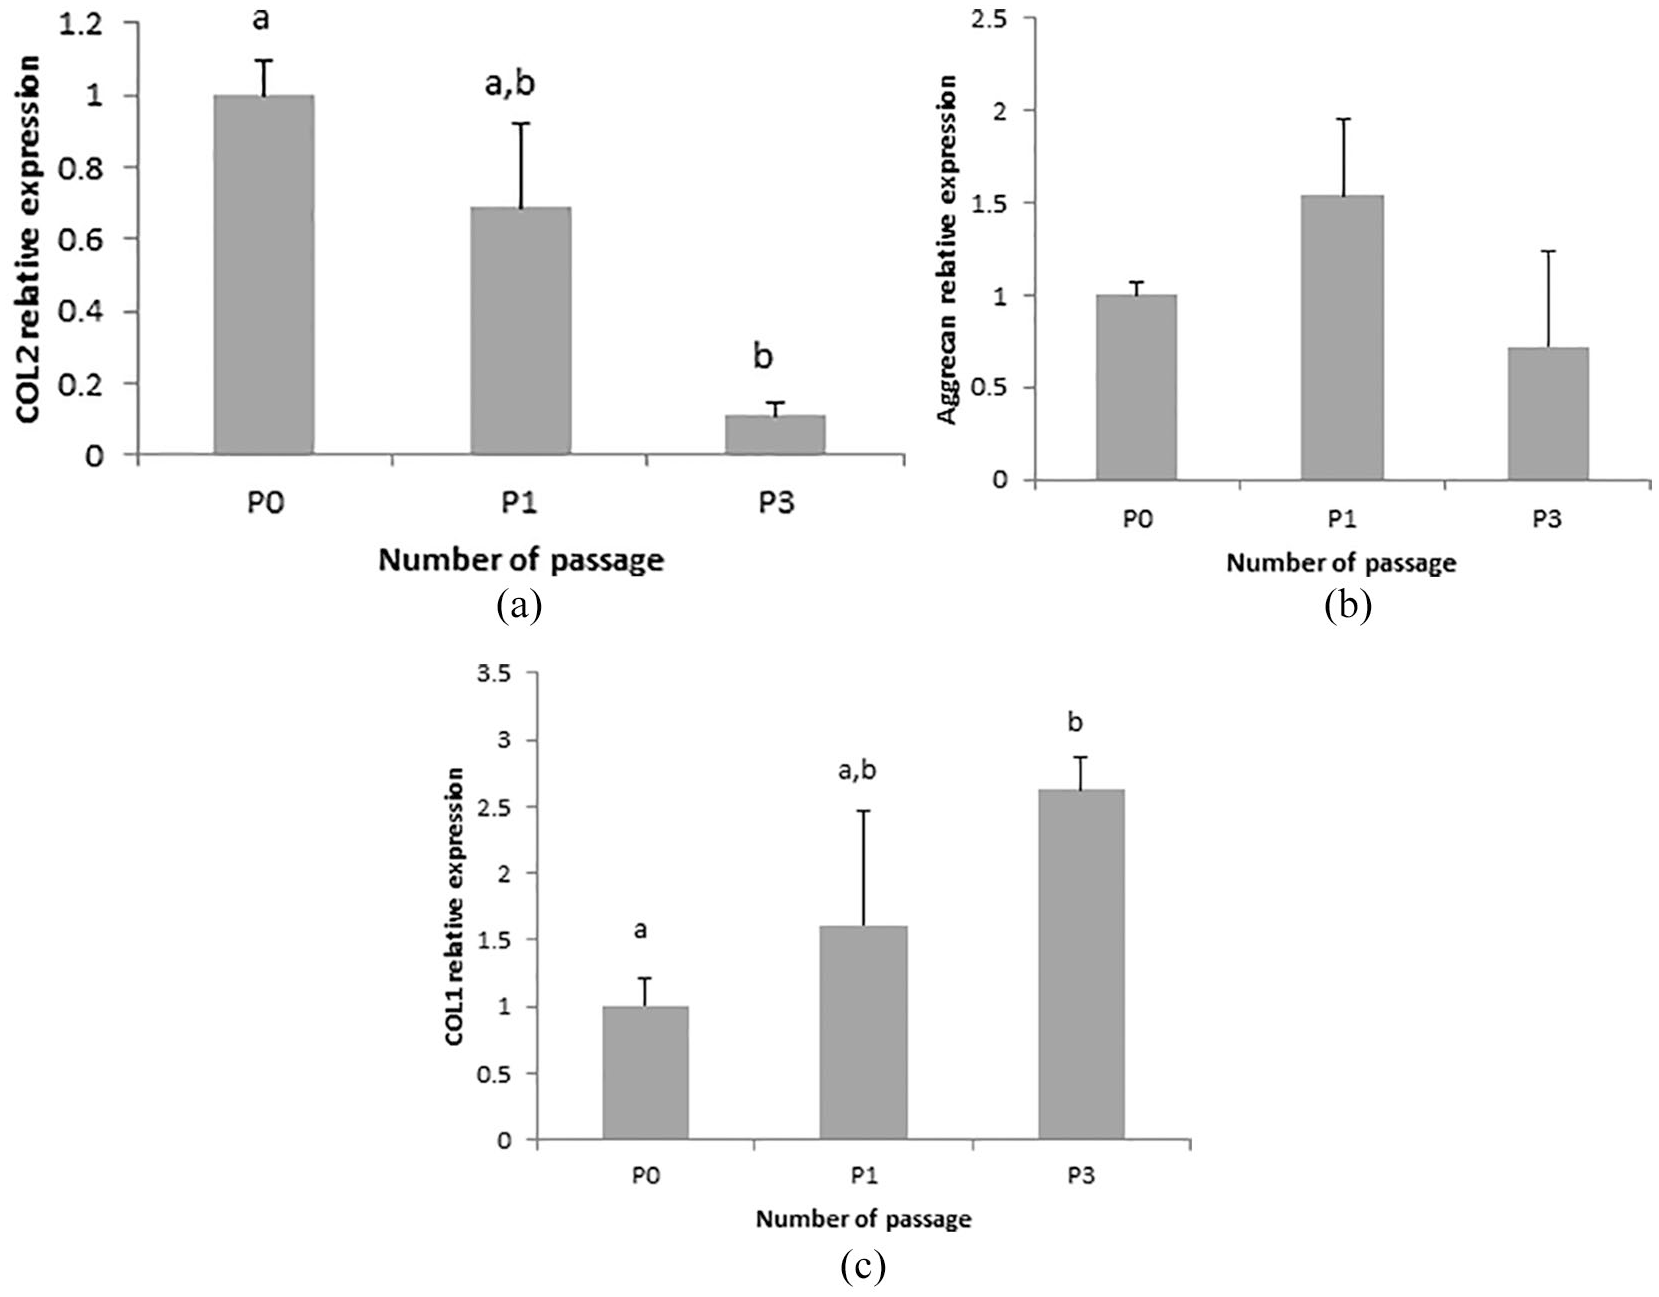
mRNA expression of chondrocyte phenotype. Data are mean ± SD, n = 3. COL2 mRNA expression (
Discussion
The isolation of chondrocytes from cartilage biopsies by enzymatic digestion is an important step to generate cell-based implants for cartilage repair. 20 Different methods for isolation of chondrocytes from cartilage have been established. Some of these methods utilized different concentrations of proteases and lengths of incubation. Cartilage tissue engineering is evolving rapidly as therapeutic strategies for cartilage defects that required chondrocytes for the engraftment of the construct into the defective area. 6 Cell-based therapy for cartilage defects required high cell numbers. Because of a limited number of cartilage and considering the low number of cell yield in the primary culture, 13 an optimized and validated protocol for isolation of chondrocytes would be a key step toward achieving cost-effective and efficient tissue engineering for cartilage repair. In this study, an optimized method for isolation of chondrocytes from human cartilage was established. To validate the method, the isolated chondrocytes were characterized for the expression of chondrocyte phenotype to ensure the quality of the cells. In addition, the effect of seeding densities on the growth kinetics of isolated chondrocytes were investigated.
The results indicated that chondrocytes yield per gram of cartilage was higher in collagenase II in HBSS. A number of studies have demonstrated the use of collagenase II in the isolation of chondrocytes1,20 with a varying number of chondrocytes yield. Similarly, several studies have reported the use of serum-free or serum-supplemented media as the medium for dissolving collagenase for cartilage digestion to isolate viable chondrocytes.1,14,21 For many years, the use of predigest phase with trypsin, pronase, or hyaluronidase as an initial step to loosen the tissue for effective breakdown of the fibrillar network by collagenase to release chondrocytes have been reported. The number of chondrocytes per gram of cartilage was significantly reduced in cartilage digested with trypsin. Naranda et al. 13 reported the use of trypsin as the simple and affordable procedure for the isolation of chondrocytes from cartilage. Collagenase II being a structural component of the joint cartilage could locally unwind the triple-helical collagen before it cleaves the Gly-Ile and Gly-Leu peptide bonds. 22 While trypsin acts by cutting the lysine or arginine amino acid residue on their c-termini unless these amino acids are followed by proline. 23 Digestion of cartilage with 0.2% weight per volume (550 U/mL) of collagenase II in HBSS produced the highest number of chondrocytes in this study. Vedicherla and Buckley 1 stated that much of the inconsistent report of protocol for chondrocytes isolation in the literature could be attributed to the discrepancy in the enzyme concentrations and enzyme solution to tissue mass ratio. Since there are variations for different lots of collagenase, it is therefore important for consistent reporting based on the unit of enzyme activity to ensure reproducible results.
The chondrocyte morphologic feature was round to polygonal in shape. As chondrocytes undergo successive passages, their morphology could change from round shape to spindle-like shape with increased expression of collagen type 1. 24 It has been shown in this study that chondrocytes seeded at higher density were able to maintain their round or polygonal shape up to 3 passages. In addition, chondrocyte attachment and growth were apparent in monolayer culture for the cells isolated with collagenase II at day 1 of cultivation, whereas cell attachment onto the flask in the case of trypsin was poor and could not yield a reasonable number of cells within limited time. In most cases, the cells isolated with trypsin failed to attain a confluence even after 2 weeks of cultivation in culture medium supplemented with serum. Furthermore, only a few numbers of cells adhered onto the flask from the primary cells isolated with trypsin. This suggests that trypsin interfered with the membrane adhesive proteins, such as cadherins and integrins. 25 In the cell membrane, these proteins provide anchors to link cytoskeleton with extracellular matrix (ECM) for the regulation of cell migration and adhesion. 25 EDTA, which was used along with trypsin, is a chelator of divalent ions and its presence could perturb magnesium and calcium-dependent membrane proteins such as integrins and cadherins for stable interaction with their ligands. 26 Similarly, Delon and Brown 27 demonstrated that integrins link the cytoskeleton to ECM ligands, which provide a robust attachment to allow cell-shape adjustment and tissue integrity. Taken together, the result of this study did not support the use of trypsin-EDTA as an efficient method for the isolation of chondrocytes as reported by Naranda et al. 13 The method seems not cost-effective due to the fact that the time and culture media required to yield a sufficient number of chondrocytes are not comparable to the use of collagenase II.
The growth curve of chondrocytes seeded at higher densities depicted 3 different phases. It started with an initial lag phase, which was followed by exponential growth and lastly the stationary phase. This pattern of the growth curve is in line with the general behavior of cells. Chondrocytes seeded at a lower density displayed a slow continuously growth pattern, indicating a longer time is required for the cells to reach a stationary phase. Therefore, chondrocytes seeded at low densities may be appropriate for the assays that can be performed over a long period of time. However, it is important to note that chondrocytes seeded at low densities are more likely to undergo dedifferentiation. In the present study, shorter PDT was observed in the chondrocytes seeded at lower densities. Baghaban et al. 28 demonstrated similar PDT for rat chondrocytes. Similarly, PDT comparable or higher than the one observed in this study for human nasal chondrocytes 29 and human articular chondrocytes 30 have been reported. The reason for these inconsistencies between studies may be attributed to different culture conditions, the source of cartilage, or nature of chondrocytes (primary vs. passaged). Chondrocytes in a monolayer culture can undergo rapid proliferation with increase passaging as a result of dedifferentiation.21,30
Characterization of chondrocyte phenotype at the protein and gene levels showed the expression of collagen type 2 and aggrecan. These 2 matrix proteins are the predominant proteins in the extracellular matrix of cartilage and they are important in maintaining ECM homeostasis. To further confirm the possibility of chondrocytes dedifferentiation in a monolayer, Alcian blue staining for the expression of proteoglycan and gene expression for collagen type 2 and aggrecan until passage 3 were investigated. The results demonstrated the expression of proteoglycan, indicating the cells retained their chondrocyte phenotype even at P3. Furthermore, gene expression of collagen type 2 decreases with passaging, whereas a fluctuating level of aggrecan expression was observed. This pattern of expression of these matrix proteins observed corroborated the findings of Zwickl et al. 31 They observed a progressive decrease in collagen type 2 expression but a fluctuating aggrecan expression with the increasing number of passages. Contrary to this observation, the expression of both matrix proteins has been shown to be inversely correlated with number of passages. 32 However, the decrease in collagen type 2 gene expression in this present study was not significantly different between primary and passage 1 chondrocytes. A comparison between chondrocytes isolated from normal and osteoarthritic joints showed no apparent differences in the synthesis of collagen type 2. 33 The increased expression of collagen type 1 is related to a shift in the morphology of chondrocyte phenotype toward a fibroblast one. To further confirm this, gene expression level of collagen type 1 was examined. There was no significant change in the expression of collagen type 1 between primary and passage 1 chondrocytes. This shows that the chondrogenic potential of P1 chondrocytes was not significantly altered in this study.
Conclusion
The present study provides an insight into the protocol for the isolation of chondrocytes from articular cartilage. Isolation of chondrocytes with collagenase II in HBSS has shown to produce a significant number of cells that retained chondrocyte phenotype. This protocol can be employed to generate a large number of chondrocytes for tissue engineering to repair cartilage defect or treat osteoarthritis. In addition, the data presented here did not support the use of trypsin-EDTA for efficient chondrocyte isolation. The data also suggest that passaged chondrocytes displayed more fibroblast phenotype and as such low passage chondrocytes should be employed for studies that may involve the repair of cartilage or in vitro models of osteoarthritis.
Footnotes
Acknowledgments and Funding
The author(s) disclosed receipt of the following financial support for the research, authorship, and/or publication of this article: This work was supported by Putra Grant, Universiti Putra Malaysia with grant number: GP-IPS/9578600 and GPB/9657800.
Declaration of Conflicting Interests
The author(s) declared no potential conflicts of interest with respect to the research, authorship, and/or publication of this article.
Ethical Approval
The protocol was approved by the Medical Research and Ethics Committee, Ministry of Health, Malaysia with reference number KKM.NIHSEC/P17-1554 (5).
Informed Consent
Written informed consent was obtained from all patients before the study.
Trial Registration
Not applicable.