
Abstract
Objective
The outcome of arthroscopic treatment for femoroacetabular impingement (FAI) depends on the preoperative status of the hip cartilage. Quantitative T2 can detect early biochemical cartilage changes, but its routine implementation is challenging. Furthermore, intrinsic T2 variability between patients makes it difficult to define a threshold to identify cartilage lesions. To address this, we propose a normalized T2-index as a new method to evaluate cartilage in FAI.
Design
We retrospectively analyzed magnetic resonance imaging (MRI) data of 18 FAI patients with arthroscopically confirmed cartilage defects. Cartilage T2 maps were reconstructed from multi-spin-echo 3-T data using the echo-modulation-curve (EMC) model-based technique. The central femoral cartilage, assumed healthy in early-stage FAI, was used as the normalization reference to define a T2-index. We investigated the ability of the T2-index to detect surgically confirmed cartilage lesions.
Results
The average T2-index was 1.14 ± 0.1 and 1.13 ± 0.1 for 2 separated segmentations. Using T2-index >1 as the threshold for damaged cartilage, accuracy was 88% and 100% for the 2 segmentations. We found moderate intraobserver repeatability, although separate segmentations yielded comparable accuracy. Damaged cartilage could not be identified using nonnormalized average T2 values.
Conclusions
This preliminary study confirms the importance of normalizing T2 values to account for interpatient variability and suggests that the T2-index is a promising biomarker for the detection of cartilage lesions in FAI. Future work is needed to confirm that combining T2-index with morphologic MRI and other quantitative biomarkers could improve cartilage assessment in FAI.
Introduction
Femoroacetabular impingement (FAI) is a disorder of the hip joint in which bony abnormalities cause repetitive contact between the acetabular rim and the proximal femur, which eventually leads to damage of the articular cartilage and labrum.1,2 Early diagnosis is critical to the success of joint-preserving surgeries, which can prevent further cartilage degeneration and reduce the risk of developing hip osteoarthritis (OA).3-5 Magnetic resonance imaging (MRI) and MR arthrography have limited accuracy in detecting morphologic changes in cartilage6,7 and are not sensitive to damage at a biochemical level, which may be present despite normal cartilage appearance. Quantitative MRI parameters, such as dGEMRIC (delayed gadolinium-enhanced MRI of cartilage),8-10
While T2, which is a biomarker for changes in cartilage hydration and collagen architecture, has been employed for hip cartilage evaluation,18-20 it has not yet been adopted in clinical protocols. The main reason is that T2-mapping techniques that are rapid enough for clinical use typically have other limitations. For example, techniques based on fitting multi-spin-echo (MSE) data to an exponential model are hampered by stimulated and indirect echoes, which cause the signal evolution to deviate significantly from the assumed theoretical T2 exponential decay. Various approaches have been proposed to improve the estimation of T2. Some methods rely on the extended phase graph formalism 21 to trace the coherence pathways of all stimulated echoes in MSE protocols22,23 and incorporate them into numerical optimization algorithms. 24 Other methods employ a short TR (repetition time) single spin-echo (SE) pulse sequence to avoid stimulated and indirect echoes altogether, 25 or extract T2 values from non-SE-based protocols that trade off T2 encoding quality for a simpler signal model.26,27 More recently, MR fingerprinting has been proposed for rapid extraction of multiple tissue parameters, including T2, based on matching voxel-by-voxel the signal evolution along a series of highly undersampled images to a precalculated dictionary. 28 In this work, we employed the echo-modulation-curve (EMC) algorithm, 29 which is also a model-based technique and quantifies T2 by matching experimental MSE data to a precalculated dictionary of signal decay curves. The EMC dictionary is created by meticulously tracing all the coherence pathways of an MSE protocol using Bloch simulations, enabling the extraction of accurate and reproducible T2 values.
Another reason that has prevented quantitative T2 to be adopted in routine cartilage imaging protocols is that it is still unclear how to best interpret T2 values in order to affect clinical decisions. In fact, while model-based T2-mapping techniques can provide reliable parameter estimation,29,30 it remains difficult to define a suitable threshold to identify cartilage damage, due to intrinsic variability in T2 between patients. The first aim of this work was to address such variability by introducing a normalized T2-index for the assessment of articular cartilage in FAI. The second aim was to perform a preliminary validation of the diagnostic utility of the T2-index using arthroscopically confirmed cartilage lesions as the reference.
Patients and Methods
Study Population
This study was approved by the local ethics committee. We retrospectively reviewed MRI data of 85 hips in 79 patients (age 32.3 ± 15.2 years) who were referred for MR arthrography after complaining of hip pain. The MRI data were consecutively acquired between May 2009 and October 2014 with a protocol that included a T2 map of the hip cartilage. We excluded patients with hip dysplasia and unusable T2 maps due to imaging artifacts. We included only patients (n = 21) who underwent hip arthroscopic surgery at our institution after being diagnosed with symptomatic FAI based on clinical examination and morphologic MRI findings. Of those, we included only patients who were injected intravenously with a gadolinium-based contrast agent for indirect MR arthrography. As a result, the study population consisted of 18 hips in 18 patients (7 males, 11 females) of age 37.9 ± 12.5 years.
MRI Acquisitions
Patients were injected intravenously with gadopentetate dimeglumine (Gd-DTPA2−, Magnevist, Bayer Healthcare) for indirect MR arthrography, following a screening for risk of nephrogenic systemic fibrosis that was conducted using a questionnaire before the MRI exam. Scans were performed on a 3-T whole-body MR system (Siemens Healthineers, Erlangen, Germany). The combination of a spine coil array and a flexible many-elements torso coil array, wrapped around the hip of interest, was used for MR signal acquisition. T2-mapping was performed using a product MSE pulse-sequence (0.59 × 0.53 mm2 in-plane resolution, 4 mm slice thickness, TR = 4000 ms, echo spacing = 11 ms, echo train length = 8, acquisition bandwidth = 454 Hz/pixel). Because of scan time limitations, the MSE data were acquired only for one radial section of the hip, 31 cutting through the anterior-superior cartilage region 32 ( Fig. 1 ), where cartilage lesions are common in FAI. 1 In particular, axial oblique and coronal localizer images were obtained, and the plane of section was adjusted so that it went through the edge of the acetabular rim on both localizer images ( Fig. 1a and b ). The resultant clock face image ( Fig. 1c ), which was obtained in the plane of the acetabular opening, served as the localizer image on which the radial section was prescribed. Figure 1d and e shows the location of the anterior-superior radial section used for T2-mapping, which corresponds to 1:30 clock position in the clock-face centered anatomic reference.31,32
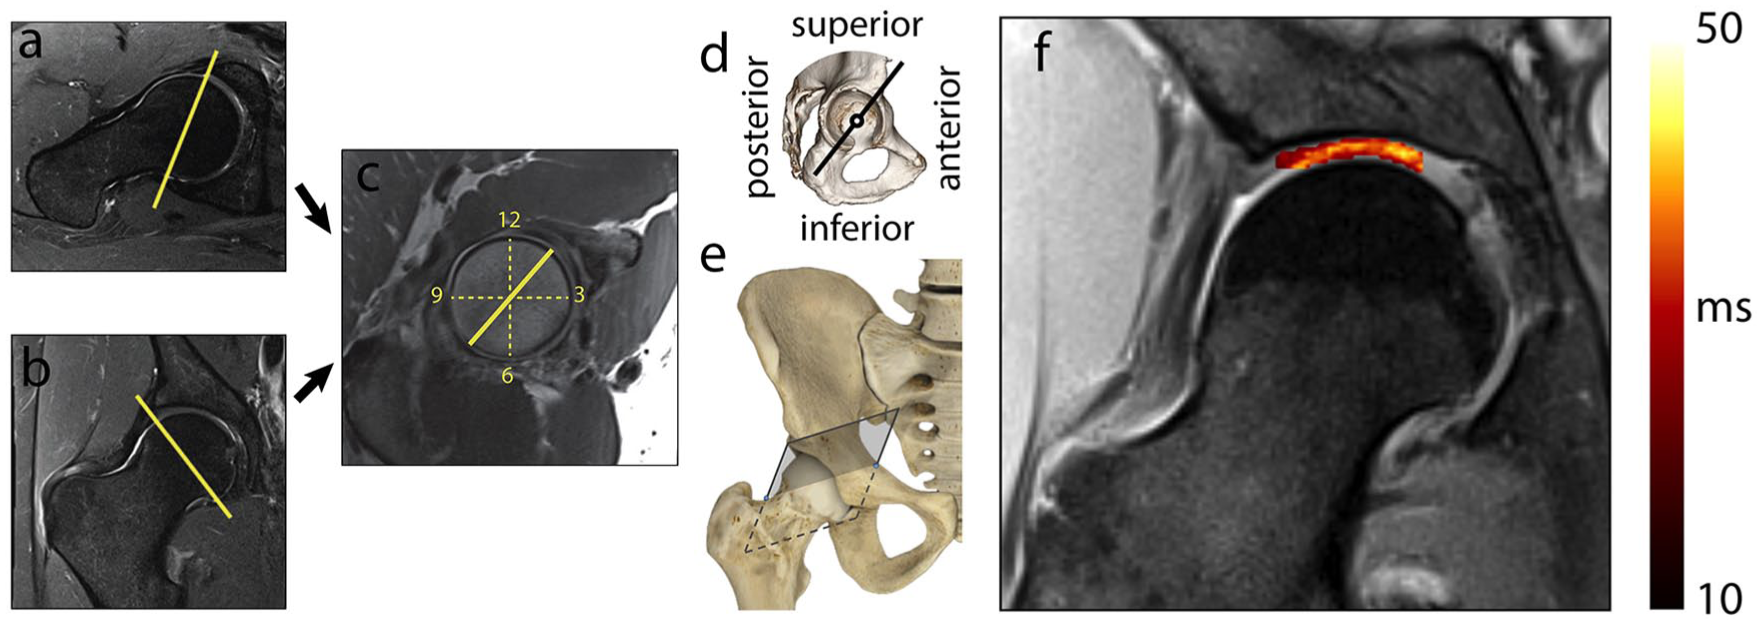
Slice orientation used for T2-mapping. A clock face image (
Arthroscopic Findings
All patients underwent hip arthroscopy at our institution after being diagnosed with symptomatic FAI based on clinical examination and radiologic findings. None of these patients had hip dysplasia. Surgeries were performed by orthopedic surgeons having 3 to 20 years of clinical experience and 3 to 5 years of hip arthroscopic experience. Procedures consisted of routine hip arthroscopy of the central and peripheral compartments using the anterior-lateral, posterior-lateral, anterior, and modified anterior portals with the patient in supine position. All acetabular cartilage surfaces were probed and evaluated for any signs of damage. All full-thickness chondral delamination lesions were resected back to determine the extent of the damage. Acetabular cartilage defects were identified in all patients and documented in the surgical report according to their location. Chondral delamination was reported for 15 cases out of the 18 included in this study. Of the remaining three hips, in one case an Outerbridge grade II acetabular cartilage defect in the absence of delamination was reported, whereas for 2 cases the presence or absence of delamination was not explicitly mentioned and Outerbridge grade II and III cartilage defects in acetabulum were reported.
Generation of T2 Maps
T2 maps were generated using the EMC algorithm, 29 which was programmed in-house using Matlab (The MathWorks Inc., Natick, MA), with some functions written in C++. 33 In particular, a dictionary was computed by repeating Bloch simulations of the prospective MSE protocol for a range of T2 relaxation values and transmit-field (B1+) inhomogeneity levels (T2 = 1 . . . 1000 ms, B1+ = 50% . . . 130%). This produced a database of signal decay curves, each associated with a unique (B1+, T2) value pair. The experimental MSE signal decay curve at each voxel was then matched to a simulated curve in the dictionary, yielding a unique T2 value. Proton density (PD) maps were subsequently calculated by extrapolating the image from the first echo time back to time t = 0 seconds, based on the estimated T2 values and the fact that purely exponential decay takes place between spin excitation and the first TE. More details are available in the appendix.
Postprocessing of T2 Maps
Three regions-of-interest (ROIs) were marked on the PD map of each hip ( Fig. 2 ), using in-house software. 34 Two ROIs were drawn over the anterior-superior weightbearing region, extending from the chondrolabral junction to approximately the fovea and including either both femoral and acetabular cartilage (ALL), or only the acetabular cartilage (ACT). A third ROI (FEM) was drawn more medially, over the central portion of the femoral cartilage, which can generally be assumed to be healthy in early-stage FAI.1,2 Segmentations were performed using the PD maps as the reference to identify the border between acetabular and femoral cartilage. Voxels that appeared to cross the cartilage-bone interface were excluded from the segmentations to avoid partial volume artifacts. Mean and standard deviation (SD) of T2 values within the ROIs were calculated for all subjects. Outlier values, representing unphysical T2 values, were excluded from the calculations using Chauvenet’s criterion with a 2 standard deviation threshold. 35
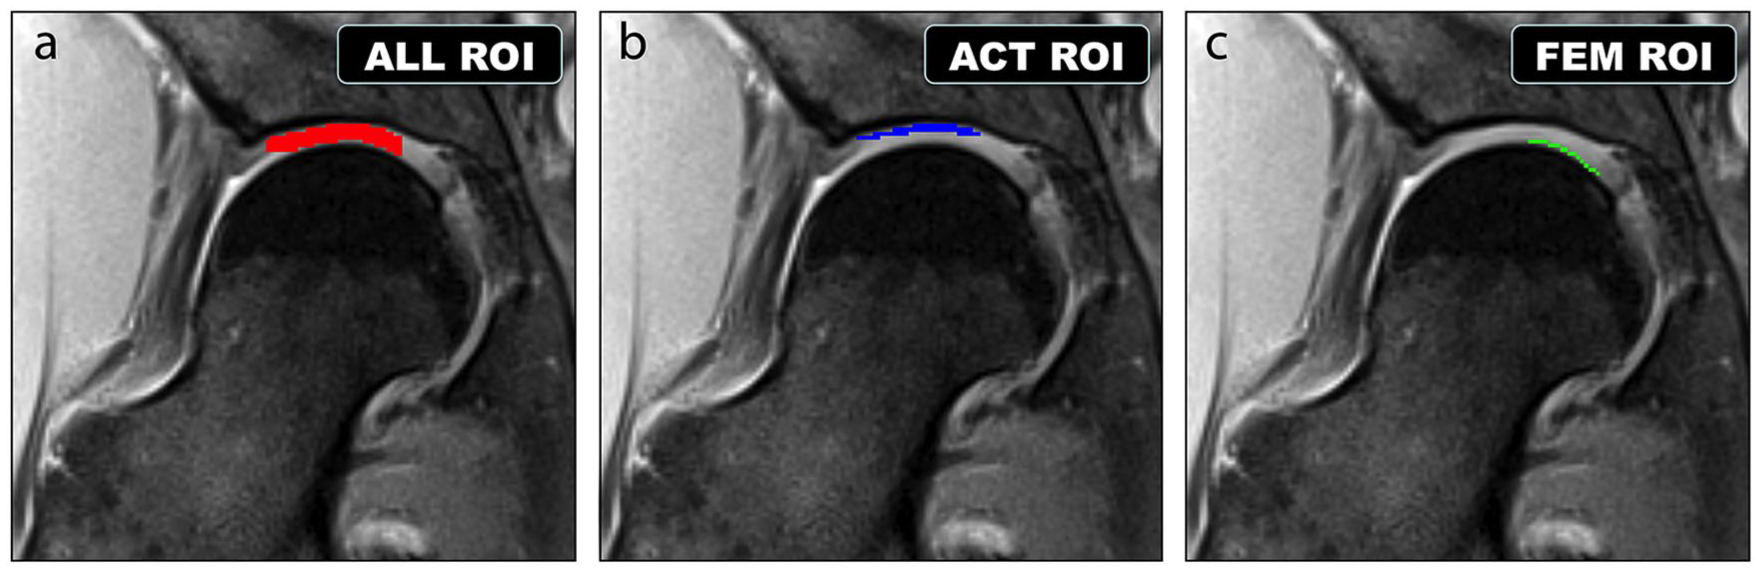
The 3 regions of interest (ROIs) for which average T2 values were extracted, shown on a representative anterior-superior (AS) radial section. (
Cartilage Evaluation Using T2
We defined a normalized T2-index as the ratio between the mean T2 values within the ACT and FEM ROIs (
Fig. 2
), in order to remove the effect of interpatient variability. In fact, previous work has shown that the central region of the femoral cartilage can be effectively used as an internal reference to normalize parametric maps.10,36 Since T2 is expected to be higher in abnormal cartilage,
11
we hypothesized that the T2-index could improve discrimination of damaged (T2-index
Results
Figure 3 shows a T2 map calculated with the EMC algorithm for a representative hip. One or more lesions were arthroscopically reported in the anterior-superior region of the hip articular cartilage for all 18 patients. Table 1 compares the average among all patients of the mean T2 in the 3 ROIs, the T2-index, and the ratio of the mean T2 values in the ACT and ALL ROIs, for the 2 segmentation sessions. Figure 4 shows the mean T2 in the 3 ROIs for each patient. The repeatability coefficient (CR), 37 which quantifies the absolute reliability between the 2 segmentation sessions, was 2.5 ms, 4.7 ms, and 4.7 ms, for ALL, ACT, and FEM ROIs, respectively. This corresponds to moderate intraobserver reproducibility for the segmentation of the acetabular and femoral ROIs. Nevertheless, Figure 5b shows that in all cases but 2, the T2-index was greater than 1, suggesting that the capability to identify damaged cartilage (T2-index >1) could be minimally affected by the reproducibility of the segmentation. The dynamic range for the T2-index was larger than for the normalized ACT/ALL index, whose distribution was symmetrically clustered around the value 1 ( Fig. 5a ).
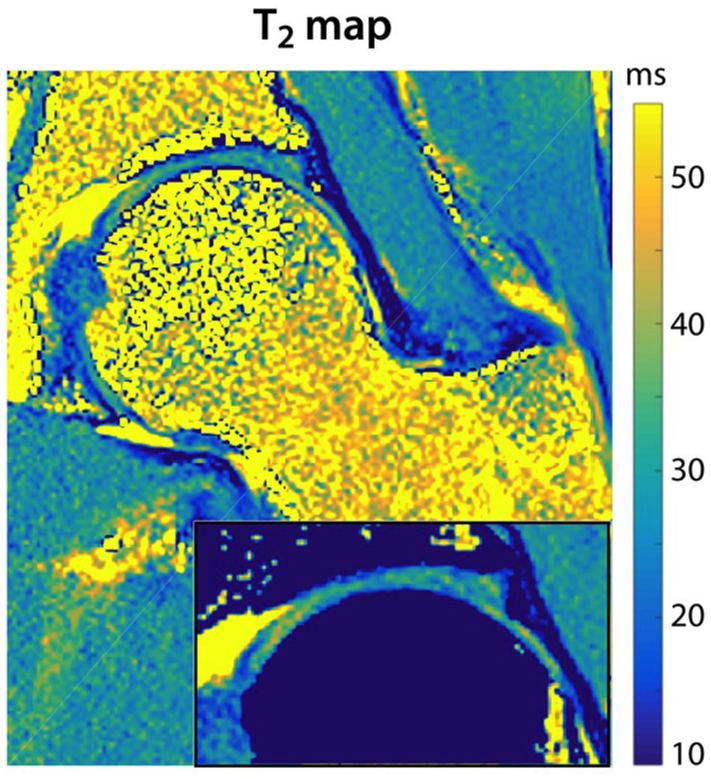
A T2 map generated with the echo-modulation-curve (EMC) algorithm for a representative radial hip slice. The bone tissue was masked out in the zoomed inset at the bottom of the map to show the delineation of cartilage contours and layers.
Average Cartilage T2 in the 3 Segmented ROIs and Normalized Metrics for Both Segmentation Sessions.
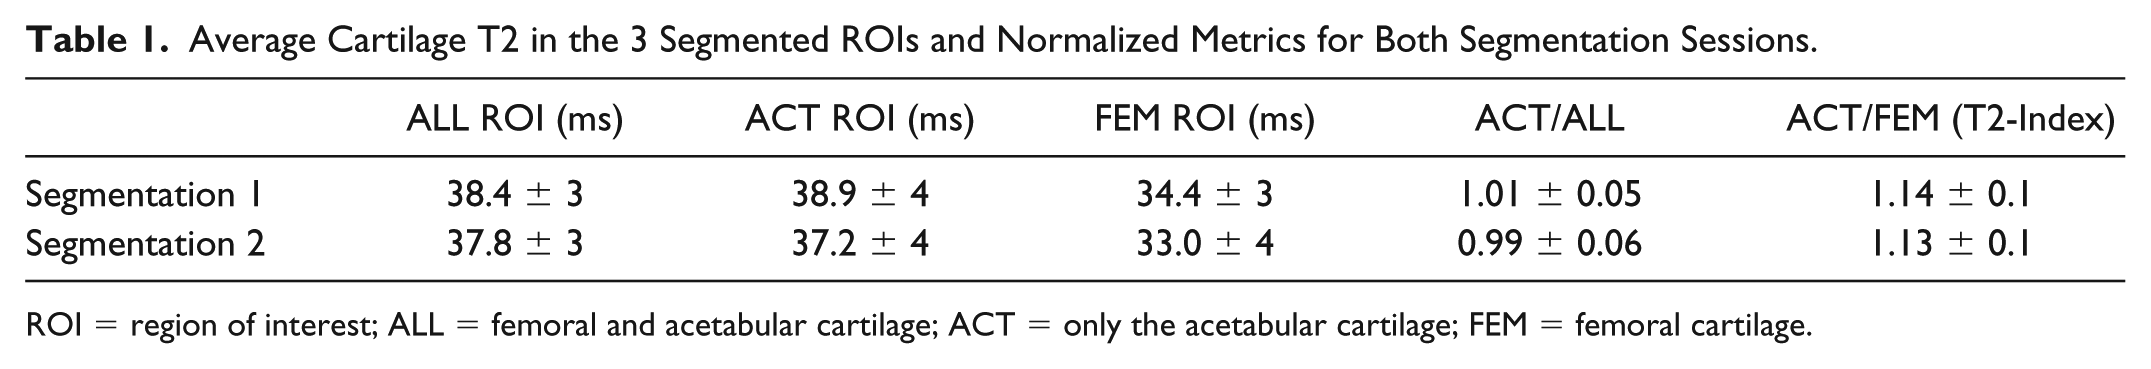
ROI = region of interest; ALL = femoral and acetabular cartilage; ACT = only the acetabular cartilage; FEM = femoral cartilage.
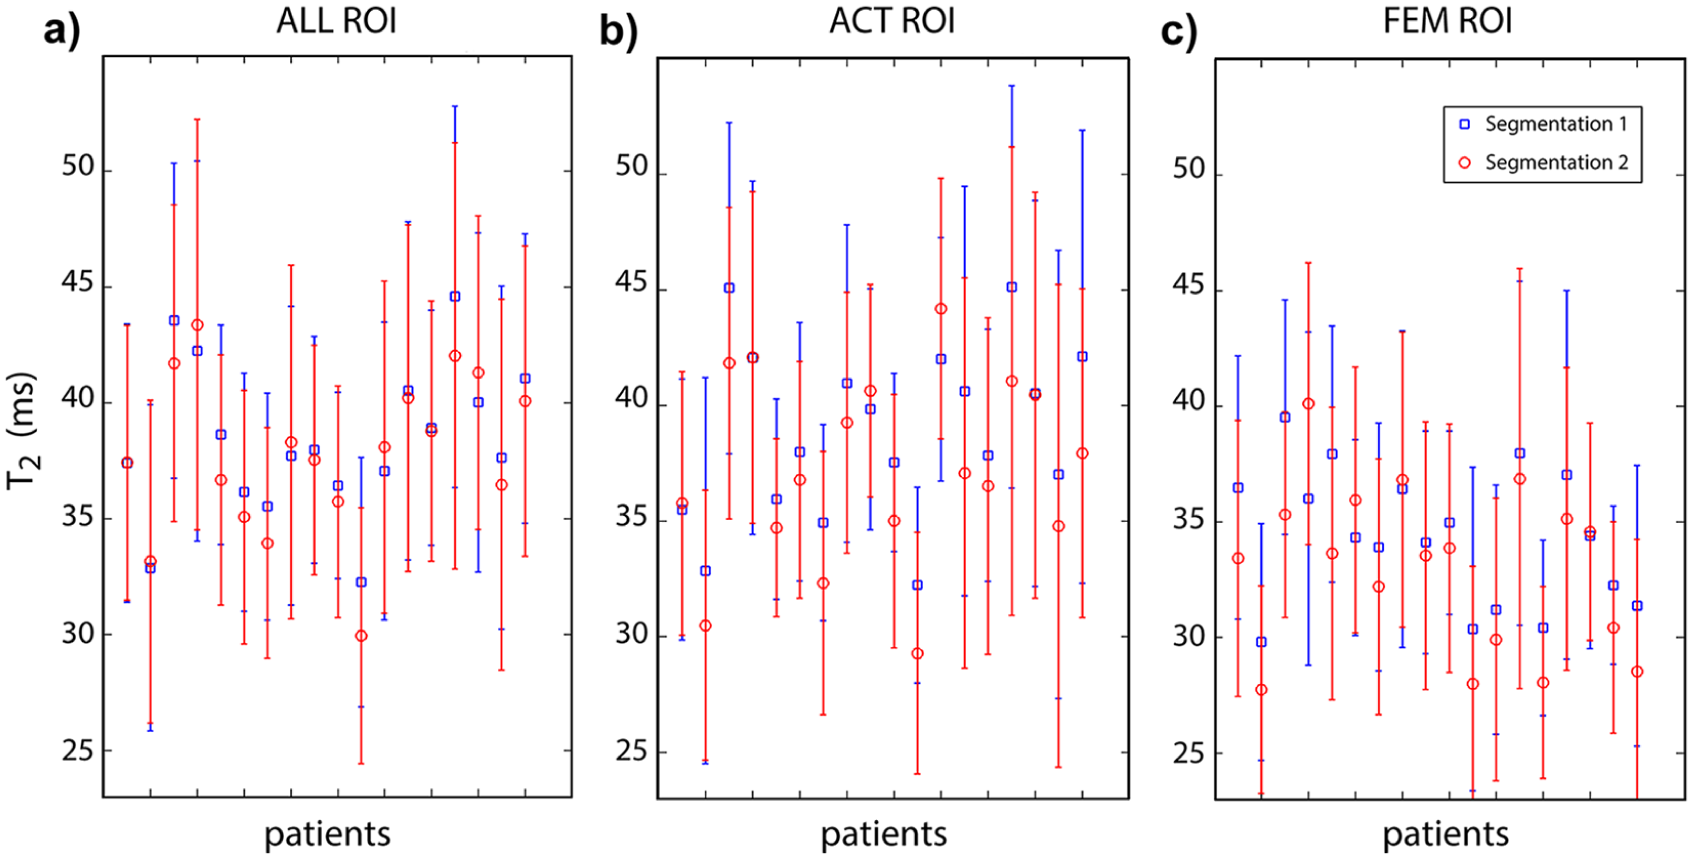
Distribution of T2 values in the segmented regions of interest (ROIs). The mean T2 in a region of interest including both femoral and acetabular cartilage (
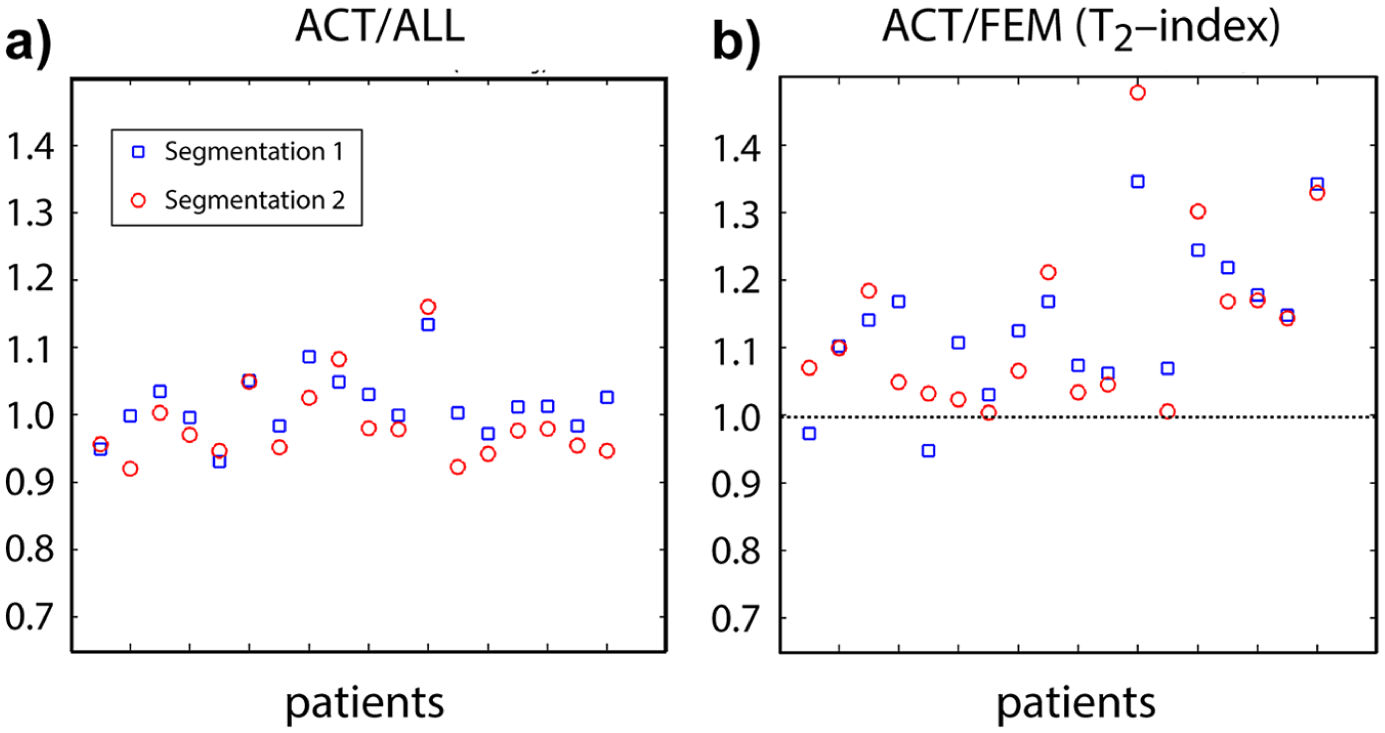
Scatterplots of normalized T2 values. The normalized index obtained as the ratio of the mean T2 values in the acetabular cartilage and in the full cartilage region of interest (ROI) (
Discussion
This work introduced a normalized T2-index as a possible biomarker for cartilage lesions in FAI. Assuming T2-index >1 as the threshold to identify cartilage defects, we found 88% and 100% accuracy in detecting arthroscopically confirmed cartilage lesions for 2 repeated segmentation of 18 hips. Our results also confirmed the importance of normalizing T2 values to remove any interpretation bias due to interpatient variability.
The intrinsic variability in T2 values between patients could mimic differences between normal and damaged cartilage. Thus, it may be difficult to find a threshold to discriminate cartilage lesions using non-normalized T2 values, even if they are accurate and reproducible. In fact, Figure 4 shows that it is not possible to identify a threshold on the segmented T2 values that would detect acetabular cartilage defects, while simultaneously confirming the femoral cartilage as healthy. Previous work has also shown that mean T2 values did not produce statistically significant discrimination between patients with and without cartilage lesions. For example, Wyatt et al. 13 found no significant difference in cartilage T2 between healthy controls (n = 10) and FAI patients (n = 12). Ferro et al. 38 reported higher T2 values for the acetabular cartilage of asymptomatic volunteers compared to FAI patients. Ascani et al. 20 reported sensitivity, specificity and accuracy of 43%, 87% and 80% when using T2 > 50 ms as the threshold to detect severe (Outerbridge grade >2) cartilage damage, employing morphologic evaluation as the reference. In this work, to reduce the effect of inter-patient variability, we have defined the T2-index, a global cartilage measure that relies on the central region of the femoral cartilage as an internal reference for normalization, similar to what is done in standardized dGEMRIC.10,36
Note that in the aforementioned studies, T2 was calculated by fitting MSE data to the theoretical exponential decay curve, which is prone to quantification errors that may in part account for the wide distribution of the reported T2 values. In this work, we employed the EMC algorithm for the quantification of T2 in the hip articular cartilage. The EMC algorithm has been validated in phantom studies 29 using single spin-echo acquisitions as the reference gold-standard. These showed 1% to 5% error across a range of T2 baselines and signal-to-noise ratio levels (10-100), and demonstrated T2 values stability across a range of scanners and parameter sets.
All patients in this study received an intravenous injection of gadopentetate dimeglumine for MR arthrography. Although this contrast agent can affect T2 relaxation time, the effect is small, particularly in comparison to the standard deviation of the measured T2 values, as well as in relation to their spatial variations across the cartilage.16,39 Therefore, we anticipate that the normalized T2-index would be effective also in the absence of contrast agent, although this hypothesis needs to be confirmed by future work.
The generality of our results is limited by the small group of 18 patients, all with surgically confirmed cartilage lesions, which might not represent a broad clinical population with FAI. The threshold T2-index >1 was robust enough to identify cartilage lesions in both segmentation sessions, despite moderate intraobserver repeatability. The latter is likely due to partial volume artifacts, given that at certain locations the ROIs were only 1 voxel thick. Future validation of the T2-index will require larger patient cohorts and would benefit from automated or assisted cartilage segmentation procedures.
The T2-index assumes that the central portion of the femoral cartilage is healthy, which was confirmed by the surgical reports of the patients in this study. While this is typical in early stages of FAI, the assumption makes the T2-index unsuitable in the case of FAI patients with more advanced cartilage degeneration 40 or injured ligamentum teres, 41 as well as for other hip pathologies, for example, dysplasia, where cartilage degeneration is more diffused. We investigated also a more generally applicable normalization strategy, obtained by dividing the mean T2 in the acetabular cartilage, where cartilage damage is expected to begin in FAI [1], by the mean T2 in the total cartilage (femoral and acetabular). This approach was proposed by Pollard et al. 42 to normalize dGEMRIC measurements, who showed that it was not effective in identifying CAM-type FAI on individual patients. Our results suggest that it is a less effective normalized metric than the T2-index. In fact, we found that the average value in the ACT and ALL cartilage ROIs is similar ( Table 1 ), which results in the normalized ACT/ALL index being symmetrically clustered around the value 1 ( Figure 5a ).
Rapid acquisitions with high-spatial resolution will be required in order to clinically translate T2-mapping for the evaluation of FAI patients. This could be achieved, for example, by combining the EMC technique with radial k-space sampling. 29 Another promising approach based on MR fingerprinting has been recently proposed for simultaneous mapping of T1 and T2 on 6 radial hip sections in 7 minutes. 43 This method is based on principles different from the EMC algorithm, but it also relies on accurate modeling of the pulse sequence to extract the tissue parameters.
In conclusion, this preliminary validation study suggests that the T2-index is a promising biomarker for the detection of cartilage lesions in FAI. The T2-index could be combined with morphologic MRI and other quantitative biomarkers to improve preoperative cartilage assessment in FAI. This is especially critical in FAI, because joint-preserving surgeries have higher success rate when the hip cartilage is still intact or only minimally compromised. 3
Footnotes
Appendix
Acknowledgments and Funding
The author(s) disclosed receipt of the following financial support for the research, authorship, and/or publication of this article: This work was supported in part by the research grants NIH/NIAMS R01 AR070297, NIH/NIBIB R21 EB020096, and was performed under the rubric of the Center for Advanced Imaging Innovation and Research (CAI2R, ![]() ), a NIBIB Biomedical Technology Resource Center (NIH P41 EB017183).
), a NIBIB Biomedical Technology Resource Center (NIH P41 EB017183).
Declaration of Conflicting Interests
The author(s) declared the following potential conflicts of interest with respect to the research, authorship, and/or publication of this article: TY has received consulting fees from Arthrex and Smith and Nephew. DKS has received royalties from GE Healthcare and Bruker Biospin. All other authors have no conflicts of interest to declare.
Ethical Approval
All procedures performed in studies involving human participants were in accordance with the ethical standards of the institutional and/or national research committee and with the 1964 Helsinki declaration and its later amendments or comparable ethical standards.
Informed Consent
This retrospective study was approved by the Institutional Review Board. This article does not contain identifiable patient data.
Trial Registration
Not applicable.