
Abstract
Objective:
Before quantitative imaging techniques can become clinically valuable, the method, and more specifically, the regions of locating and reporting these values should be standardized toward reproducibility comparisons across centers and longitudinal follow-up of individual patients. The purpose of this technical note is to describe a rigorous and reproducible method of locating, analyzing, and reporting quantitative MRI values in hip articular cartilage with an approach that is consistent with current orthopedic literature.
Design:
To demonstrate this localization and documentation, 3 patients (age, 23 ± 5.1 years; 2 males, 1 female) who presented with symptomatic mixed-type femoroacetabular impingement (α angle, 63.3° ± 2.1°; center edge angle, 39° ± 4.2°) were evaluated with T2-mapping at 3 T MRI prior to hip arthroscopy. Manual segmentation was performed and cartilage of the acetabulum and femur was divided into 12 subregions adapted from the geographic zone method. Bone landmarks in the acetabulum and femur, identifiable both in arthroscopy and MR images, were manually selected and the coordinates exported for division of cartilage.
Results:
Mean T2 values in each zone are presented.
Conclusions:
The current work outlines a standardized system to locate and describe quantitative mapping values that could aid in surgical decision making, planning, and the noninvasive longitudinal follow-up of implemented cartilage preservation and restoration techniques.
Introduction
Hip joint MRI has become clinically critical with development of hip arthroscopy as a successful and effective approach to treat a variety of early hip diseases. Articular cartilage assessment, however, remains difficult with current conventional MR methods, which are largely visual and qualitative. Quantitative MRI offers a noninvasive method of evaluating the biochemical properties of hip cartilage and may lend itself to improving patient care. Approaches such as T2- and T2*-mapping, and dGEMRIC and T1rho mapping have shown promise for detecting early cartilage changes in the hip.1,2 However, there is a disparity in how the results of these quantitative MRI methods are reported and a lack of a common language between radiologists and orthopedic surgeons, which has led to waning clinical relevance. Furthermore, comparisons in the reported values are not possible in large part because of variations in methodology and subregion division.
The purpose of this technical note is to describe a more rigorous method to potentially enhance reproducibility of analyzing and reporting these quantitative MRI values in a way that is consistent with the current orthopedic literature. To implement this technology clinically, there is a need for common methodology and terminology. Ideally, a classification system and set of rigorously and reproducibly defined subregions should be identified that could be used for intra-articular cartilage grading during arthroscopy and translated for use in quantitative image analysis. For this, a method for reporting quantitative MRI values with clinically relevant subregions based on a proven arthroscopic method is proposed and demonstrated with data presented from 3 hip patients prospectively enrolled and evaluated with a presurgical T2-mapping scan and articular cartilage graded during arthroscopy.
Methods
To demonstrate localization and documentation, 3 patients (age, 23 ± 5.1 years; 2 males, 1 female) presented with symptomatic mixed-type femoroacetabular impingement (α angle, 63.3° ± 2.1°; center edge angle, 39° ± 4.2°) based on clinical examination and plain radiographic findings were imaged at 3.0 T (Verio, Siemens Medical Solutions, Erlangen, Germany) using a large 4-channel Body Matrix Coil (Siemens Medical Solutions, Erlangen, Germany) prior to hip arthroscopy. The imaging protocol included standard clinical morphologic sequences followed immediately by a sagittal multi-echo spin-echo (MESE) T2-mapping sequence. The T2-mapping sequence (TR/TE, 2080/18-90 ms; VS, 0.78 × 0.78 × 2 mm; FOV, 200 mm; AT, 2 min) was acquired in the sagittal plane for optimal mapping of the anterior lateral articular cartilage, a common location for cartilage damage in the hip joint. All patients underwent surgery within 48 hours of cartilage mapping where cartilage of the hip joint was probed, graded and geographic location and size were immediately recorded by the investigator and verified by the orthopedic surgeon.
The hip subregions used for arthroscopic grading were developed by several international orthopedic surgeons and are documented in a publication by Ilizaliturri et al. 3 The geographic zone method has been shown to be more reproducible than the standard clock-face method and permits lesion mapping on both the convex and concave structures of the hip during arthroscopy. 3 The geographic zone method relies on intra-articular landmarks clearly visible during arthroscopy to delineate and facilitate the reporting of lesions within the geographic regions.
Iliziliturri et al. 3 described, for the geographic zone method, that the femoral head and acetabulum are presented in an open-book fashion, unlike the clock face method, allowing the femoral head to be a mirror image of the acetabulum. The zone numbers are assigned in a progressive fashion ( Fig. 1 ). For the femoral head, number 1 begins at the anterior inferior head with number 6 containing the ligamentum teres. For the acetabulum, number 1 begins at the anterior–inferior zone with number 6 ending at acetabular notch.
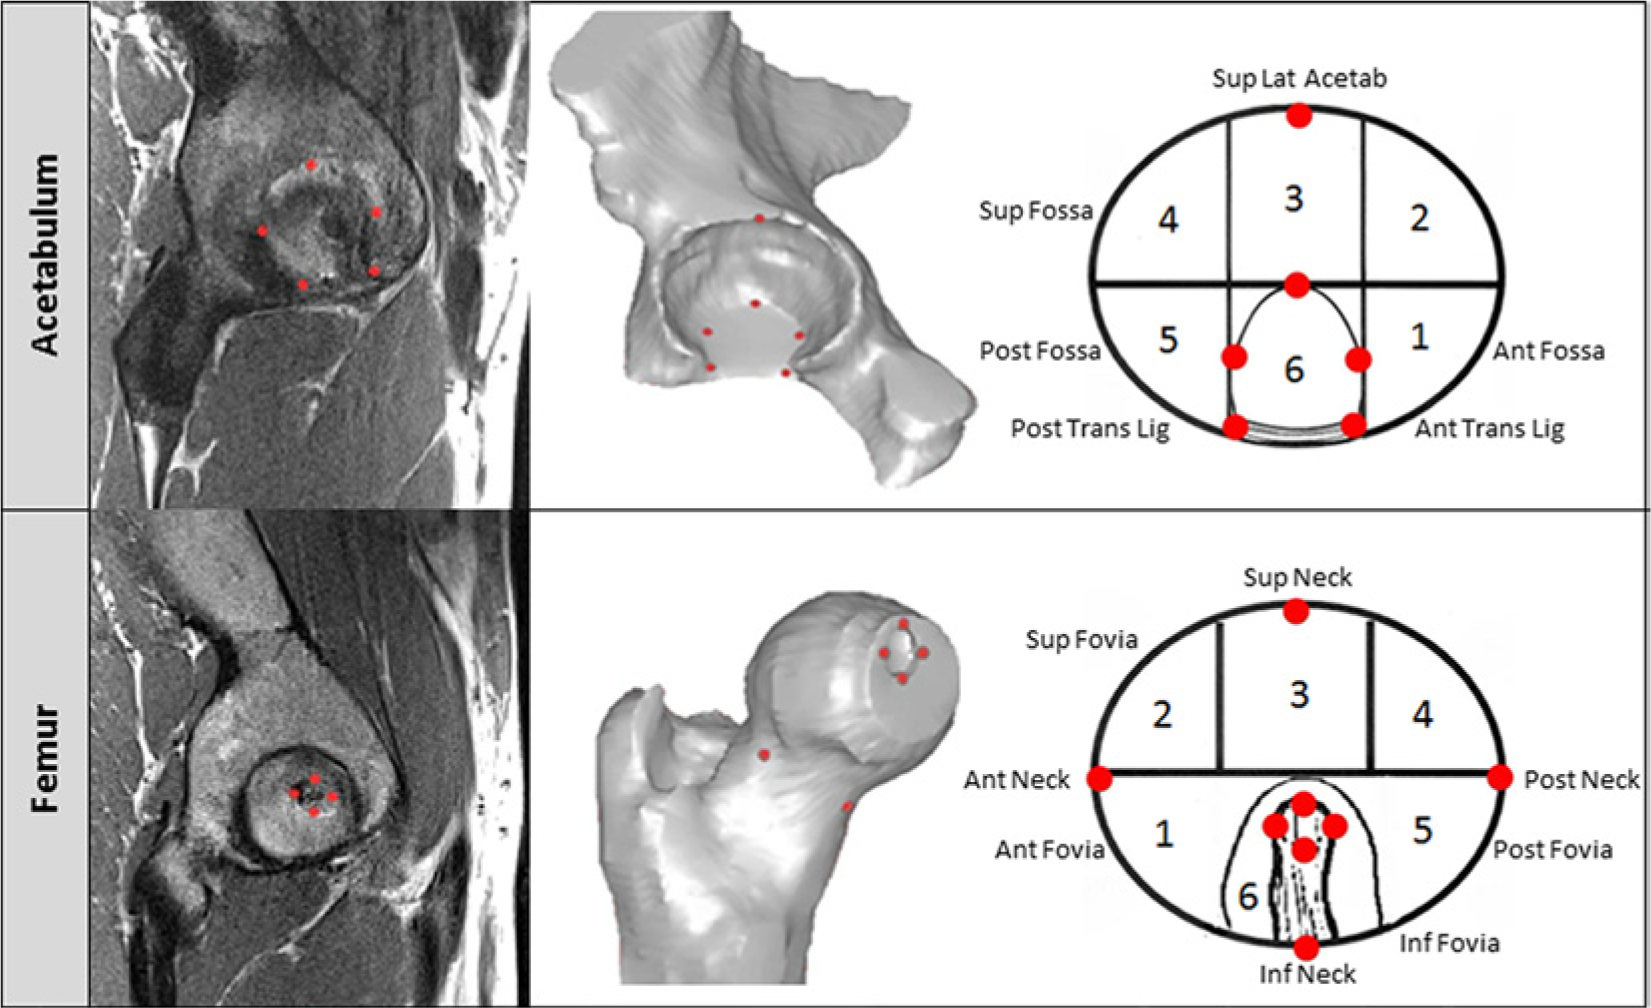
Adopted geographic zone method mapping system and bone landmarks (Ilizaliturri et al. 3 ). Subregions within the acetabular and femoral cartilage were divided based on the set of bone landmarks (red circles) identified by the rater.
When establishing these zones, Ilizaliturri et al. 3 described the acetabular fossa as the principal landmark by which 2 vertical lines are visually drawn at the anterior and posterior aspects of the fossa and a horizontal line visually drawn at the superior limit of the fossa to make up 6 subregions or “zones” of the acetabulum (described later in detail). As it is done in an open-book fashion, the same system is applied to the femoral head around the ligamentum teres. This method has proven sensitivity and reproducibility arthroscopically; however, translating this method to imaging would require a set of reliable bony landmarks on both the acetabulum and femoral head to be visible not only arthroscopically but in MR images. We therefore describe in detail below a set of landmarks that have been proposed by a board-certified orthopedic surgeon and musculoskeletal radiologist at our institution that satisfy these requirements. Using these landmarks, we are then able to divide automatically the entire articular cartilage volume into the described geographic zone regions.
Landmarks and Selection Method
For the purpose of selecting bony landmarks, bone contours from the T2-mapping sequence were manually segmented with a stylus and touch screen monitor based on the low/absent signal of the subchondral cortical bone surface. Using the segmentations the patient’s 3-dimensional (3D) bone geometries of the acetabulum and femur were reconstructed in Mimics (Materialise, Plymouth, MI). Using a split screen view, the 3D bone reconstructions were used to choose 14 anatomic bone landmarks identifiable both during arthroscopy and in MR images. These landmarks were used to divide the cartilage into the 12 zones described by Ilizaliturri et al., 3 6 each of the femur and acetabulum ( Fig. 1 ).
Eight bone landmarks were used in the femur to create the 6 subregions. The subregions on the femoral head and the bone landmarks are depicted in Figure 1 . The landmarks used for division into these zones included a landmark located at the medial, lateral, superior, and inferior aspects of the fovea. The center of the fovea was calculated as the center of these 4 landmarks. Landmarks were placed at the medial, lateral, superior, and inferior aspects of the head and neck junction of the femur. To separate the femur into the superior region (zones 2, 3, and 4) and inferior region (zones 1, 5, and 6), a plane was created between the center of the fovea and the landmarks on the anterior and posterior femoral neck. The anterior and posterior regions were separated by a plane created between the superior neck landmark, the center of the fovea, and the inferior neck landmark. Using this plane, the superior and inferior cartilage was divided into thirds in the anterior–posterior direction thus creating zones 1 to 6.
Six bone landmarks were used in the acetabulum to create zones 1 to 6. The zones of the acetabulum and the bone landmarks are illustrated in Figure 1 . A landmark was placed on each of the most anterior, posterior, and superior regions of the acetabular fossa (where there are no cartilage articulations). A landmark was placed on each of the anterior and posterior insertions of the transverse ligament at the most inferior portion of the acetabular fossa. A sixth landmark was located at the superolateral aspect of the acetabular rim; located by creating a line between the anterior and posterior transverse ligament landmarks, finding the midpoint, and creating an orthogonal line from the midpoint to the superiolateral aspect of the acetabular rim. When chosen without the guidance presented, the superiolateral aspect of the acetabular rim landmark had great variation between three raters in a pilot of the methodology and is demonstrated in Figure 2 . To separate the superior region (zones 2, 3, and 4) and inferior region (zones 1, 5, and 6) of the acetabulum, a line parallel to that connecting the posterior and anterior fossa landmarks was aligned with the superior fossa landmark. To separate the anterior and posterior regions, the line connecting the transverse ligament landmarks was used as a reference and orthogonal lines were created from each of the anterior and posterior landmarks up to the acetabular rim. These lines created a middle region, which included zone 3 superiorly and zone 6 inferiorly.
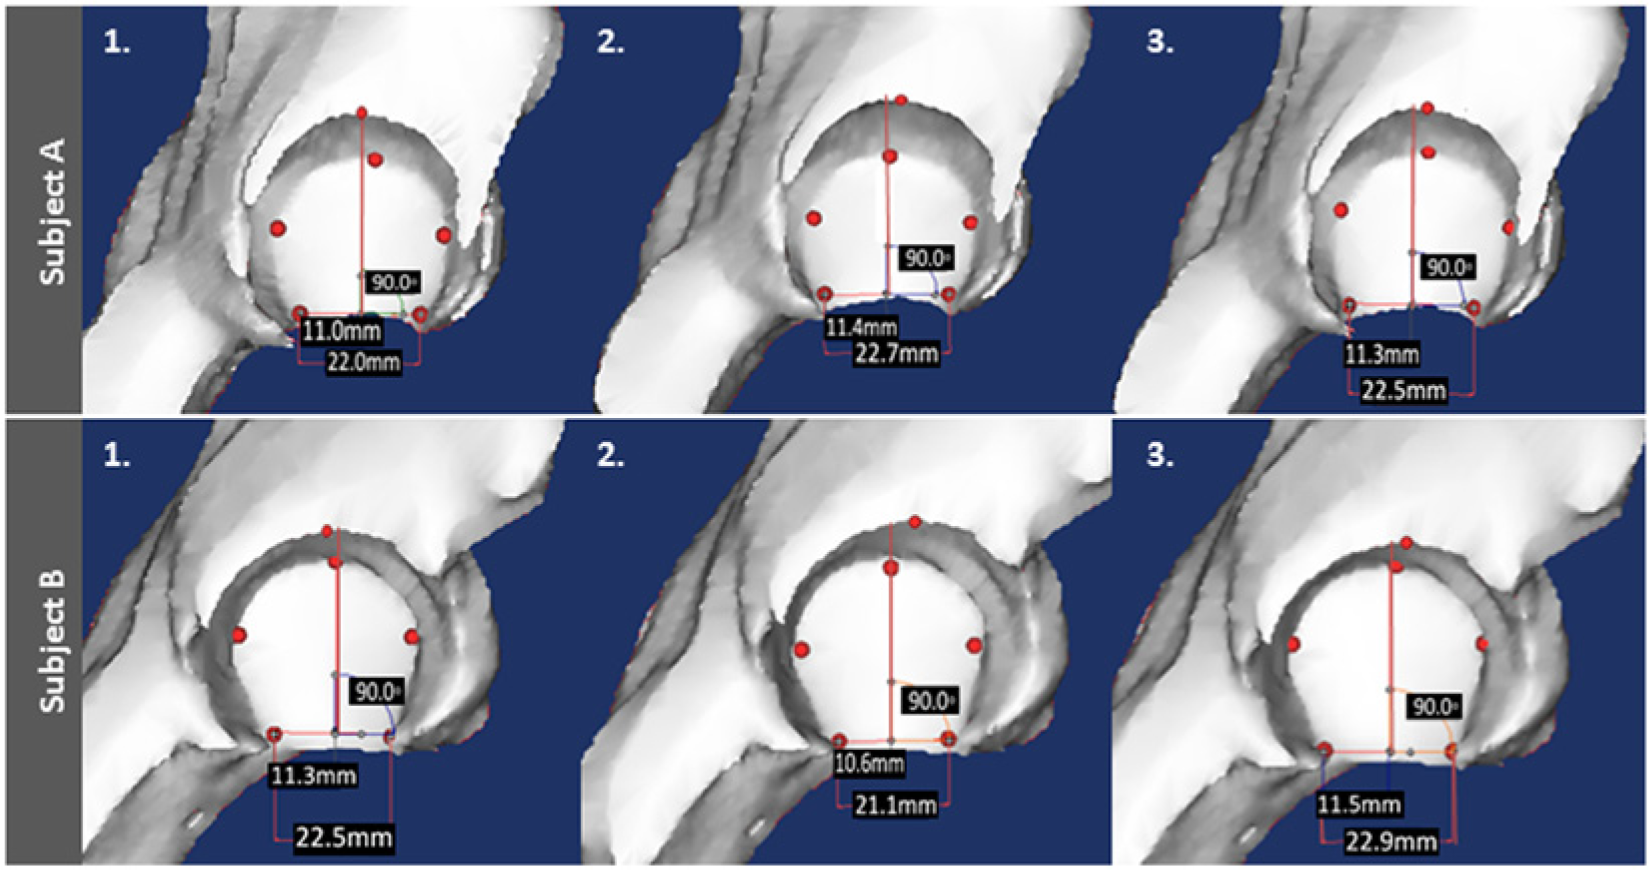
Landmarks of the acetabulum (red circles). Demonstration of the slight variability of the superiolateral aspect of the acetabular rim landmark between the 3 raters in 2 subjects (rater 1; rater 2; rater 3) when placed without guidance. Red vertical line demonstrates proper placement, based on the proposed methodology.
Results
We have omitted reporting values for zone 6 as it is associated with the insertion of the ligamentum teres and thus contains little cartilage. Zone 6 in the acetabulum was also omitted as it largely contains the acetabular notch, a nonarticular depression. Descriptive statistics for three patients, including pixel count per subregion, are depicted in Table 1 . For visualization of the T2 overlay based on the manual segmentation and subregion division, mean and standard deviations for each subregion within the acetabulum and femoral head of 1 patient are presented in Figure 3 .
Subregional Descriptive Statistics (N = 3).
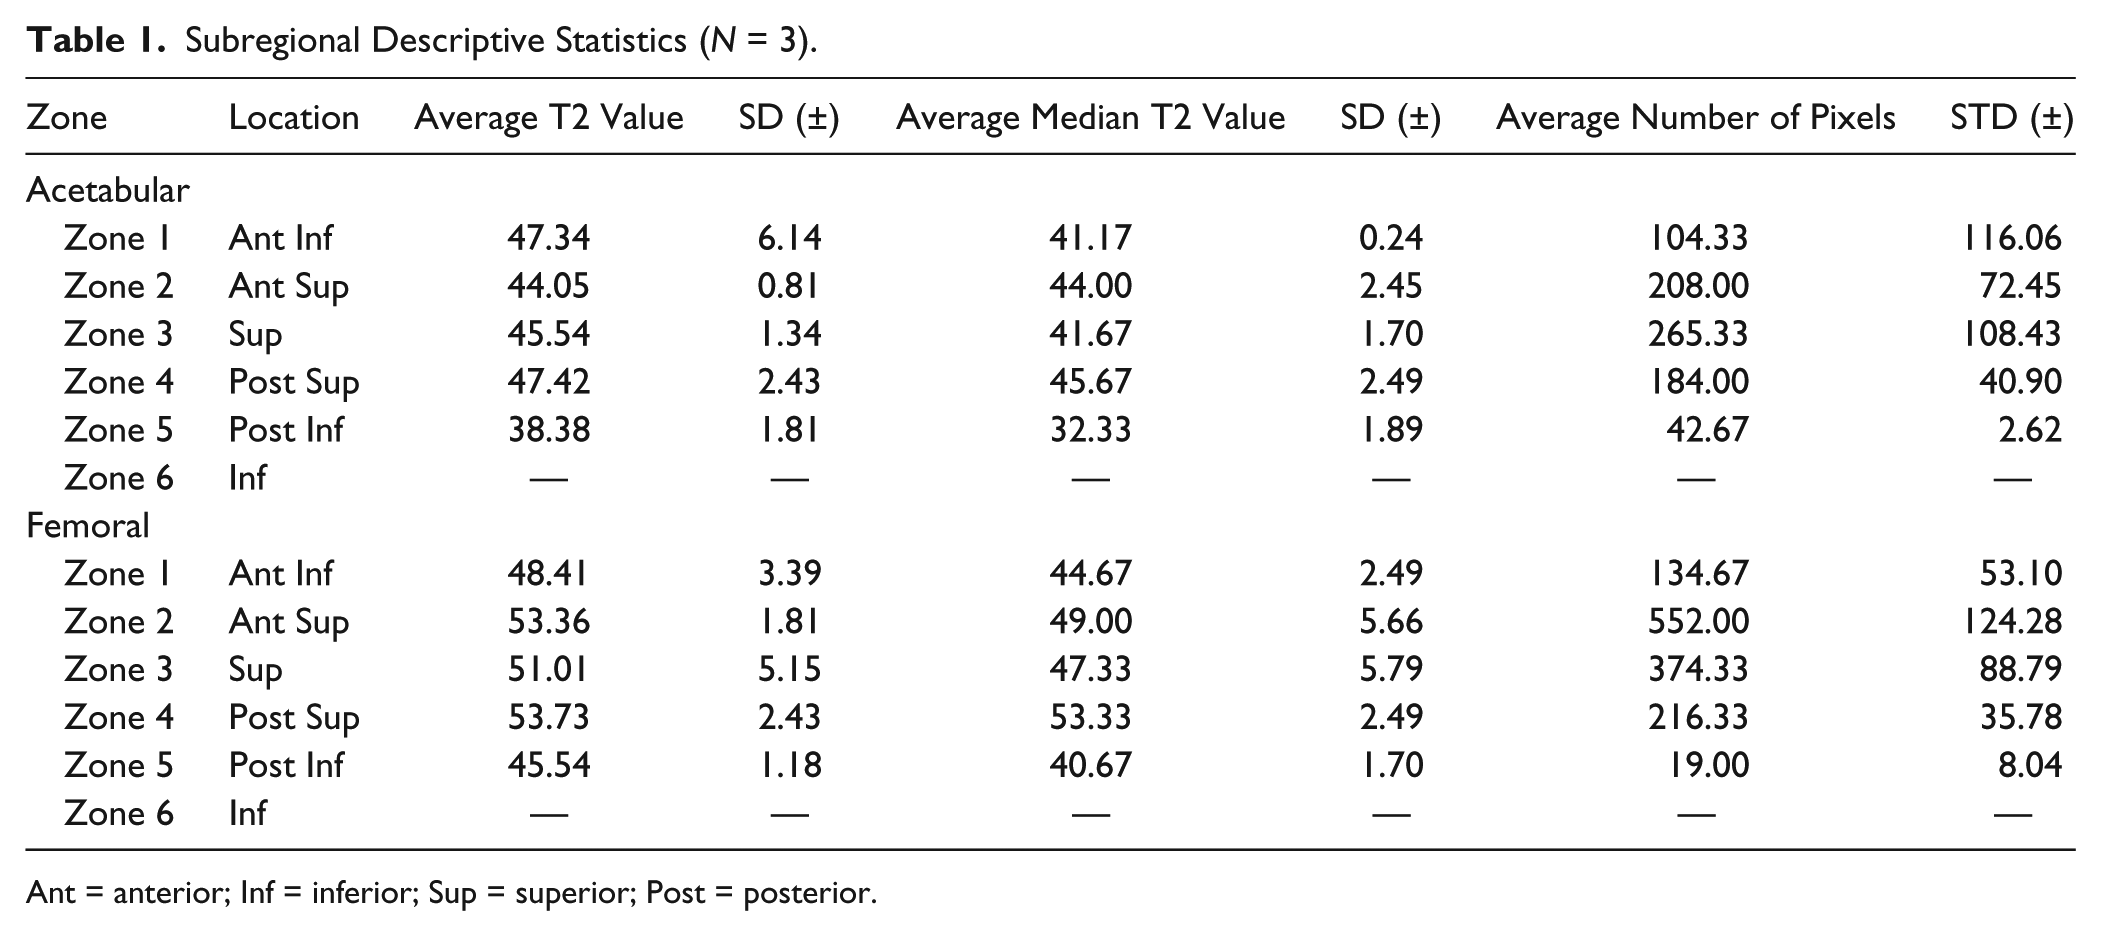
Ant = anterior; Inf = inferior; Sup = superior; Post = posterior.
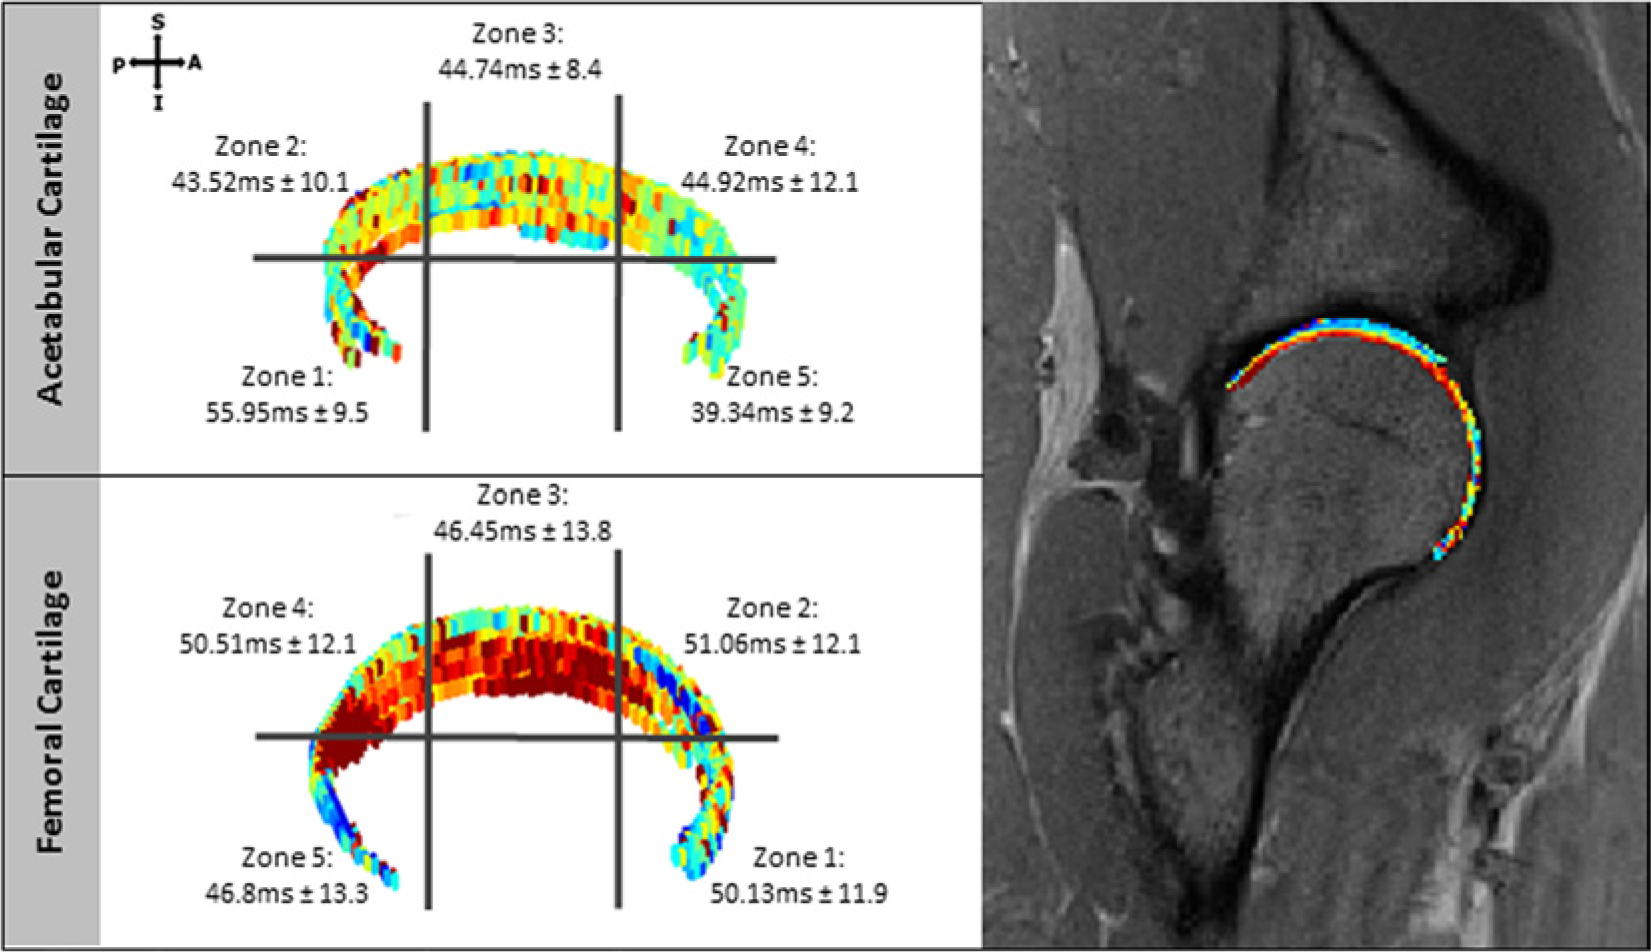
T2-mapping masks of the acetabular and femoral cartilage. geographic zone regions 1 to 5 depicted with mean ± standard deviation for 1 patient. Corresponding MR image with T2-mapping overlay derived from manual segmentation. ms = milliseconds; S = superior; A = anterior; I = inferior; P = posterior.
Discussion
We describe an approach that uses a set of arthroscopically validated subregions to locate and report articular cartilage damage using quantitative MRI mapping in the hip. A set of standardized, clinically relevant subregions are critical for the improvement and ultimate implementation of quantitative mapping into the clinical workflow. The described methodology would allow the arthroscopic location and identification of lesions to be successfully correlated with quantitative MRI values. The current work outlines a standardized system for radiologists to describe quantitative mapping values which could aid in surgical decision making, planning and the noninvasive longitudinal follow-up of implemented cartilage preservation and restoration techniques.
The authors feel this method, adapted from the arthroscopic technique described by Ilizaliturri et al., 3 may be appropriate for image analysis and subregion classification for quantitative MRI evaluation creating a common language between radiologists and orthopedists. Therefore we have implemented this zonal system for the location of lesions of the articular cartilage in our arthroscopic classification system as well as our correlated quantitative image analysis including our subregion classification.
Evaluation of hip articular cartilage may be limited by using segmentations from the sagittal view alone. The most inferior aspects of zones 1 and 5 for both the femur and acetabulum may be underreported as visualization is limited by the plane. However, these regions are not common areas for development of osteoarthritis. By integrating a coronal quantitative mapping scan, the inferior regions would be better visualized.
Conclusions
The current work outlines a standardized system to locate and describe quantitative mapping values that could aid in surgical decision making, planning, and the noninvasive longitudinal follow-up of implemented cartilage preservation and restoration techniques.
Footnotes
Acknowledgments and Funding
The author(s) disclosed receipt of the following financial support for the research, authorship, and/or publication of this article: This research was funded in part by Siemens Medical Solutions. Siemens did not contribute to the study design, collection, interpretation or publication of this work.
Declaration of Conflicting Interests
The author(s) declared no potential conflicts of interest with respect to the research, authorship, and/or publication of this article.
Ethical Approval
This study was approved by our institutional review board.