
Abstract
Objective
The current therapeutic strategy for posttraumatic osteoarthritis (PTOA) focuses on early intervention to attenuate disease progression, preserve joint function, and defer joint replacement timing. Sequential transcriptomic changes of articular cartilage in a rat model were investigated to explore the molecular mechanism in early PTOA progression.
Design
Anterior cruciate ligament transection and medial meniscectomy (ACLT + MMx)–induced PTOA model was applied on male Wistar rats. Articular cartilages were harvested at time 0 (naïve), 2 week, and 4 weeks after surgery. Affymetrix Rat genome 230 2.0 array was utilized to analyze the gene expression changes of articular cartilages.
Results
We identified 849 differentially expressed genes (DEGs) at 2 weeks and 223 DEGs at 4 weeks post–ACLT + MMx surgery compared with time 0 (naïve group). Gene ontology and Kyoto Encyclopedia of Genes and Genomes (KEGG) pathway analysis were performed to gain further insights from these DEGs. 22 novel genes and 1 novel KEGG pathway (axon guidance) in cartilage degeneration of osteoarthritis were identified. Axon guidance molecules—Gnai1, Sema4d, Plxnb1, and Srgap2 commonly dysregulated in PTOA progression. Gnai1 gene showed a concordant change in protein expression by immunohistochemistry staining.
Conclusions
Our study identified 22 novel dysregulated genes and axon guidance pathway associated with articular cartilage degeneration in PTOA progression. These findings provide the potential candidates of biomarkers and therapeutic targets for further investigation.
Introduction
Posttraumatic osteoarthritis (PTOA) accounts for approximately 12% of all patients with clinically symptomatic OA.1,2 PTOA mostly affects young people who are productive and have higher joint demands. In a previous study, PTOA resulted in end-stage OA 10 years earlier than did age-related OA. 3 No current treatments can stop or reverse late-stage OA, and joint replacement for end-stage PTOA is not an ideal solution because of the limited life span of prostheses for younger individuals. 3 The goal of novel emerging therapeutic studies is early intervention with disease-modifying therapy attenuating OA progression to determine joint replacement timing.4-6 A more comprehensive understanding of the initiation and progression of arthritis after joint injury is essential for achieving this goal.
Functional genomics is a genome-wide approach to studying the functions and interactions of genes on a global scale. Genomics focuses on the static properties of genes such as DNA sequences or structures; functional genomics specifically focuses on dynamic properties such as gene transcription, translation, and protein-protein interaction. Progressive articular cartilage dysfunction and damage are the key characteristics of OA. The molecular pathogenesis of OA is complex. For example, imbalance between anabolism and catabolism in chondrocytes occurs during OA development. Microarray technology facilitates the determination of the molecular mechanisms of cartilage degeneration in OA progression by using gene expression analysis. 7 Articular cartilage is a suitable target for functional genomics study because it is composed of a single cell type: chondrocytes.7-9
Recent studies related to transcriptomic changes of osteoarthritis from human articular cartilage mostly compared two different regions in the same articular cartilage. 10 Grossly damaged surface was sampled as “disease group,” and gross smooth surface was sampled as “normal group.” This “relative” normal sample method may cause potential bias. Recently, Takashi et al. 11 conducted the first transcriptome study on human hip OA cartilage, and they harvested the normal cartilage samples from patients with fractured femoral head undergoing hemiarthroplasty. It reduced the risks of bias, but still could not study the progress of OA, particularly in the early phase. Because of these limitations in comprehensively analyzing the progression of early PTOA, a favorable translational animal model can provide a clinically relevant method of understanding OA progression. OA can be induced in various animal species, such as horses, sheep, dogs, rabbits, rats, and mice. 12 Compared with large animals (horses, sheep, and dogs), rats have the advantages of low husbandry costs, ease of manipulation, and suitable size for whole-joint histopathological evaluation on one slide. Furthermore, rats are suitable candidates for the genomic study of cartilage because of their relatively higher chondrocyte volume density (12%-25%) compared with rabbit and dog (2%-12%) as well as ease of harvest. 13 Anterior cruciate ligament transection (ACLT) has been commonly used to induce the time-dependent progression of cartilage degeneration in OA in rats, because it is morphologically and histologically similar to human OA.14,15 Hayami et al. 14 demonstrated that anterior cruciate ligament transection and medial meniscectomy (ACLT + MMx) in rats induced a faster progression of cartilage degeneration and subchondral bone remodeling than did ACLT alone. Detectable cartilage damage occurred within 2 weeks of ACLT + MMx.14,16 We previously applied this animal model to validate the chondroprotective effect of intra-articular hyaluronic acid. 17
In this study, we explored the molecular mechanisms of cartilage degeneration during PTOA progression by using genome-wide expression analysis. A rat OA model after ACLT + MMx surgery was used for genomic profiling of the articular cartilage.
Methods and Materials
Rat Model of PTOA
All rats were housed under controlled temperature (22°C-24°C), humidity (50%-55%), and lighting (12-hour light:dark cycle) conditions. A total of 45 three-month-old male Wistar rats (weight, 403.54 ± 41.11 g) were divided into 3 groups: naïve, 2 weeks post–ACLT + MMx, and 4 weeks post–ACLT + MMx (n = 15 for each group) groups. The rats in the naïve group were sacrificed by exsanguination under isoflurane anesthesia without knee surgery. Meanwhile, the remaining groups (n = 30) underwent ACLT + MMx on their right hindlimb knee joints under inhalational anesthesia and isoflurane and sterile conditions. Intraperitoneal cefazolin (20 mg/kg) was postoperatively administered. 17 Fifteen rats were sacrificed by exsanguination under isoflurane anesthesia at 2 weeks after ACLT + MMx, and the remaining 15 rats were sacrificed at 4 weeks postoperatively. The experimental protocol was approved by the Institutional Animal Care and Use Committee of Cathay General Hospital.
Histopathological Examination of the Experimental Knee Joint
Five rats in each group were examined histologically. After sacrifice, their right hindlimb knee joints were harvested from the distal femur to the proximal tibia. These harvested joints were then fixed in 4% paraformaldehyde for 2 days and transferred to Decalcifier II (Surgipath, Richmond, VA, USA) for another day. The decalcified joints were embedded in paraffin by using an automatic processor (Autotechnicon Mono 2, Technicon Co., Chauncey, NY, USA). Furthermore, 5-μm serial coronal sections of the central region of the medial femoral condyles (weight-bearing sites) and synovium (from the suprapatellar pouch) were sliced using the Leica 2065 rotatory microtome (Leica Instruments, Wetzlar, Germany). Ten sections were randomly selected for each sample; 5 were subjected to safranin O fast green staining to detect proteoglycan loss in the articular cartilage, and 5 to hematoxylin-eosin staining to evaluate morphological changes in the synovium. 17
RNA Extraction and Microarray Analysis
The articular cartilage from the distal femur and tibial plateau was harvested using a scalpel immediately after exsanguination and snap frozen into liquid nitrogen. The total RNA was extracted from the cartilage using the Illustra TriplePrep kit (GE Healthcare, Buckinghamshire, UK) according to the manufacturer’s protocol. To minimize individual differences, we combined 2 rats RNA samples to one genechip microarray reaction. RNA quantification was done spectrophotometrically using Nanodrop 2000 (Thermo Scientific, Wilmington, DE, USA). For assessment of RNA quality, RNA was electrophoresed on a 0.8% agarose gel, and ribosomal RNAs at 28S and 18S were visualized with GenScript DNAsafe nucleic acid gel stain. The A260/280 ratio (approximately 2.0) for RNA samples calculated by Nanodrop was also considered to assess quality of the RNA preparation. After excluding the unqualified samples, 4 genechips microarray reactions were conducted in each group. The gene expression data were generated using the Affymetrix Rat genome 230 2.0 array (Affymetrix, Santa Clara, CA, USA). Furthermore, the cRNA synthesis and labeling were conducted according to Affymetrix GeneChip protocol (Affymetrix), and the arrays were scanned with Affymetrix GeneChip 3000 7G (Affymetrix).
Data Analysis and Processing
Data were processed and analyzed using R (http://cran.r-project.org/). The datasets were normalized using the Robust Multiarray Average18,19 function in the “affy” library of Bioconductor (http://www.bioconductor.org/). We used the linear models for the microarray (LIMMA) method, 20 which is a package for performing differential analysis through microarray data. The idea is to fit a linear model to the expression data for each gene, enabling differentially expressed genes (DEGs) to be identified at varying selection thresholds. DEGs were selected with the LIMMA method by using a false discovery rate (FDR) of <0.05; they were then used in subsequent analyses.
Functional Enrichment Analysis and Consensus DEG Identification
For functional enrichment analysis, DAVID V 6.7 (http://david.abcc.ncifcrf.gov/home.jsp) was used on the DEGs in the 2 and 4 weeks post–ACLT + MMx groups as well as upregulated and downregulated DEGs in the 2 groups to explore enrichment in biological category ranking according to gene ontology (GO) Biological Process terms 21 and the Kyoto Encyclopedia of Genes and Genomes (KEGG) pathways 22 by using P < 0.05 (Fisher’s exact test). Based on these categories, we selected 2 sets of consensus DEGs (cDEGs). The first was the upregulated cDEGs from the overlapping GO terms and KEGG pathways of the 2 weeks and 4 weeks post–ACLT + MMx groups, and the other was the downregulated cDEGs from the overlapping GO terms and KEGG pathways of the 2 groups. We further collected information on these cDEGs through GeneCards (http://www.genecards.org/). 23
Immunohistochemistry
To validate the microarray gene expression data at the protein level, Gnai1 was subjected to immunohistochemical stain. We pretreated 5-μm sections from rat knee joints in an incubator at 65°C for 2 hours, immersed them in 1:20 Trilogy solution (920P-06, Cell Marque, Rocklin, CA, USA), and boiled them for 15 minutes until deparaffinization. Following deparaffinization and hydration, 3.5% hydrogen peroxide was added on the slides at room temperature for 5 minutes to quench the endogenous peroxidase activity. The slides were subsequently treated with 1:10 Power Block solution (HK111-5K, BioGenex, Fremont, CA, USA) at room temperature for 5 minutes to block nonspecific binding. A primary antibody was diluted with Power Block at a dilution of 1:300, added to the slides, and incubated at 4°C overnight. The slides were washed with Tris-buffered saline and 0.1% Tween 20 (Bionovas, Toronto, Ontario, Canada) at room temperature for 5 minutes. A polymer-HRP IHC detection system (QD420-YIKE, BioGenex) was then added at room temperature for 30 minutes. This step was followed by the addition of a chromogenic substrate, 3,3′-diaminobenzidine (HK124-05K, BioGenex), at room temperature for 2 minutes. The tissues were stained with hematoxylin-eosin (ScyTek Laboratories, Logan, UT, USA) to stain the nucleus at room temperature for 30 seconds. After being washed in water, the tissues were dehydrated and stabilized with a mounting medium and examined under a microscope.
References Validation
We further validated the cDEGs by searching PubMed database (MEDLINE/Index Medicus) without limitation on the publication year. We used gene name, gene-coding protein names, and cartilage or chondrocyte as keywords to search for relevant references. Taking Dmp1 gene for example, we searched the literature by using the paired keywords “Dmp1” and “cartilage,” “Dmp1” and “chondrocyte,” “dentin matrix protein 1” and “cartilage,” “dentin matrix protein 1,” and “chondrocyte.” We reviewed the searched results to identify studies related to Dmp1 gene or protein expression in osteoarthritic chondrocytes or cartilage and reviewed the literature to characterize the expression data at the protein level (detected using Western blot) of human OA cartilage as well as at the gene level (detected using the quantitative polymerase chain reaction) of the rat surgical OA model. 24 Dmp1 expression was suppressed in OA cartilage in a time-dependent manner that supports the findings from our microarray data.
Results
Validation of the Rat PTOA Model
Progressive deformity and swelling of the experimental knees developed gradually after ACLT + MMx. In the gross appearance of the experimental knees, inflammatory changes (redness, heat, and swelling) were more obvious in 2 weeks post–ACLT + MMx group than 4 weeks post–ACLT + MMx group. The difference in width between the experimental and contralateral (nonsurgical) knee was 0.89 ± 0.29 mm in the 4 weeks post–ACLT + MMx group.
Histopathological examination revealed that the articular cartilage surface and the cartilage matrix fully stained with safranin O were intact in the naïve group ( Fig. 1 ). Focal damage and fibrillation of the surface cartilage isolated from the experimental knee joints were observed in the 2 weeks post–ACLT + MMx group. An extended damage area, proteoglycan loss (reduced safranin O stain), and cartilage surface fibrillation with clefts into the transitional zone occurred in the 4 weeks post–ACLT + MMx group. The Mankin scores were 0.5 ± 0.54 of naïve rats, 3 ± 1 of 2 weeks post–ACLT + MMx group, and 4.875 ± 0.25 of 4 weeks post–ACLT + MMx group.
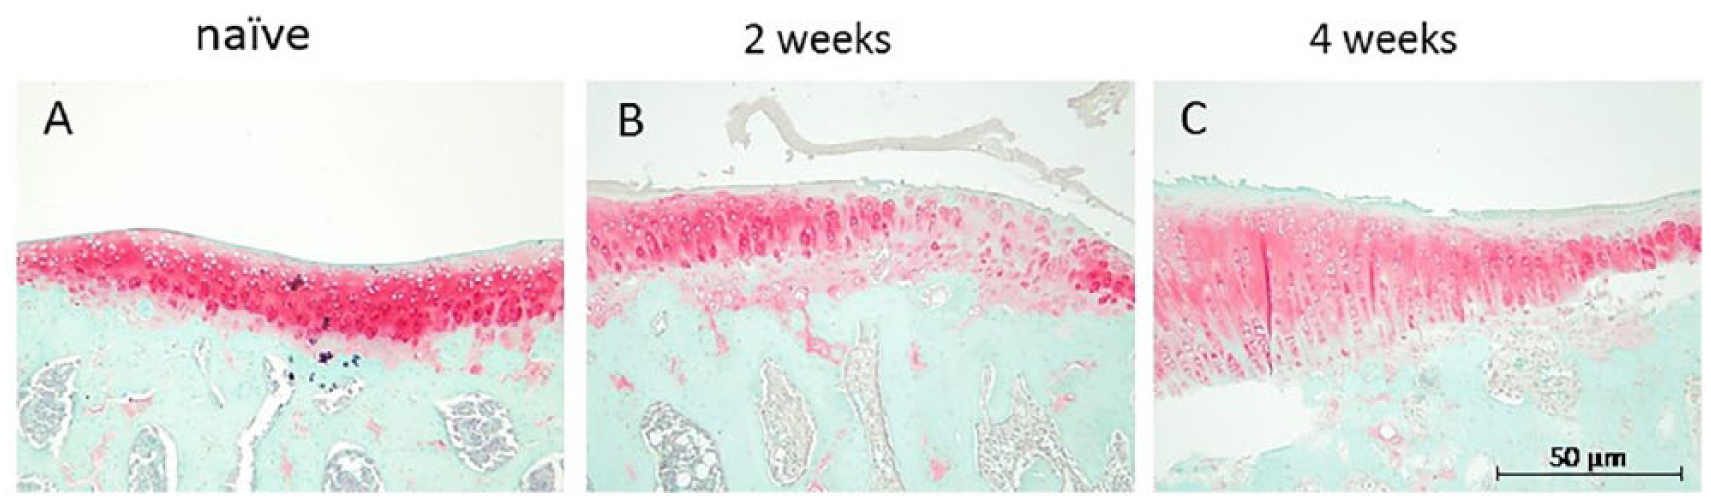
Histological evaluation of cartilage degradation induced by anterior cruciate ligament transection and medial meniscectomy (ACLT + MMx). Sections from the ACLT + MMx joints were obtained from naïve (
Gene Expression Analysis of Articular Cartilage
The sequential gene expression changes in articular cartilage after ACLT + MMx surgery were studied with bioinformatics analysis of the microarray data. Principal component analysis (PCA) revealed that all samples can approximately grouped into 3 groups (each group n = 4) by the distribution pattern of overall gene expression, and the samples from same time-point were grouped into the same group ( Fig. 2 ).
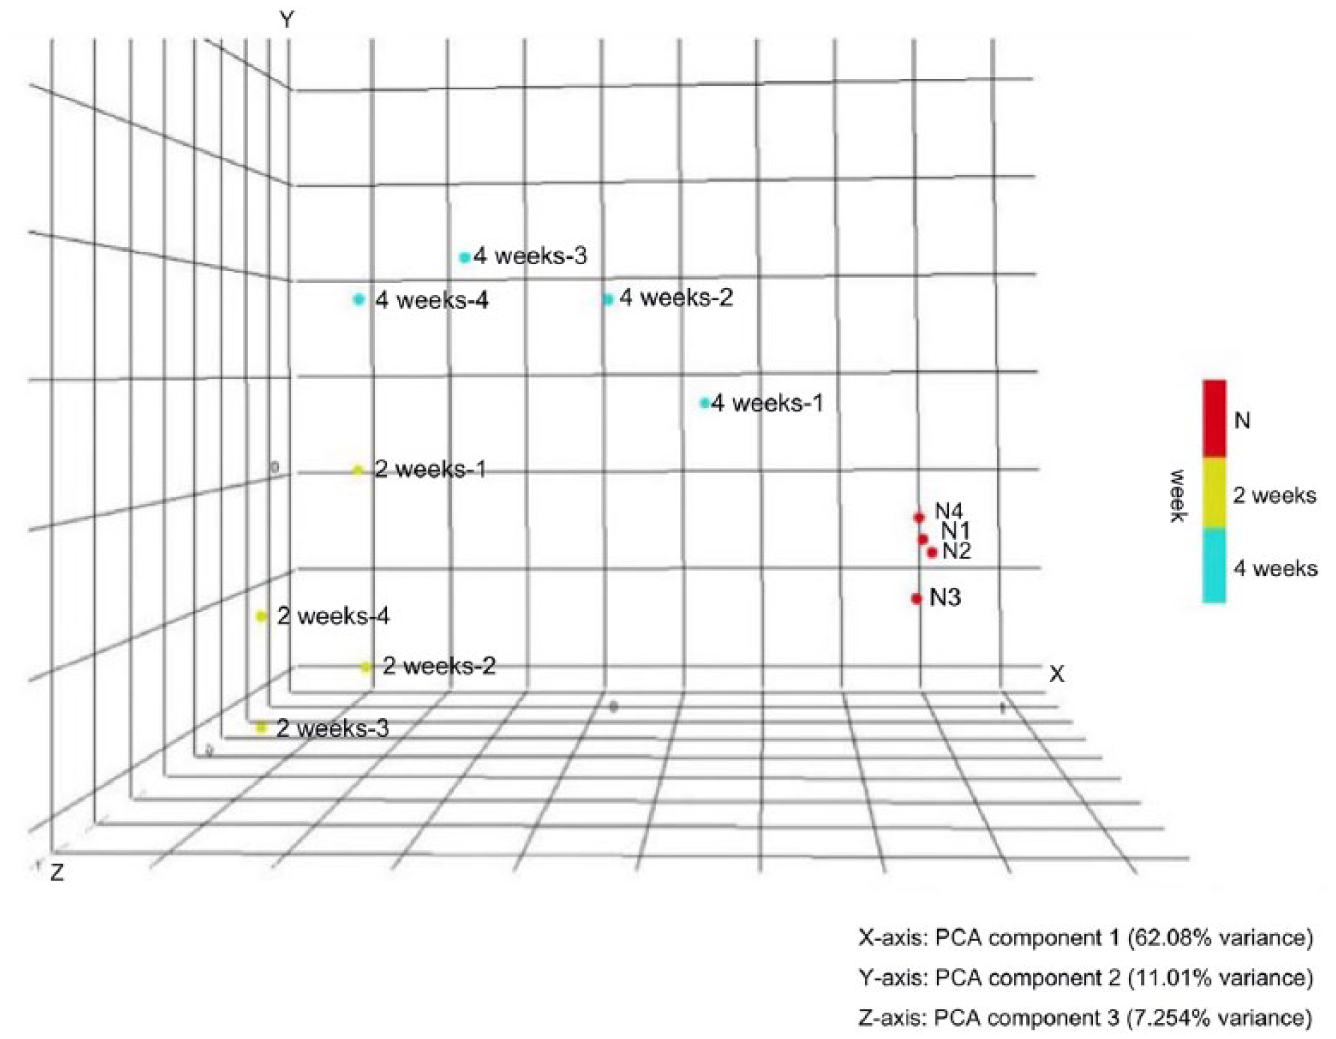
Principal component analysis plot of 12 microarray samples. All the 12 samples were clustered into 3 groups by their gene expression patterns which correspond to the time points after anterior cruciate ligament transection and medial meniscectomy (ACLT + MMx) surgery. Relatively uniform distribution of overall gene expression among the samples in each group. Each dot represent one microarray sample. Red dot represent to naïve (time zero) group: labeled as N1 to N4. Green dot represent to 2 weeks post–ACLT + MMx group: labeled as 2weeks-1 to 2weeks-4. Blue dot represent to 4 weeks post–ACLT + MMx group: labeled as 4weeks-1 to 4weeks-4.
By using the LIMMA method (selection criteria: FDR < 0.05), the gene expression analysis of the articular cartilage identified 849 DEGs in the 2 weeks post–ACLT + MMx group compared to naïve group. Of these genes, 373 were upregulated, and 476 were downregulated (Supplementary Table S1, available online) In the 4 weeks post–ACLT + MMx group, 223 genes differentially expressed compared to naïve group: 75 upregulated and 148 downregulated (Supplementary Table S2).
After comparing the DEGs in 2 weeks and 4 weeks post–ACLT + MMx groups, 114 DEGs overlapped. Interestingly, all these overlapping DEGs in both groups were regulated in the same direction. Of these 114 genes, 40 DEGs were significantly upregulated, and 74 DEGs were significantly downregulated in both groups. Top 5 upregulated overlapping DEGs were Tnn, Gap43, Col5a3, Lrrc17, and Fam46b (ranked by fold changes of 2 weeks post–ACLT + MMx group). Top 5 downregulated overlapping DEGs were Phex, Calcr, Rhpn2, Gsta4, and Ppp1r3b (ranked by fold changes of 2 weeks post–ACLT + MMx group). The fold changes and FDR values of these 114 overlapping DE genes in both groups are listed in Supplementary Table S3.
Functional Enrichment Analysis and cDEG Identification
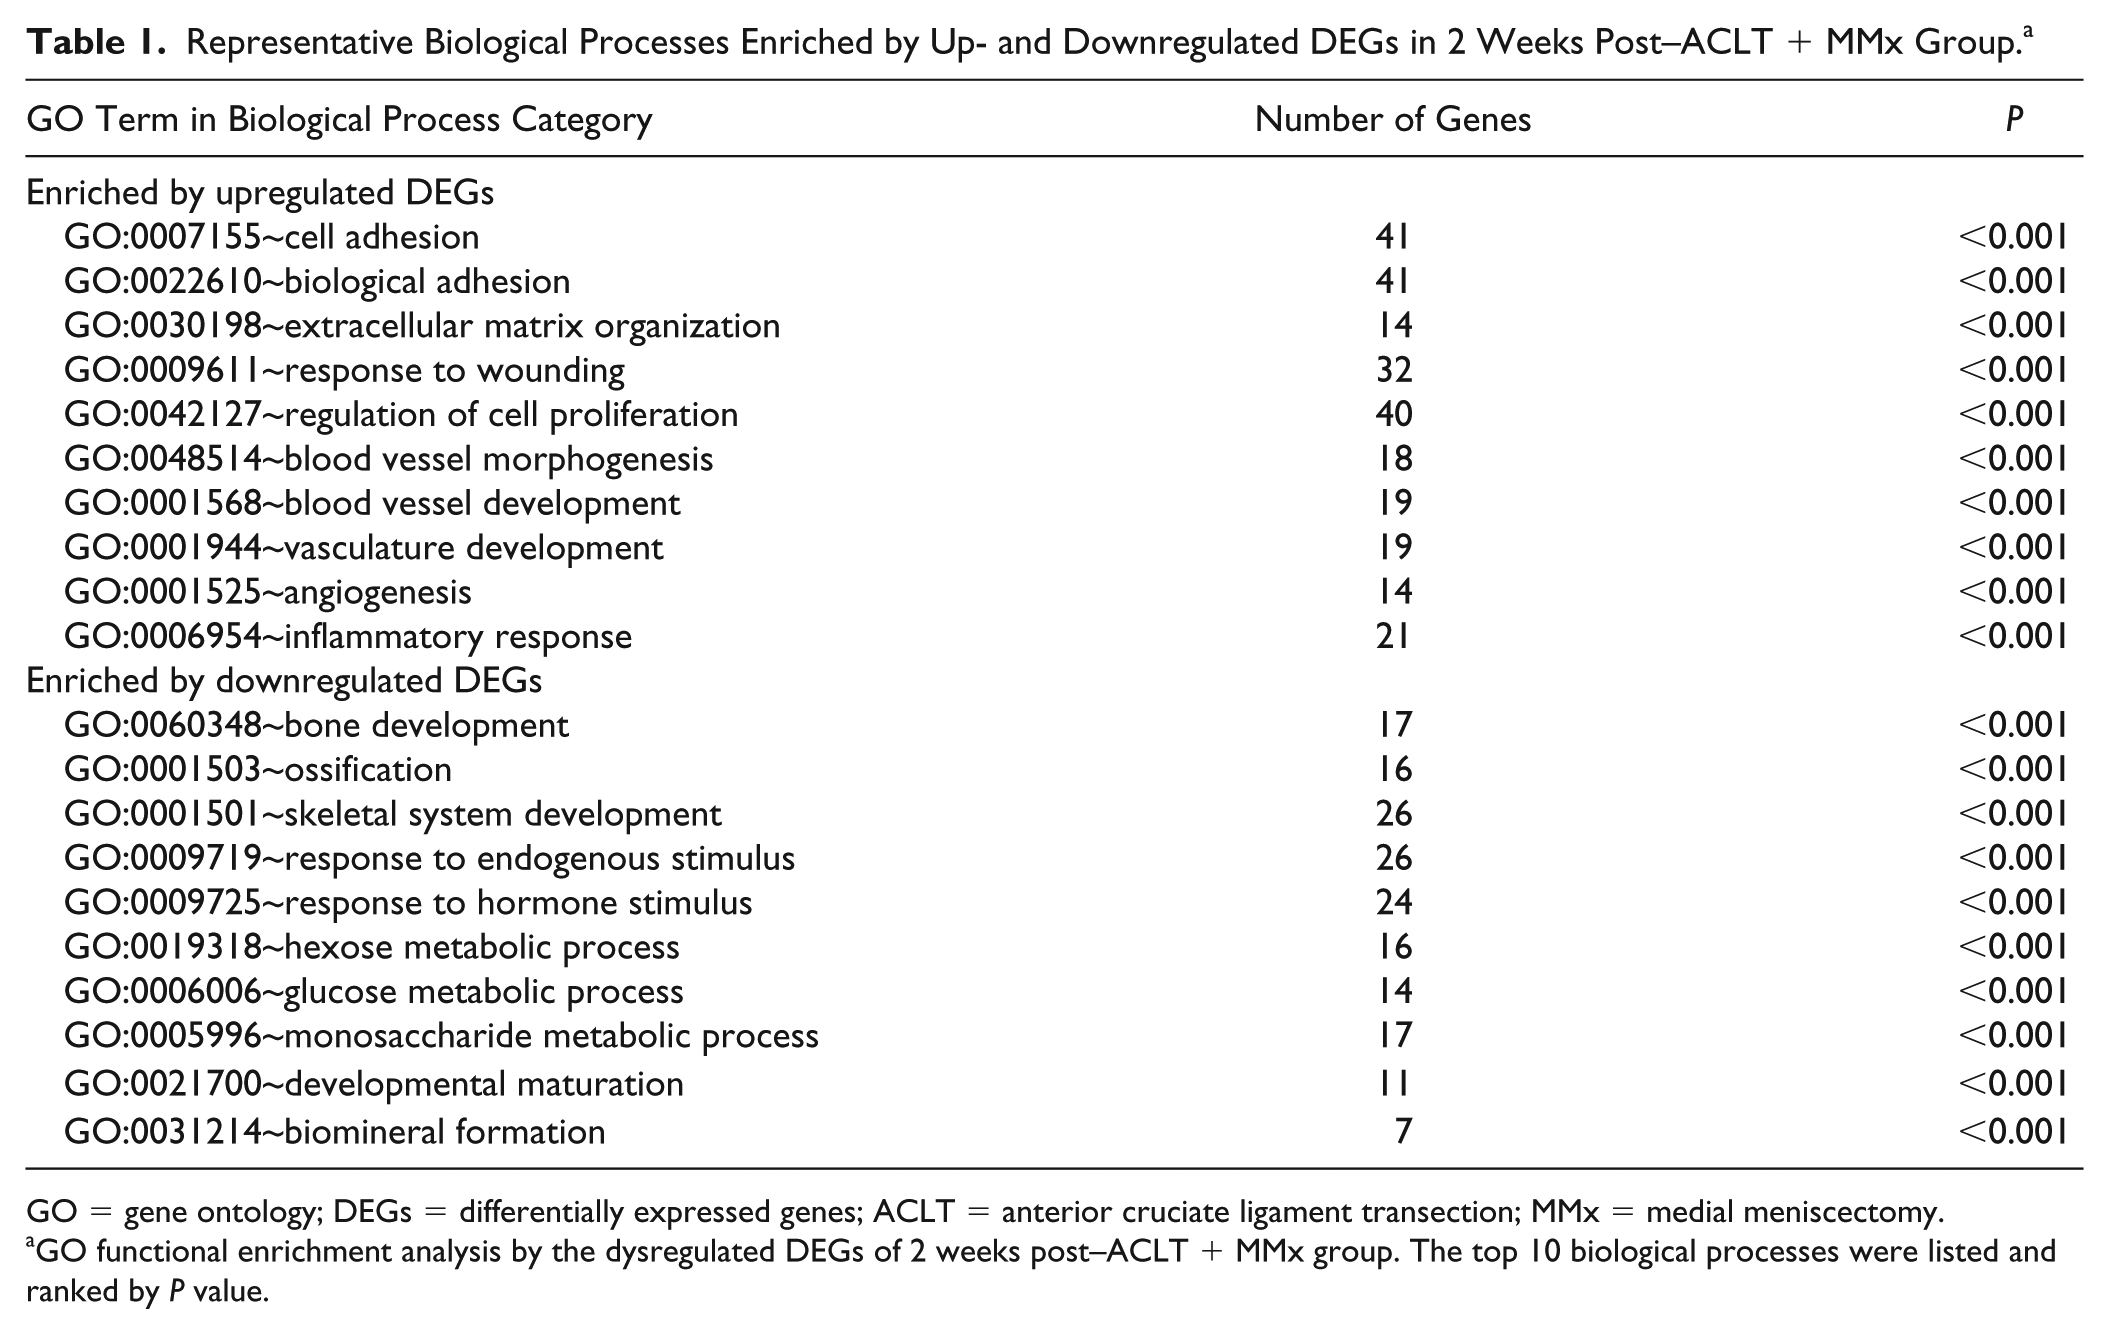
Gene ontology enrichment analyses and KEGG pathway analysis were performed using Rattus norvegicus annotations to obtain more biological information on DE genes. A total of 121 biological processes and 6 KEGG pathways were enriched by the upregulated DEGs, and 94 biological processes and 4 KEGG pathways were enriched by the downregulated DEGs in the 2 weeks post–ACLT + MMx group. The identified representative pathways and biological processes enriched by upregulated DEGs included focal adhesion, extracellular matrix–receptor interaction, cell adhesion, extracellular matrix organization, response to wounding, angiogenesis, and inflammatory response. The identified representative pathways and biological processes enriched by downregulated DEGs included axon guidance, mTOR signaling pathway, bone development, skeletal system development, ossification, hexose metabolic process, glucose metabolic process ( Table 1 ).
Representative Biological Processes Enriched by Up- and Downregulated DEGs in 2 Weeks Post–ACLT + MMx Group. a
GO = gene ontology; DEGs = differentially expressed genes; ACLT = anterior cruciate ligament transection; MMx = medial meniscectomy.
GO functional enrichment analysis by the dysregulated DEGs of 2 weeks post–ACLT + MMx group. The top 10 biological processes were listed and ranked by P value.
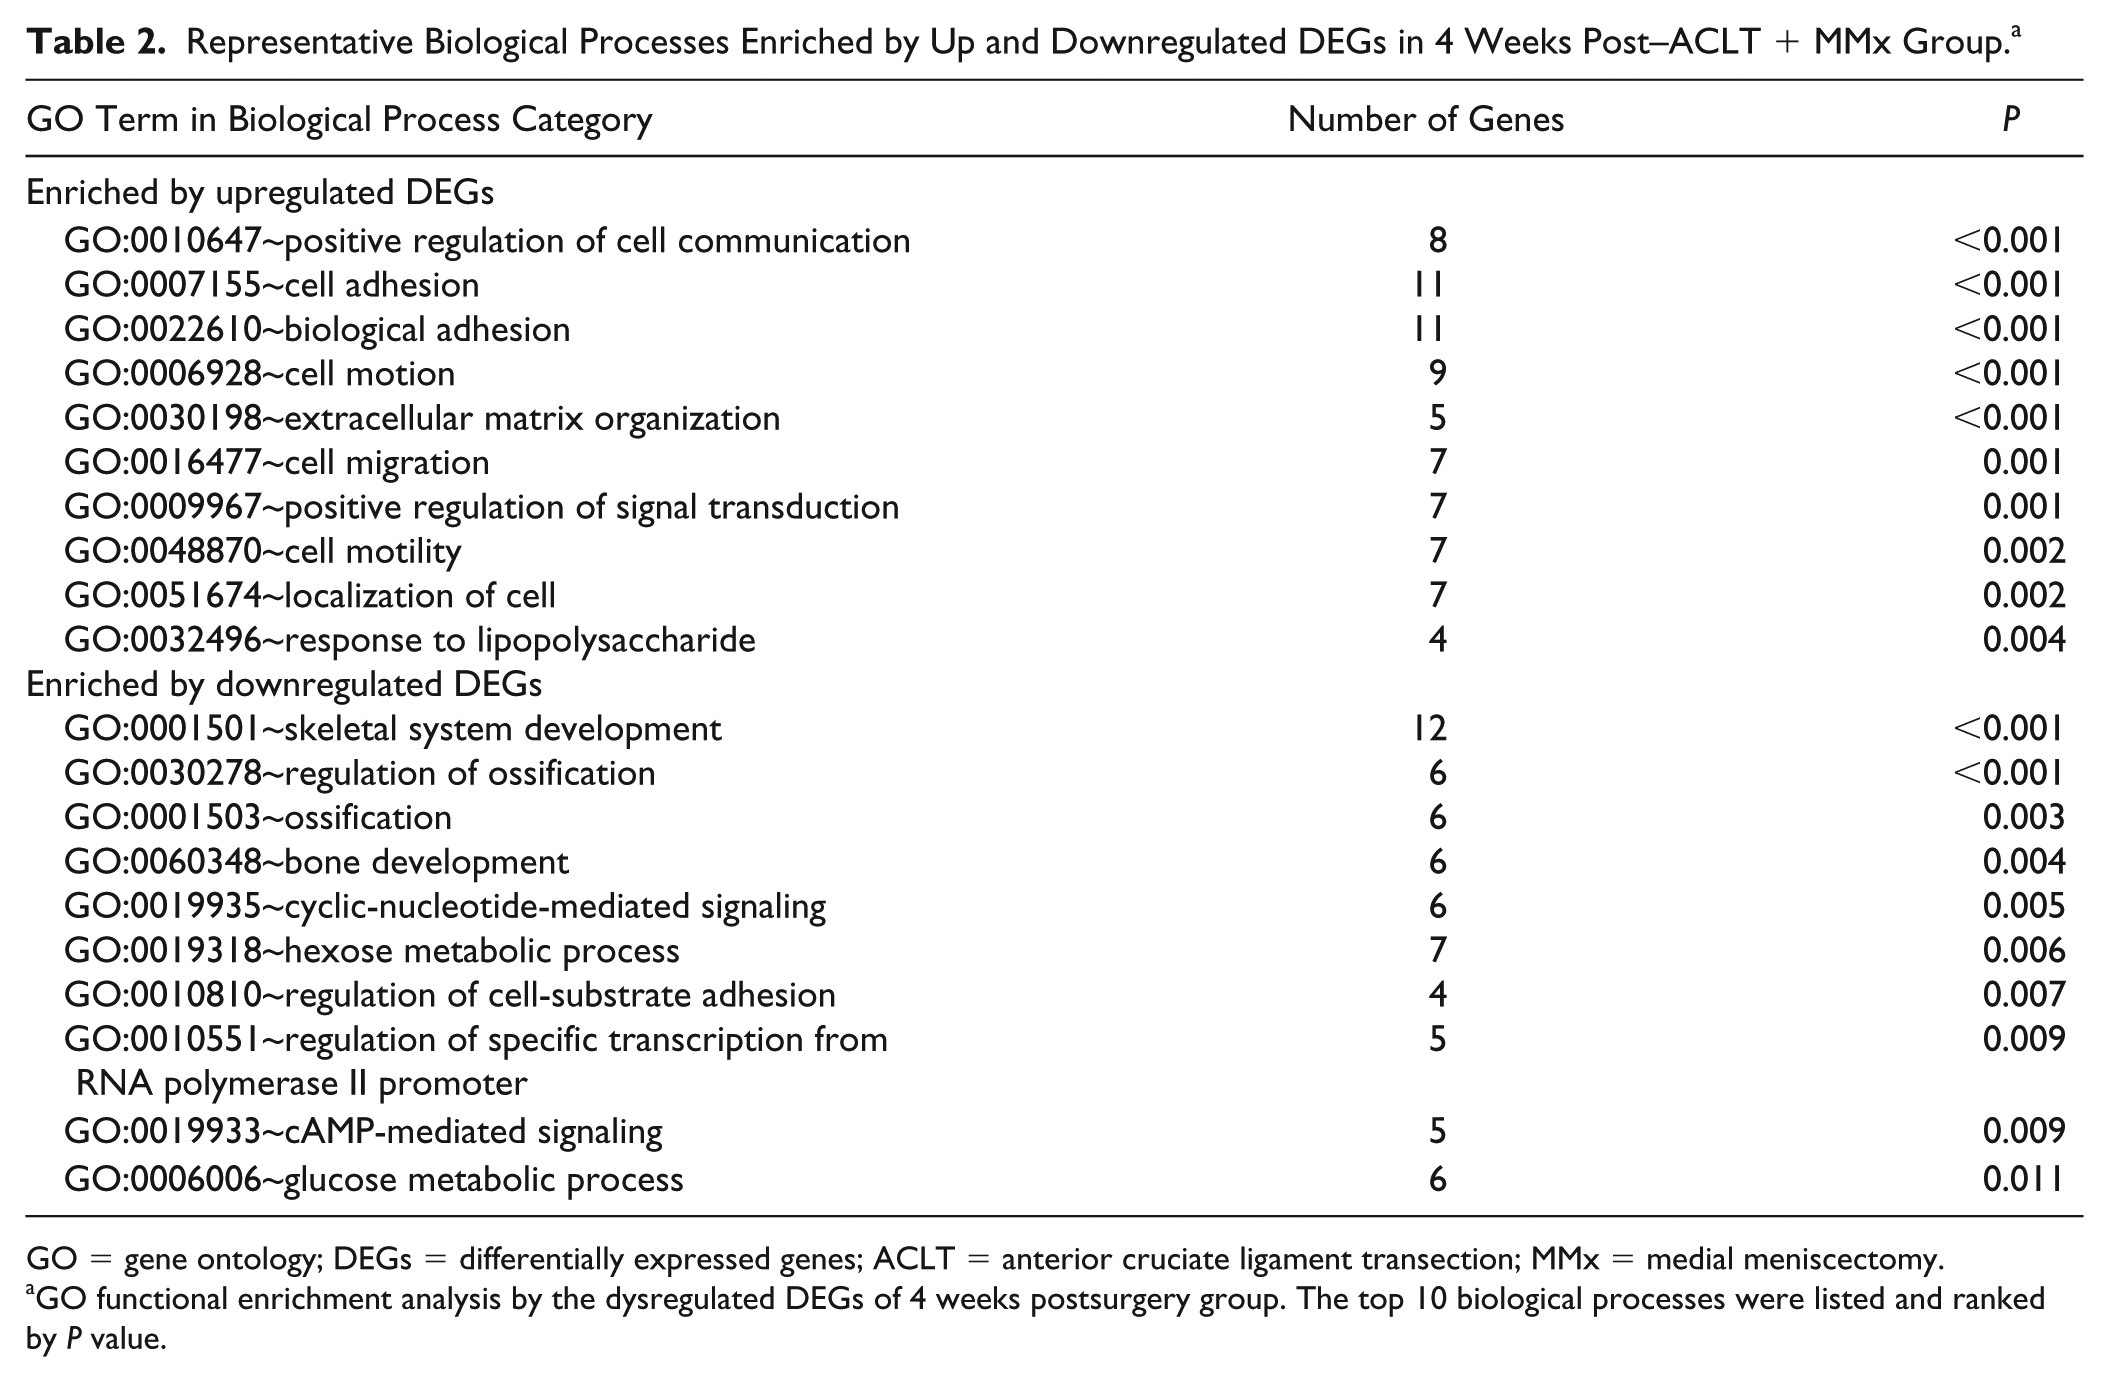
In the 4 weeks post–ACLT + MMx group, 30 biological processes and 1 KEGG pathway were enriched by 75 upregulated DEGs, and 48 biological processes and 2 KEGG pathways were enriched by 148 downregulated DEGs. The identified representative pathways and biological processes enriched by upregulated DEGs included extracellular matrix–receptor interaction, positive regulation of cell communication, cell adhesion, biological adhesion, extracellular matrix organization, response to wounding. The identified representative pathways and biological processes enriched by downregulated DEGs included axon guidance, skeletal system development, regulation of ossification, bone development, hexose metabolic process, glucose metabolic process ( Table 2 ).
Representative Biological Processes Enriched by Up and Downregulated DEGs in 4 Weeks Post–ACLT + MMx Group. a
GO = gene ontology; DEGs = differentially expressed genes; ACLT = anterior cruciate ligament transection; MMx = medial meniscectomy.
GO functional enrichment analysis by the dysregulated DEGs of 4 weeks postsurgery group. The top 10 biological processes were listed and ranked by P value.
We compared the pathways and biological processes in the 2 and 4 weeks post–ACLT + MMx groups to identify the overlapping pathways as well as biological processes, and further identified the common DEGs from the overlapping pathways and biological processes as the consensus DEGs.
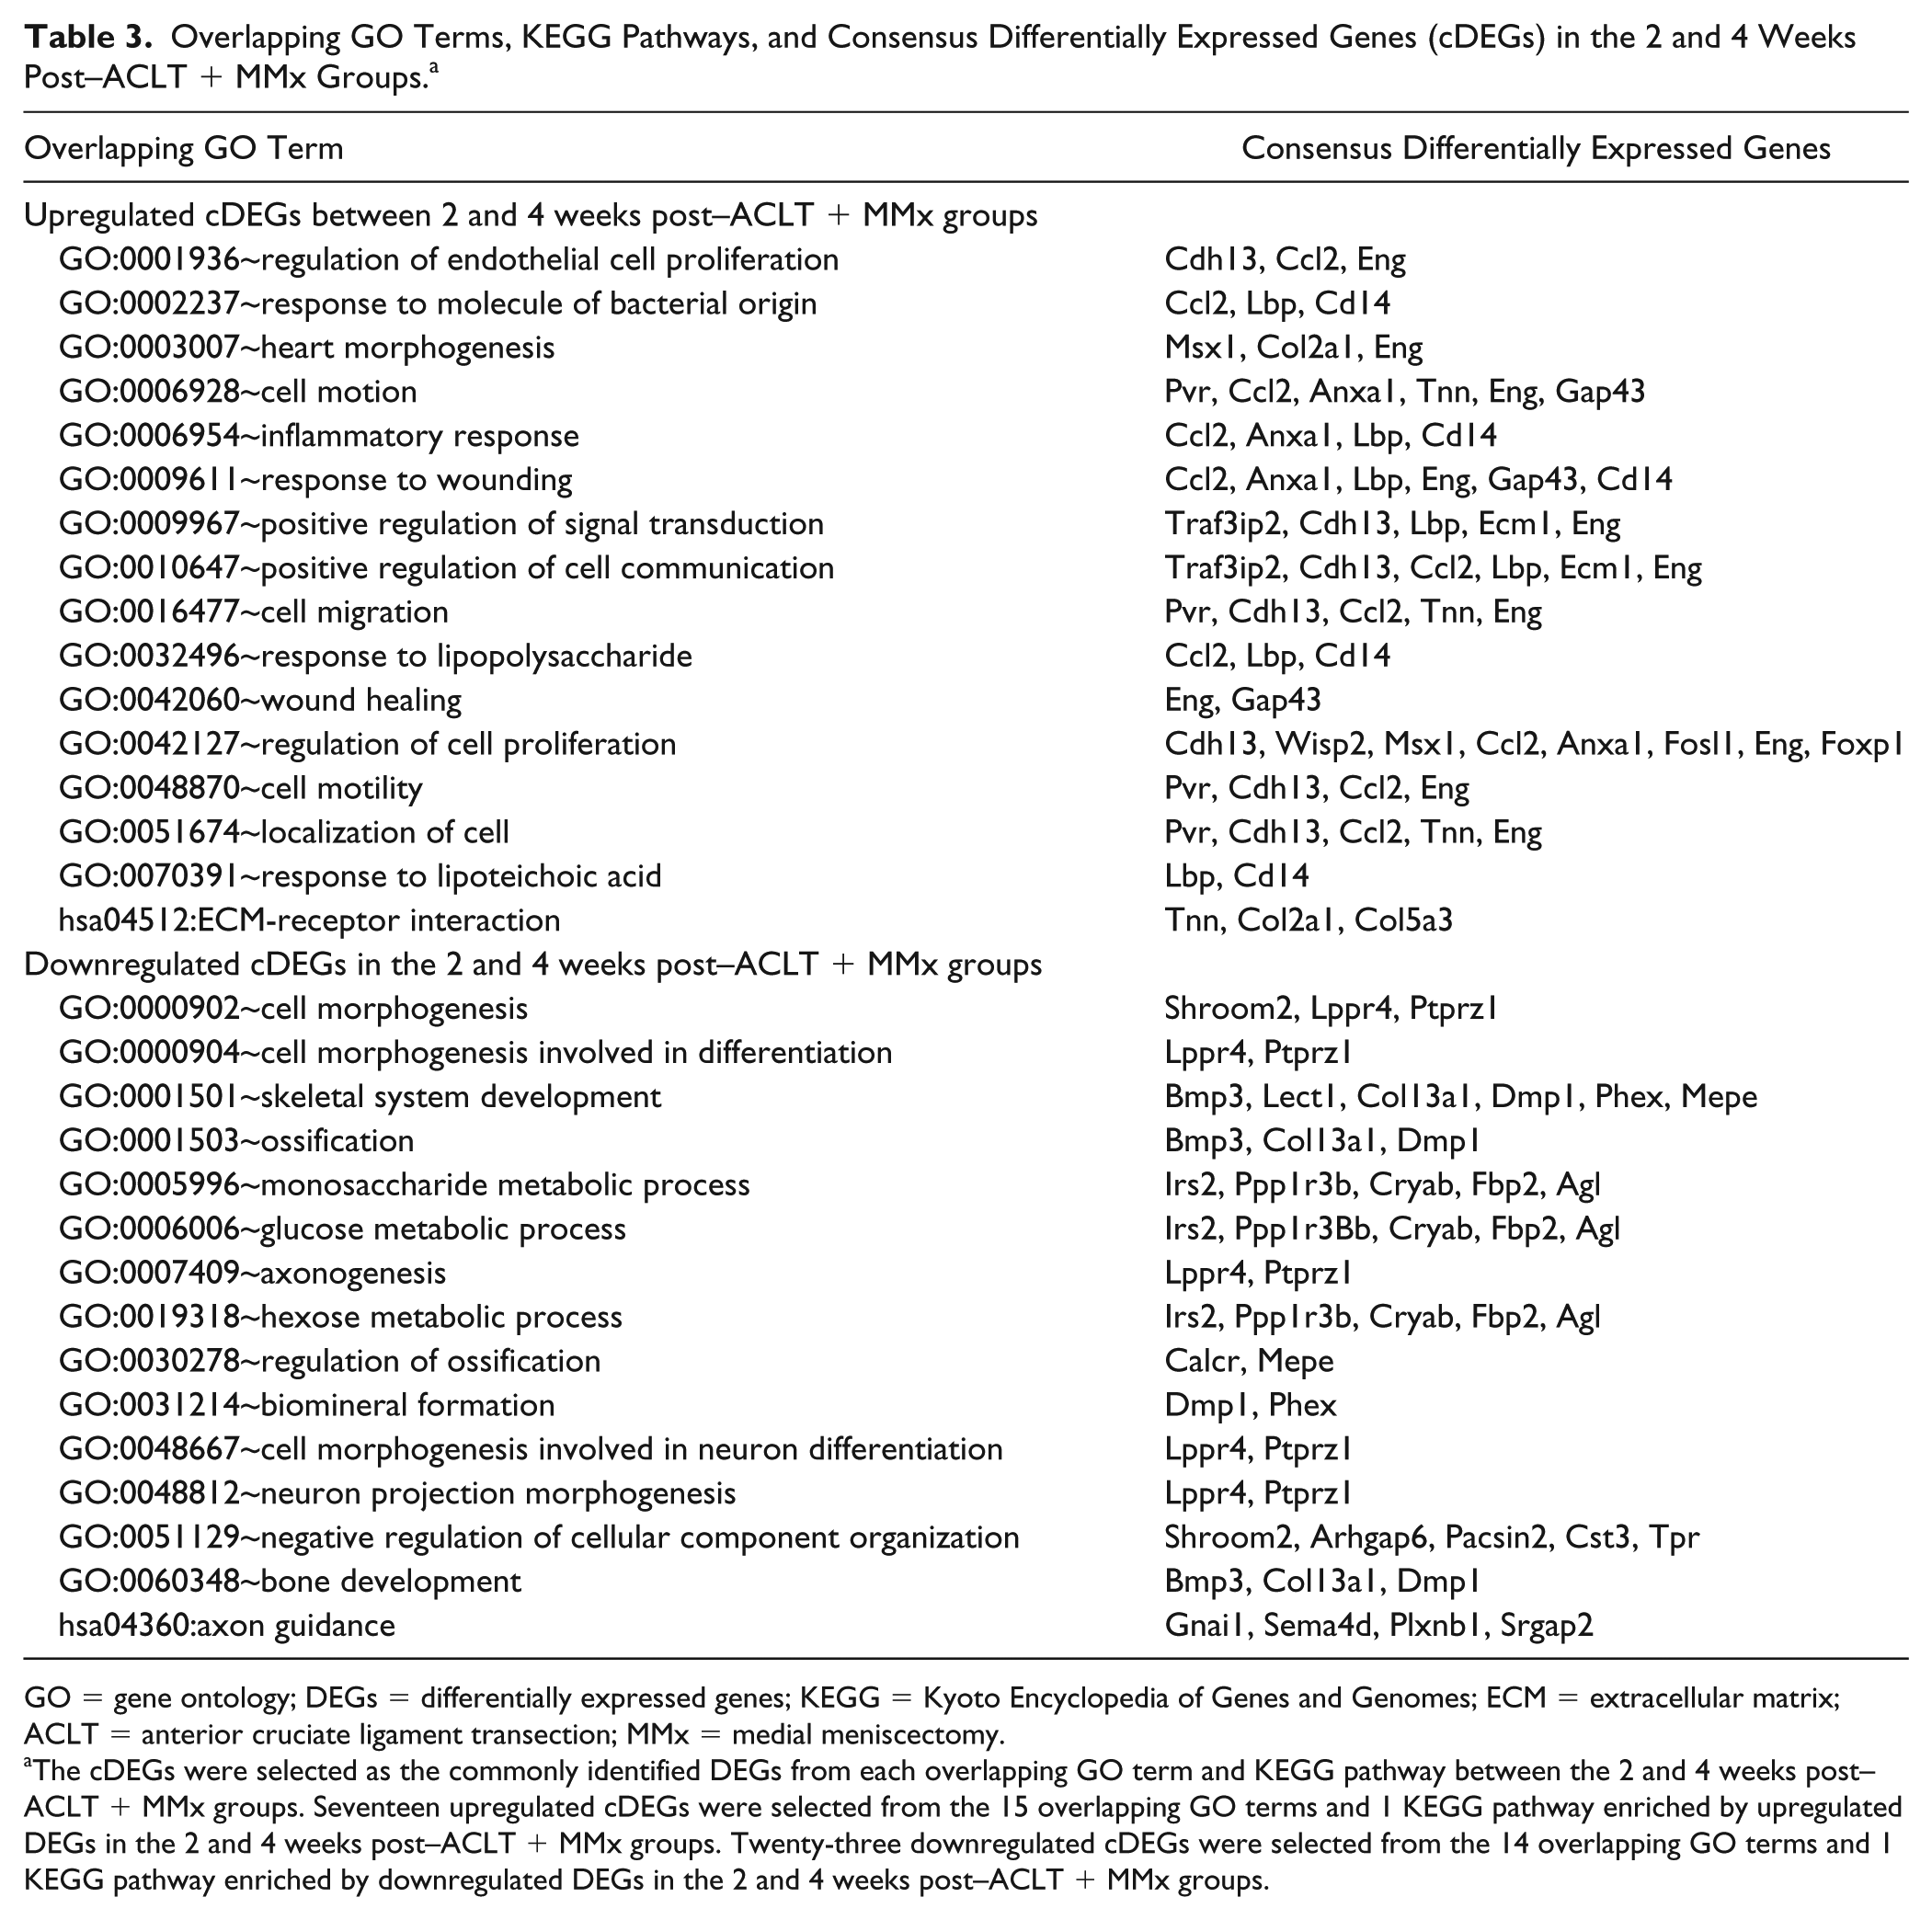
There was one overlapping pathway (extracellular matrix–receptor interaction) and 15 overlapping biological processes (regulation of cell proliferation, regulation of endothelial cell proliferation, positive regulation of cell communication, response to wounding, etc.) enriched by upregulated DEGs in both 2 weeks and 4 weeks postsurgery groups. Axon guidance pathway and 14 biological processes (skeletal system development, ossification, bone development, axonogenesis, neuron projection morphogenesis, etc.) enriched by downregulated DE genes were identified in both 2 weeks and 4 weeks post–surgery groups ( Table 3 ).
Overlapping GO Terms, KEGG Pathways, and Consensus Differentially Expressed Genes (cDEGs) in the 2 and 4 Weeks Post–ACLT + MMx Groups. a
GO = gene ontology; DEGs = differentially expressed genes; KEGG = Kyoto Encyclopedia of Genes and Genomes; ECM = extracellular matrix; ACLT = anterior cruciate ligament transection; MMx = medial meniscectomy.
The cDEGs were selected as the commonly identified DEGs from each overlapping GO term and KEGG pathway between the 2 and 4 weeks post–ACLT + MMx groups. Seventeen upregulated cDEGs were selected from the 15 overlapping GO terms and 1 KEGG pathway enriched by upregulated DEGs in the 2 and 4 weeks post–ACLT + MMx groups. Twenty-three downregulated cDEGs were selected from the 14 overlapping GO terms and 1 KEGG pathway enriched by downregulated DEGs in the 2 and 4 weeks post–ACLT + MMx groups.
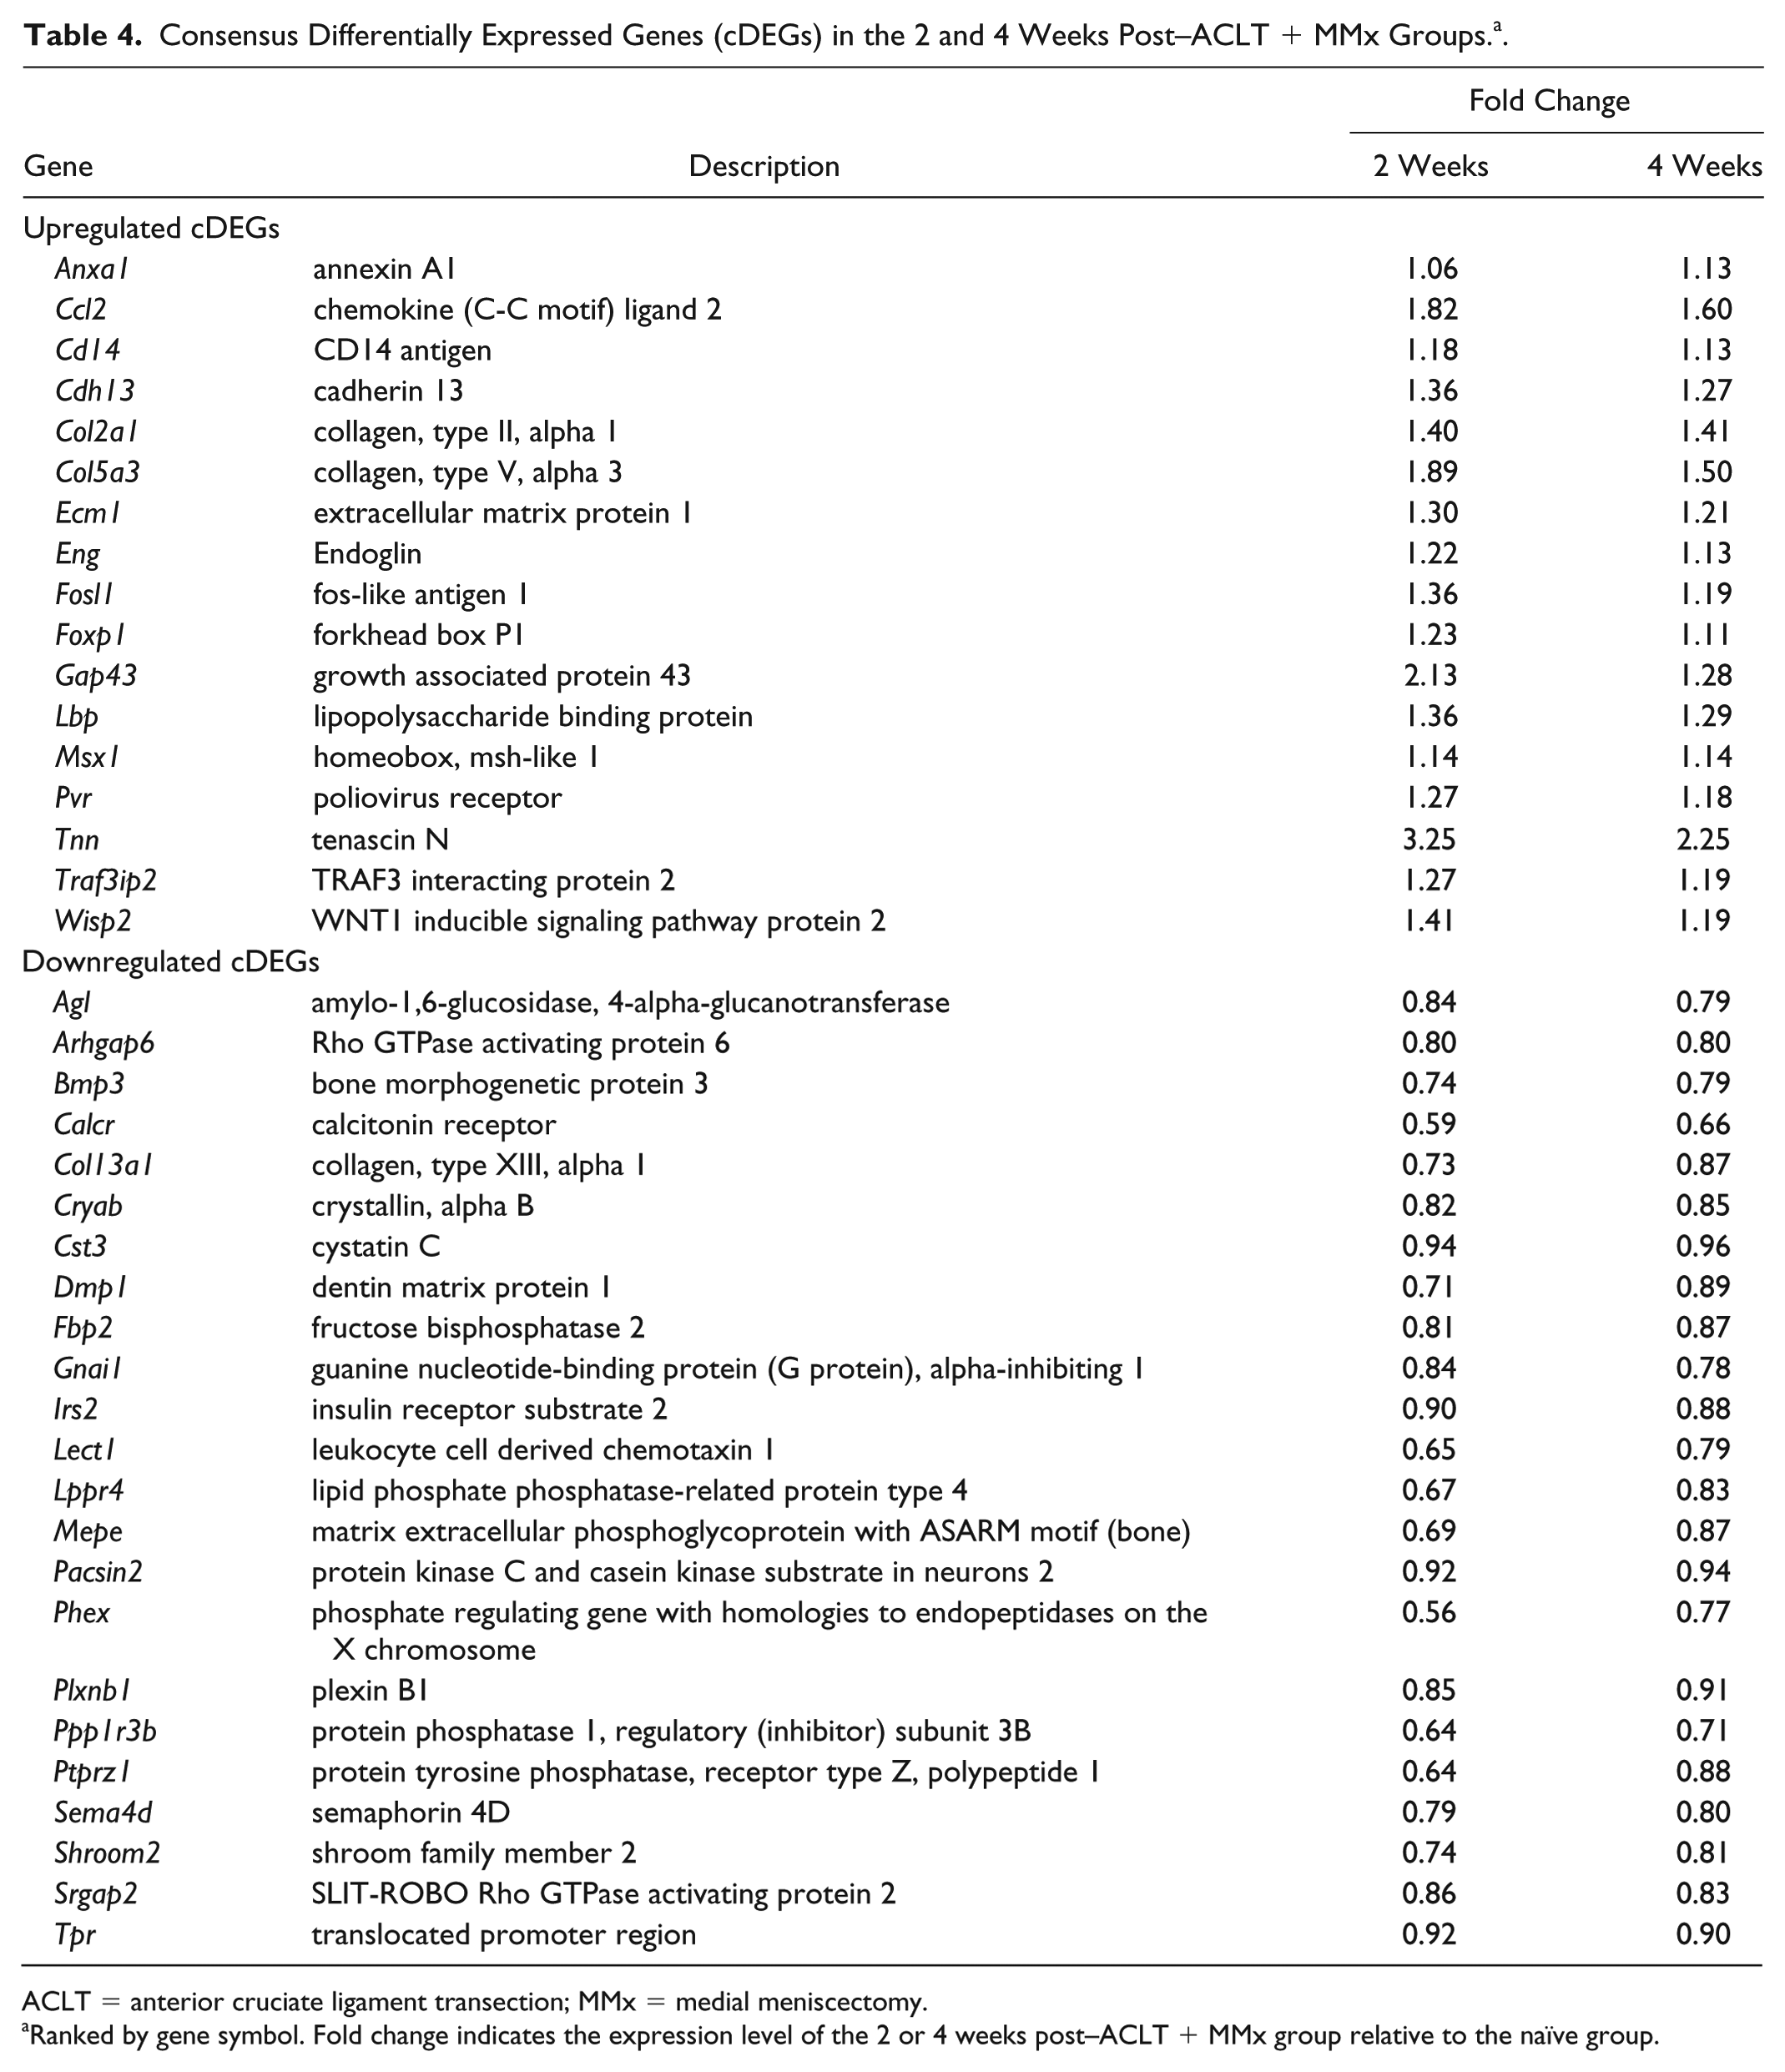
A total of 40 cDEGs were identified as the common DE genes from the overlapping pathways and biological processes ( Fig. 3 ). Seventeen cDEGs were consistently upregulated in both 2 and 4 weeks post–ACLT + MMx groups: Anxa1, Ccl2, Cd14, Cdh13, Col2a1, Col5a3, Ecm1, Eng, Fosl1, Foxp1, Gap43, Lbp, Msx1, Pvr, Tnn, Traf3ip2, and Wisp2. Twenty-three cDEGs were consistently downregulated, including Agl, Arhgap6, Bmp3, Calcr, Col13a1, Cryab, Cst3, Dmp1, Fbp2, Gnai1, Irs2, Lect1, Lppr4, Mepe, Pacsin2, Phex, Plxnb1, Ppp1r3b, Ptprz1, Sema4d, Shroom2, Srgap2, and Tpr ( Table 4 ).
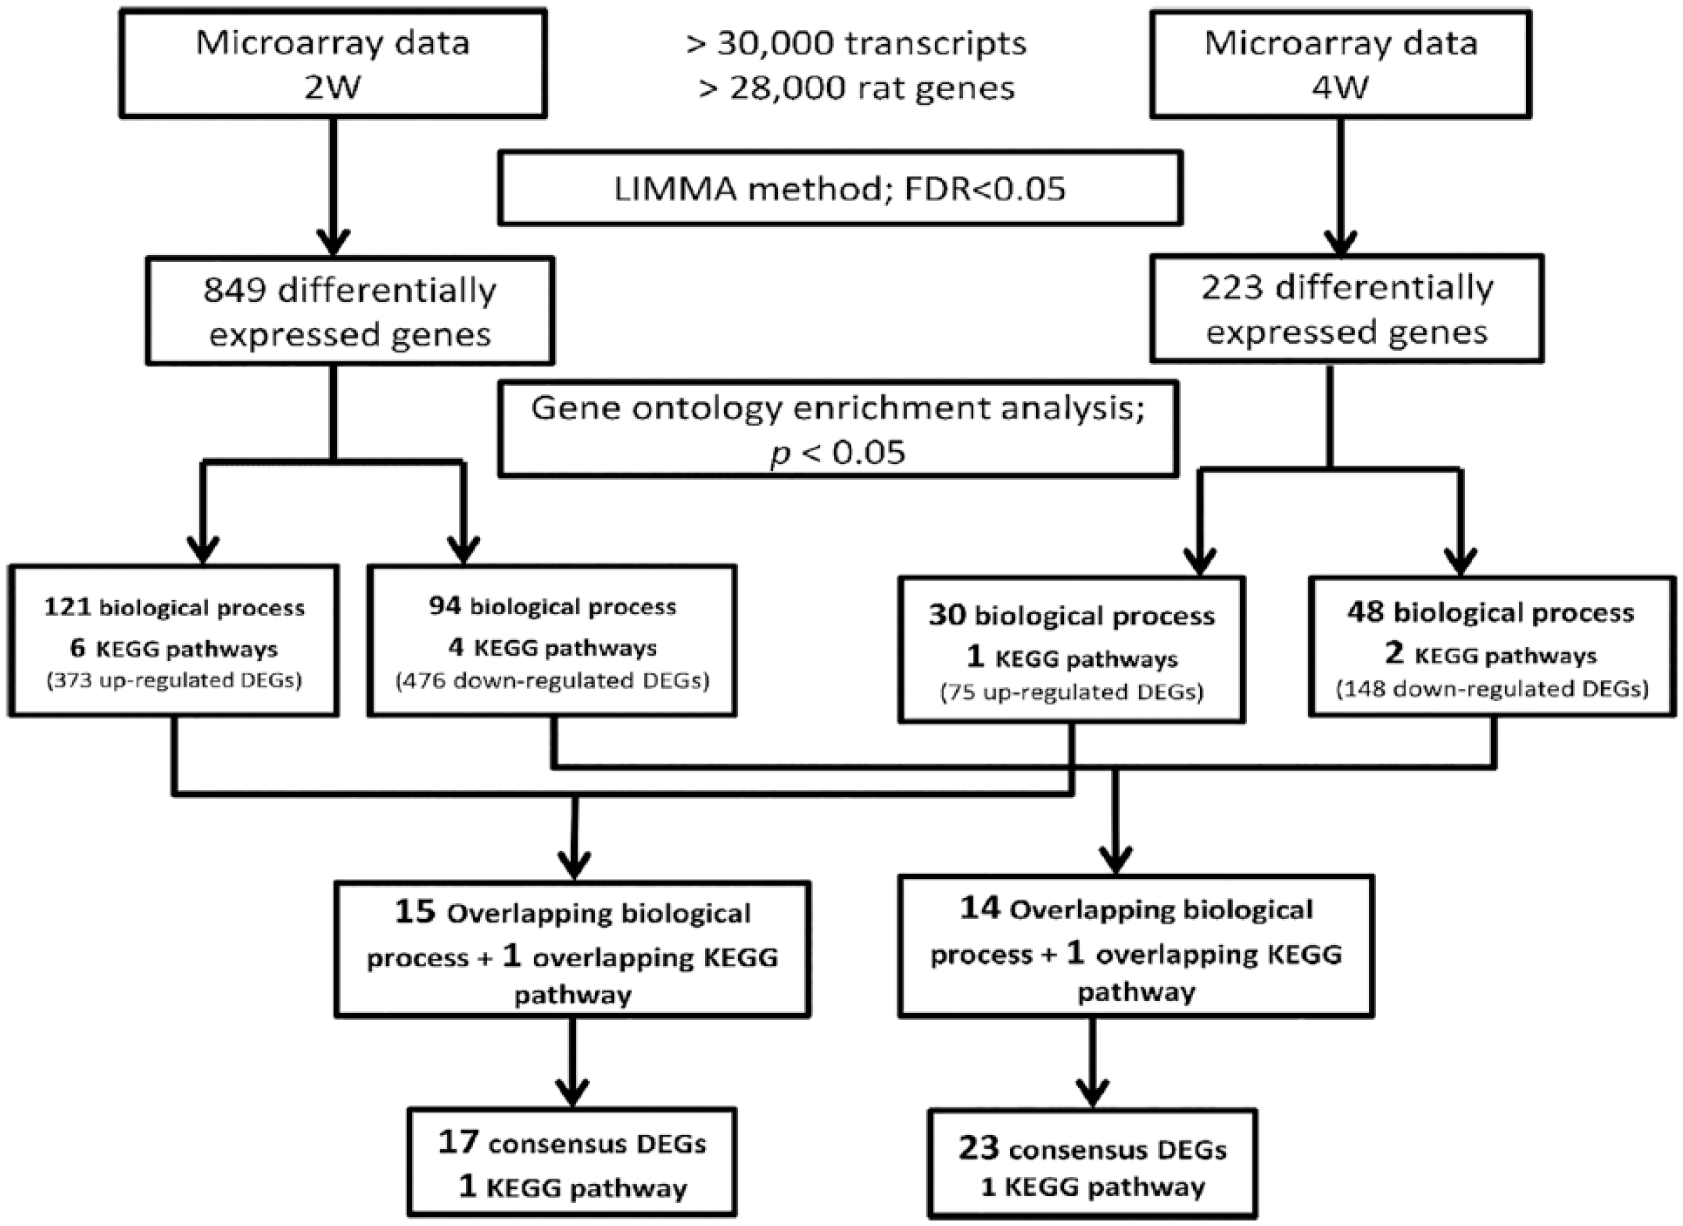
Flowchart of microarray data analysis. The rat genome 230 2.0 array comprises more than 28,000 well-substantiated genes. The LIMMA method with FDR < 0.05 was applied to identify the DEGs from the microarray data of both 2 and 4 weeks post–ACLT + MMx groups. Seventeen upregulated consensus DEGs (cDEGs), 23 downregulated cDEGs, and 2 KEGG pathways were identified. LIMMA, linear models for microarray data; FDR, false discovery rate; DEG, differentially expressed gene; ACLT, anterior cruciate ligament transection; MMx, medial meniscectomy; KEGG, Kyoto Encyclopedia of Genes and Genomes; 2W, 2 weeks post–ACLT + MMx group; 4W, 4 weeks post–ACLT + MMx group.
Consensus Differentially Expressed Genes (cDEGs) in the 2 and 4 Weeks Post–ACLT + MMx Groups. a .
ACLT = anterior cruciate ligament transection; MMx = medial meniscectomy.
Ranked by gene symbol. Fold change indicates the expression level of the 2 or 4 weeks post–ACLT + MMx group relative to the naïve group.
Validation by References and Immunohistochemical Staining
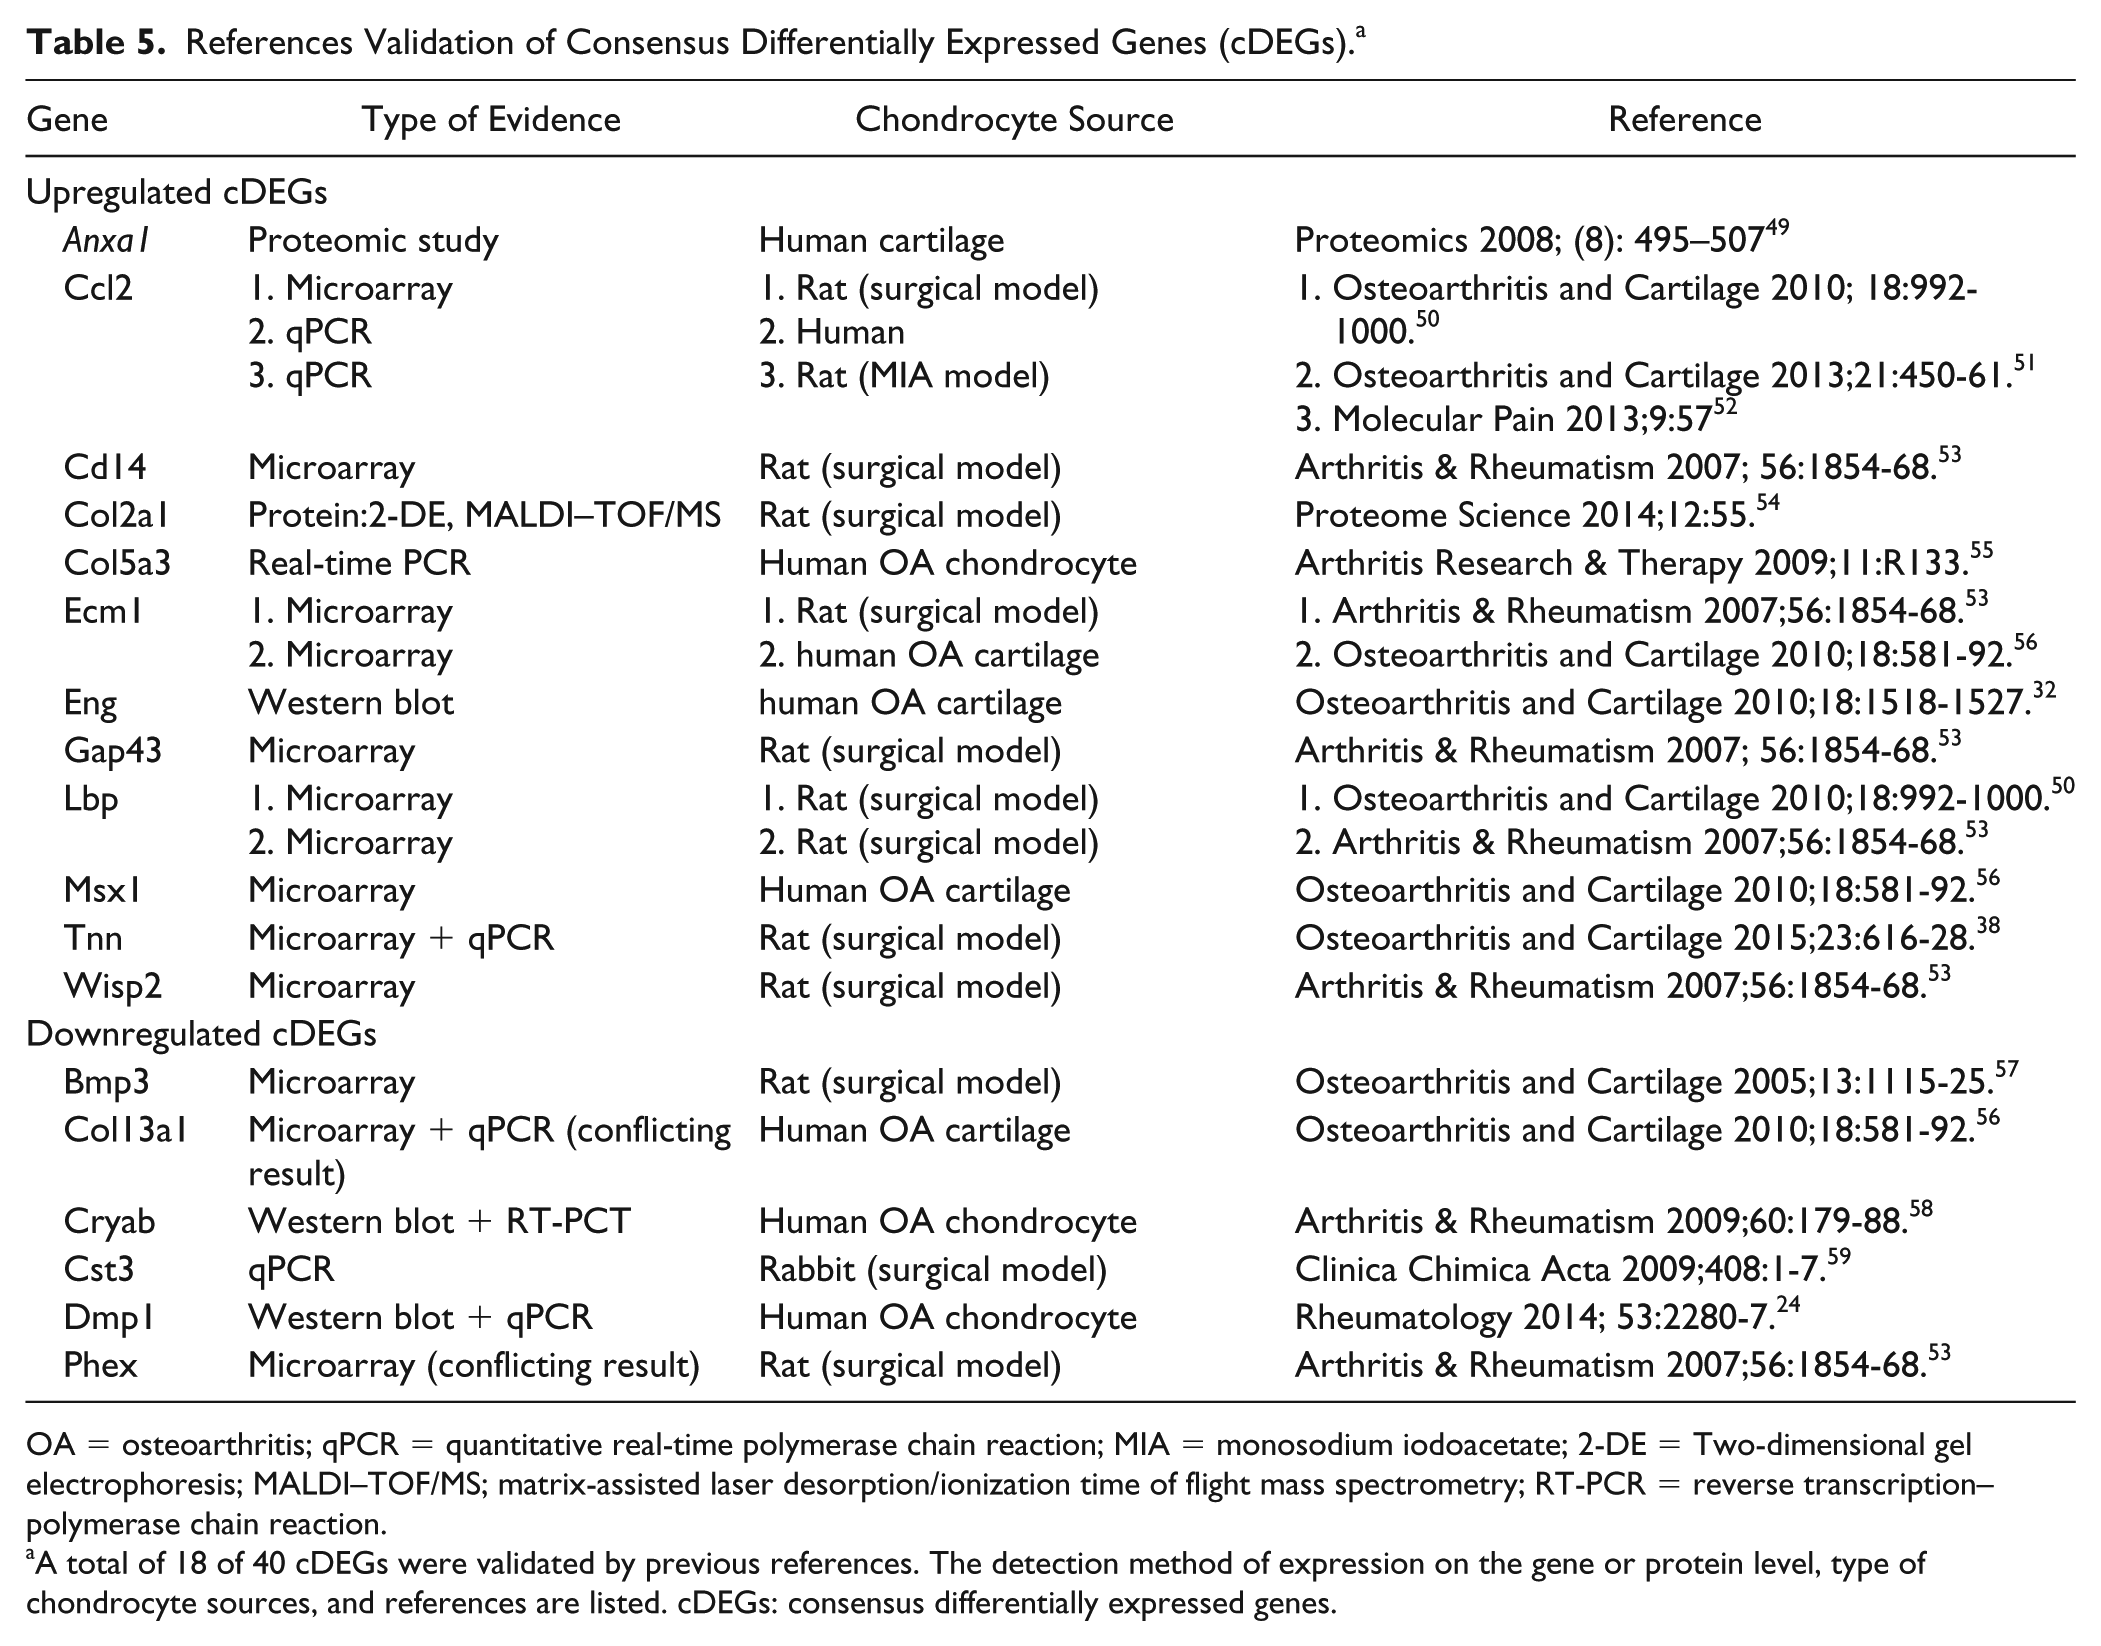
Among the 40 cDEGs, 18 genes had been reported to express in osteoarthritic cartilage or chondrocytes, and 16 of them were regulated in the same direction in literature, which were consistent to our findings ( Table 5 ). The other 22 cDEGs—Cdh13, Fosl1, Foxp1, Pvr, Traf3ip2, Agl, Arhgap6, Calcr, Fbp2, Gnai1, Irs2, Lect1, Lppr4, Mepe, Pacsin2, Plxnb1, PPP1r3b, Ptprz1, Sema4d, Shroom2, Srgap 2, and Tpr were identified as novel genes dysregulated in osteoarthritic cartilage. Cdh13, Fosl1, Foxp1, Pvr, Traf3ip2 genes were upregulated and the other 17 genes were downregulated in PTOA progression.
References Validation of Consensus Differentially Expressed Genes (cDEGs). a
OA = osteoarthritis; qPCR = quantitative real-time polymerase chain reaction; MIA = monosodium iodoacetate; 2-DE = Two-dimensional gel electrophoresis; MALDI–TOF/MS; matrix-assisted laser desorption/ionization time of flight mass spectrometry; RT-PCR = reverse transcription–polymerase chain reaction.
A total of 18 of 40 cDEGs were validated by previous references. The detection method of expression on the gene or protein level, type of chondrocyte sources, and references are listed. cDEGs: consensus differentially expressed genes.
We selected Gnai1 as the target gene for validation. Our microarray data revealed that Gnai1 was consistently downregulated in both 2 and 4 weeks post–ACLT + MMx groups. To verify this finding at the protein level, immunohistochemical staining was performed to determine the expression level of Gnai1. The results revealed that Gnai1 protein was significantly stained within chondrocytes in the naïve group ( Fig. 4 ). The expression level of Gnai1 decreased in both 2 and 4 weeks post–ACLT + MMx groups compared with naïve ( Fig. 4 ). These results corresponded with those of our microarray analysis.
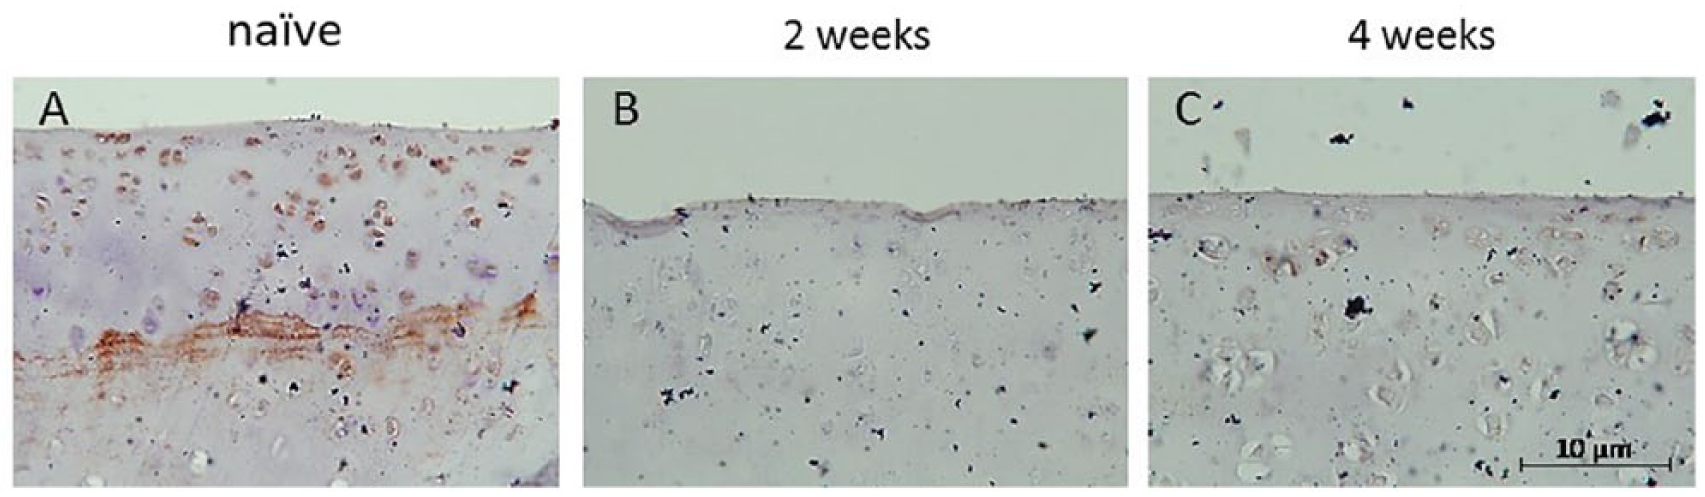
Immunohistochemical stain for Gnai1 on normal and osteoarthritis cartilage. The antibody against Gnai1 was used to assess the spatial and temporal expression of Gnai1 (brown precipitate). (
Discussion
PTOA refers to a progressive degeneration of the articular cartilage. In human studies, it is impossible to obtain cartilage tissue at multiple time points to study PTOA progression, particularly in the early phase. Animal model of PTOA enables studying the molecular changes in the early phase of PTOA, which cannot be practically studied in humans. In this study, we successfully performed ACLT + MMx on rats to induce a time-dependent progression of PTOA and to study transcriptomic alterations during cartilage degeneration. In our microarray analysis, we identified 29 biological processes, 2 KEGG pathways, and 22 novel DEGs continuously dysregulated in early PTOA progression. In addition, the expression of Gnai1 protein decreased in the degenerative articular cartilage of PTOA. To the best of our knowledge, we are the first to demonstrate the presence of Gnai1 protein within chondrocytes of normal articular cartilage on rats PTOA model.
Homeostasis of extracellular matrix in articular cartilage was disrupted during progression of osteoarthritis. Increased catabolism and impaired regeneration of extracellular matrix leads to cartilage degeneration. Tachmazidou et al. 25 performed a genome-wide association study for human osteoarthritis (77,052 cases and 378,169 controls). They identified putative effector genes by integrating expression quantitative trait loci (eQTL) colocalization, fine-mapping, human rare disease, animal model, and osteoarthritis tissue expression data. They found the enrichment genes for the collagen formation and extracellular matrix organization biological pathways in human osteoarthritis. 25 In our study, KEGG pathway analysis demonstrated extracellular matrix–receptor interaction pathway as the PTOA-related pathway. Tnn, Col2a1, and Col5a3 genes were enriched in extracellular matrix–receptors pathway and significantly upregulated at both time points. These genes and KEGG pathway were identified as OA-related genes and pathway in previous reports which were consistent with our findings. 26
Biological processes relevant to glucose metabolism such as hexose metabolic process, glucose metabolic process, and monosaccharide metabolic process were identified in our study. This is consistent with previous findings from transcriptomic analysis of human hip and knee OA cartilage. 27 Irs2, Ppp1r3b, Cryab, Fbp2, and Agl genes were the consensus DE genes (cDEGs) identified from these biological processes. Takashi et al. 28 conducted the first study to report the genome-wide transcriptome of secondary hip OA chondrocytes and demonstrates new potential OA-related genes. IGFBP7 (insulin like growth factor binding protein 7), one of them, was overexpressed in human OA chondrocytes like other IGFBP family did and this inhibited IGF-1 which promotes cartilage proliferation and differentiation. 28 Irs2 (insulin receptor substrate 2) had been reported to act the downstream of IGF-1 signaling in regulating the chondrocyte defferentiation. 29 Irs2, Ppp1r3b, Cryab, Fbp2, and Agl genes were relevant to glucose metabolism and novel in osteoarthritic cartilage. These findings provide us a new direction to investigate the relation between cartilage degeneration and glucose metabolism.
During osteoarthritis, angiogenesis occurred in all the tissues of joint, including the deep layers of articular cartilage. 30 In our study, several gene ontology terms related to angiogenesis were identified especially in 2 weeks post–ACLT + MMx group such as GO:0048514~blood vessel morphogenesis, GO:0001568~blood vessel development, GO:0001944~vasculature development, and GO:0001525~angiogenesis. Among 40 cDEGs, Eng, Lect1, Dmp1, Cdh13, Fosl1, and Shroom2 genes have been known to be involved in angiogenesis. Eng, Lect1, and Dmp1 had been reported expressed in articular cartilage. Eng encodes a transmembrane glycoprotein, Endoglin, which is a stimulator of angiogenesis and signaling in human chondrocytes.31,32 Lect1 encodes chondromodulin-1 (ChM1), which acts as a repulsive factor of angiogenesis, the ChM1 level decreased in osteoarthritic cartilage, which resulted in neovascularization into rat articular cartilage. 15 Dmp1 encodes dentin matrix protein 1, which inhibits VEGF-induced angiogenesis. 33 Prasadam et al. 24 reported that DMP1 progressively decreased with human OA deterioration; our findings are consistent with these reports. Eng was continuously upregulated in early PTOA progression; in contrast, Lect1 and Dmp1 were downregulated in our rat PTOA model.
Cdh13, Fosl1, and Shroom2 genes are novel findings in the articular cartilage of osteoarthritis of our results. In previous reports, Cdh13 was upregulated in blood vessels in tumors; it promoted tumor neovascularization. 34 Fosl1 was involved in the angiogenesis of mouse placental vascularization and in chondrocyte differentiation. 35 Shroom2 facilitates the formation of contractile networks in endothelial cells, and knockdown Shroom2 leads to increasing of angiogenesis. 36 In our study, Cdh13 and Fosl1 were continuously upregulated and Shroom2 was downregulated during PTOA progression. According the reported functions of these genes in angiogenesis, we believe that these dysregulated genes supposed to work together to promote angiogenesis in early PTOA progression.
Articular cartilage is known as an avascular tissue without nerves. Previous studies demonstrated that neurovascular bundle invaded into calcified articular cartilage from subchondral bone during osteoarthritis progression.30,37 In our data, 2 KEGG pathways were identified from our microarray analysis: extracellular matrix–receptor interaction and axon guidance. The ECM–receptor interaction pathway enriched by upregulated DEGs is consistent with previous report on cartilage degeneration of OA.10,38 However, the axon guidance pathway had never been reported on PTOA progression. Axon guidance is the process of how neuron extended their axons to reach the correct targets. Axon guidance molecules act to repel or attract growth cone in order to direct axonal outgrowth. 39 To the best of our knowledge, no study has addressed the functions of axon guidance pathway in OA cartilage. Sema4d, Plxnb1, Gnai1, and Srgap2 are the cDEGs identified from the axon guidance pathway. Semaphorin 4D (Sema 4D) is an axon guidance protein secreted by oligodendrocytes and induces growth cone collapse to repel the axon growth through its receptor, plexin-b1 (encoded by Plxnb1 gene), in the central nervous system.40,41 Few studies had reported the roles of axon guidance molecules in articular cartilage and OA. Chikako Sumi et al. revealed mRNA expression of Sema3A (one of the semaphorin family) was markedly decreased in chondrocytes under mechanical stress. 42 Lu et al. 43 demonstrated Sema 4D and plexin-b1 expression on the cartilage of the temporomandibular joint in a mouse model of incisor malocclusion. Negishi-Koga et al. 44 reported Sema 4D and plexin-b1 expression in osteoblasts and osteoclasts; those are involved in bone remodeling. Hopwood et al. 45 reported that PLXNB1 was consistently downregulated in the trabecular bone of OA patients. SrGAP2 is a negative regulator of neuronal migration and an enhancer of neurite initiation and branching. Knockdown of srGAP2 accelerates neuronal migration and reduces process complexity and branching of neurites. 46 Gnai1, a guanine nucleotide-binding protein and alpha-inhibiting activity polypeptide 1, adenylate cyclase inhibitor, which inhibits conversion of ATP to cAMP in response to extracellular signals. 47 In the axon growth cone, intracellular cAMP and cGMP levels may affect the axon repulsion or attraction. 48 Therefore, we believed that these axon guidance molecules in articular cartilage play a critical role in nerve ingrowth from osteochondral junction during PTOA. Axon guidance molecules may serve as the repellent agents in the articular cartilage, and downregulation of these molecules, like Sema4d, Plxnb1, Srgap2, and Gnai1, might promote axon growth into the articular cartilage.
There are some limitations in our study. First, we did not apply the fold changes as the threshold on selections of differentially expressed genes. For the most part, the expression fold changes of transcripts in our microarray data are small. To apply the selection criteria of both fold change >1.5 or < 0.67 and FDR <0.05, 64 DEGs in 2 weeks post–ACLT + MMx surgery group and only 6 DEGs in 4 weeks post–ACLT + MMx group were identified (Supplementary Tables S4 and S5) After considering the pros and cons, we decided to use the single selection threshold as FDR < 0.05 for DE genes identifications to gain more biologically relevant information. Second, we apply the overlapping biological processes by GO analysis as the subsequent strategy in narrowing down the target gene list. The hypothetical rationale is that some biological functions (and genes) were activated early and continuously after joint injury, and these genes were potential to involve in the progression of PTOA. Generally speaking, the GO analyses were usually used in describing the identified DEG data, but we use it as the screen tool to identify the cDEGs. That is, we try to identify the DEGs from the annotated functions that are continuously activated in the progression of PTOA. However, this method raised the risks of information loss from the DEGs not annotated yet. Third, the validation of our microarray data is neither by Western blot nor by RT-PCR. Although we carefully validate the result genes by immunohistochemical stain and by verifying the chondrocyte source (human, rat, or rabbit cartilage), as well as platforms/methods used, expression on gene level or protein level from previous reports. The future work of biological validation (by knocking down or knockout genes) should still be considered to validate these novel genes functions in the progression of PTOA.
In this study, we used microarray analysis to study the transcriptomic changes of articular cartilage in rat PTOA progression. Twenty-two genes and axon guidance pathway were novel findings which provide a new insights and potential directions of further investigation in PTOA.
Supplemental Material
Table_S1 – Supplemental material for Transcriptome Analysis Reveals Novel Genes Associated with Cartilage Degeneration in Posttraumatic Osteoarthritis Progression
Supplemental material, Table_S1 for Transcriptome Analysis Reveals Novel Genes Associated with Cartilage Degeneration in Posttraumatic Osteoarthritis Progression by Chih-Chung Liu, Hoong-Chien Lee, Yi-Shian Peng, Ailun Heather Tseng, Jia-Lin Wu, Wei-Yuan Tsai, Chih-Shung Wong and Li-Jen Su in CARTILAGE
Supplemental Material
Table_S2 – Supplemental material for Transcriptome Analysis Reveals Novel Genes Associated with Cartilage Degeneration in Posttraumatic Osteoarthritis Progression
Supplemental material, Table_S2 for Transcriptome Analysis Reveals Novel Genes Associated with Cartilage Degeneration in Posttraumatic Osteoarthritis Progression by Chih-Chung Liu, Hoong-Chien Lee, Yi-Shian Peng, Ailun Heather Tseng, Jia-Lin Wu, Wei-Yuan Tsai, Chih-Shung Wong and Li-Jen Su in CARTILAGE
Supplemental Material
Table_S3 – Supplemental material for Transcriptome Analysis Reveals Novel Genes Associated with Cartilage Degeneration in Posttraumatic Osteoarthritis Progression
Supplemental material, Table_S3 for Transcriptome Analysis Reveals Novel Genes Associated with Cartilage Degeneration in Posttraumatic Osteoarthritis Progression by Chih-Chung Liu, Hoong-Chien Lee, Yi-Shian Peng, Ailun Heather Tseng, Jia-Lin Wu, Wei-Yuan Tsai, Chih-Shung Wong and Li-Jen Su in CARTILAGE
Supplemental Material
Table_S4 – Supplemental material for Transcriptome Analysis Reveals Novel Genes Associated with Cartilage Degeneration in Posttraumatic Osteoarthritis Progression
Supplemental material, Table_S4 for Transcriptome Analysis Reveals Novel Genes Associated with Cartilage Degeneration in Posttraumatic Osteoarthritis Progression by Chih-Chung Liu, Hoong-Chien Lee, Yi-Shian Peng, Ailun Heather Tseng, Jia-Lin Wu, Wei-Yuan Tsai, Chih-Shung Wong and Li-Jen Su in CARTILAGE
Supplemental Material
Table_S5 – Supplemental material for Transcriptome Analysis Reveals Novel Genes Associated with Cartilage Degeneration in Posttraumatic Osteoarthritis Progression
Supplemental material, Table_S5 for Transcriptome Analysis Reveals Novel Genes Associated with Cartilage Degeneration in Posttraumatic Osteoarthritis Progression by Chih-Chung Liu, Hoong-Chien Lee, Yi-Shian Peng, Ailun Heather Tseng, Jia-Lin Wu, Wei-Yuan Tsai, Chih-Shung Wong and Li-Jen Su in CARTILAGE
Footnotes
Acknowledgments and Funding
The authors thank the Core Facilities for High Throughput Experimental Analysis of the Institute of Systems Biology and Bioinformatics, National Central University, Taiwan for the technical support provided in this study. The Core Facilities for High Throughput Experimental Analysis are supported by the Aim for the Top University Project of the Ministry of Education, Taiwan. The author(s) disclosed receipt of the following financial support for the research, authorship, and/or publication of this article: This study was supported by grants NSC-100-2314-B-281-003 from the National Science Council, Taiwan, and 101CGH-NCU-B4 from Cathay General Hospital and National Central University.
Declaration of Conflicting Interests
The author(s) declared no potential conflicts of interest with respect to the research, authorship, and/or publication of this article.
Ethical Approval
The experimental protocol was approved by the Institutional Animal Care and Use Committee of Cathay General Hospital.
Animal Welfare
The present study followed international, national, and/or institutional guidelines for humane animal treatment and complied with relevant legislation.
Supplemental Material
Supplemental Material for this article are available online.
References
Supplementary Material
Please find the following supplemental material available below.
For Open Access articles published under a Creative Commons License, all supplemental material carries the same license as the article it is associated with.
For non-Open Access articles published, all supplemental material carries a non-exclusive license, and permission requests for re-use of supplemental material or any part of supplemental material shall be sent directly to the copyright owner as specified in the copyright notice associated with the article.