
Abstract
Objective
To query the transcript-level changes in the medial and lateral tibial plateau cartilage in tandem with obesity in patients with end-stage osteoarthritis (OA).
Design
Cartilage was obtained from 23 patients (20 obese [body mass index > 30 kg/m2], 3 overweight [body mass index < 30 kg/m2]) at the time of total knee replacement. Cartilage integrity was assessed using Outerbridge scale, while radiographic changes were scored on preoperative X-rays using Kellgren-Lawrence (K-L) classification. RNA was probed for differentially expressed transcripts between medial and lateral compartments using Affymetrix Gene 2.0 ST Array and validated via real-time polymerase chain reaction. Gene ontology and pathway analyses were also queried.
Results
Scoring of cartilage integrity by the Outerbridge scale indicated that the medial and lateral compartments were similar, while scoring by the K-L classification indicated that the medial compartment was more severely damaged than the lateral compartment. We observed a distinct transcript profile with >50% of transcripts unique between medial and lateral compartments. MMP13 and COL2A1 were more highly expressed in medial versus lateral compartment. Polymerase chain reaction confirmed expression of 4 differentially expressed transcripts. Numerous transcripts, biological processes, and pathways were significantly different between overweight and obese patients with a differential response of obesity on medial and lateral compartments.
Conclusions
Our findings support molecular differences between medial and lateral compartments reflective of the greater severity of OA in the medial compartment. The K-L system better reflected the molecular results than did the Outerbridge. Moreover, the molecular effect of obesity was different between the medial and lateral compartments of the same knee plausibly reflecting the molecular effects of differential biomechanical loading.
Introduction
While osteoarthritis (OA) is a total joint disease, cartilage degeneration is still the hallmark of end-stage disease. Cartilage often suffers from severe degeneration of the medial weight-bearing compartment. The burden of OA is rising, in significant part, due to increased obesity. Obesity, characterized by high body mass index (BMI), increases the mechanical load on the knee and hip joints1,2 as well as metabolic burden. 3 These implications for the musculoskeletal system consist of numerous degenerative and inflammatory conditions including OA. 4 Obesity is a modifiable risk factor for OA, 5 and weight loss in obese patients with OA has some short-term structure-modifying benefits on the onset and progression of OA.6-8 A large body of emerging evidence suggests that obesity affects OA pathogenesis beyond simple mechanics as it can affect both weight-bearing and non–weight-bearing joints likely via the expression of various inflammatory mediators.3,9,10 Despite the involvement of both biomechanical and biochemical signaling, little scientific evidence exists regarding how the molecular changes in the biology of the knee are related to obesity.
The results of molecular analyses of advanced cartilage degeneration in the medial compartment should represent direct effects of disease, and also when compared with the lateral compartment, site-related effects driven by altered mechanical loading. At the molecular level, whether the medial compartment is more affected than the lateral compartment is debatable and may depend on an abnormal external knee adduction movement and imbalanced load distribution on the medial compartment. 11
In this study, we define the gene expression pattern in cartilage at the time of total joint replacement in lateral and medial compartments from the same patient, thereby relating the degree of mechanical loading (generally greater in the medial compartment) with the molecular phenotype. Gene expression profiling of degenerated and intact cartilage from within the same knee minimizes confounding variables in patients’ age, BMI, sex, drug therapy, duration of disease, and genetics.11-14 We compared the molecular differences with the Outerbridge assessment reflective of cartilage damage 15 and the Kellgren-Lawrence (K-L) assessment reflective of joint space narrowing, osteophyte severity and location, and bone sclerosis. 16 These findings may provide clues to the pathogenetic mechanism(s) of OA that could inform the development of new diagnostic markers as well as therapeutic targets in individuals with OA.
Methods
Human Knee Joint Tissues
At the time of arthroplasty, lateral and medial tibial compartments were harvested. The diagnosis of OA was based on criterion for knee OA of the American College of Rheumatology. All patients had advanced radiographic evidence for OA, had moderate to severe pain and functional limitations, and had failed nonoperative measures including nonsteroidal anti-inflammatory medications. Deidentified samples were brought to the laboratory within 30 minutes of collection. All cartilage present in the damaged and undamaged regions was carefully collected from the tibial plateau. As the central region of the tibial plateau contained more damaged and fibrillated cartilage and the peripheral region contained less damaged cartilage, we consistently harvested both macroscopically damaged and macroscopically normal cartilage to maintain sampling uniformity across patient groups. Care was exercised to avoid inclusion of subchondral bone. Cartilage fragments were preserved in RNAlater solution (ThermoFisher Scientific).
The Institutional Review Board (IRB, Human Research Protection Office) of Washington University approved the study (IRB Approval No. 201404093). Written informed consent was obtained from all participants (N = 23). Patients were excluded if they had a diagnosis of rheumatoid arthritis (RA), inflammatory/autoimmune disease, diabetes, avascular necrosis, posttraumatic OA, or any prior knee surgery. Only patients with degenerative OA were included. All patients had moderate to severe pain on a regular basis that was unresponsive to nonoperative management in order to meet criteria for total knee arthroplasty. Overall, the patients were reasonably homogeneous with regard to pain and knee score. All preoperative protocols were standard and were applied uniformly across the study period. Regardless of BMI, all obese and nonobese patients were treated in the same way, and the same protocol was used for reducing blood loss.
Characteristics of study patients are shown in
Characteristics of Study Participants.
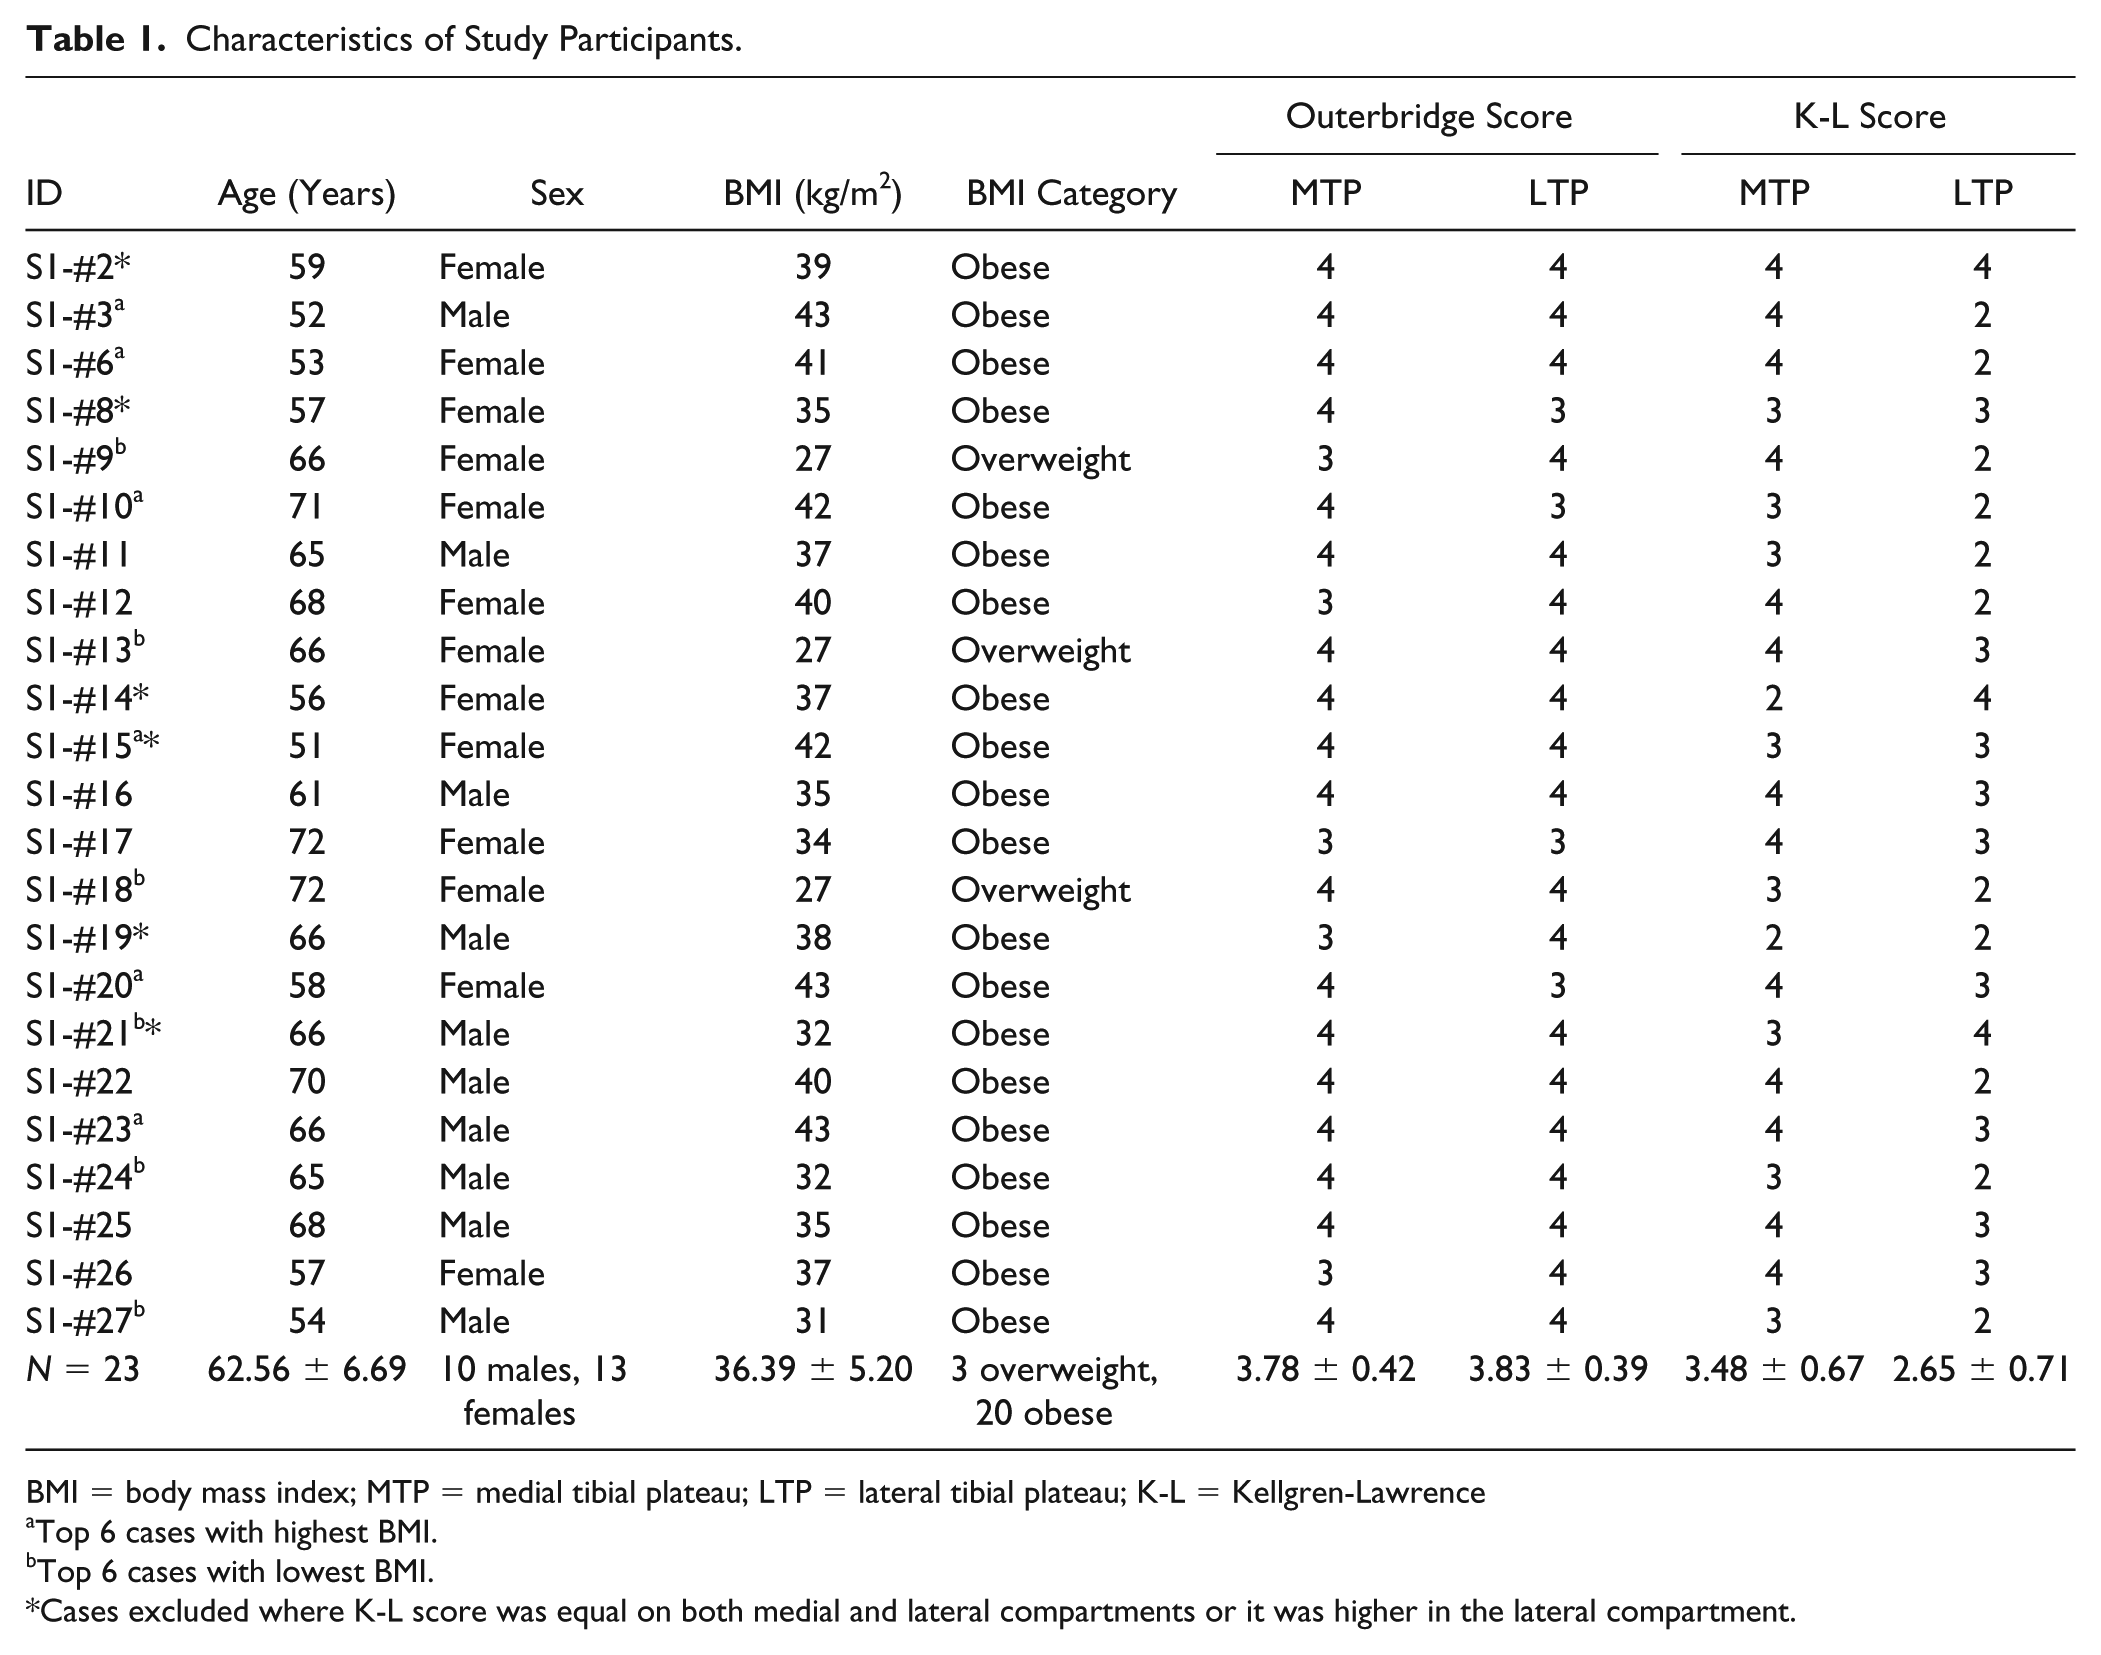
BMI = body mass index; MTP = medial tibial plateau; LTP = lateral tibial plateau; K-L = Kellgren-Lawrence
Top 6 cases with highest BMI.
Top 6 cases with lowest BMI.
Cases excluded where K-L score was equal on both medial and lateral compartments or it was higher in the lateral compartment.
Cartilage and OA Grading
To quantify macroscopic cartilage integrity, cartilage was assessed intraoperatively using the Outerbridge scoring system.
15
OA severity (joint space narrowing, severity and location of osteophytes, and bone sclerosis) was assessed through radiographic changes scored on preoperative X-rays using K-L classification.
16
Average overall Outerbridge score was 3.80 ± 0.40 with no significant (P = 0.72) difference between medial (3.78 ± 0.42) and lateral (3.83 ± 0.39) compartments. K-L score on an average was 3.06 ± 0.80 with significant (P = 0.0002) difference between medial (3.48 ± 0.67) and lateral (2.65 ± 0.71) compartments. After excluding 6 cases (indicated by an asterisk in Table 1), the medial compartment had a K-L score of 3.71 ± 0.47 compared with the lateral compartment (2.41 ± 0.51) with a statistically significant difference (P < 0.001) between the two compartments (
RNA Preparation
RNA was prepared using the TRIzol-chloroform method. Briefly, cartilage was pulverized using Mikro-dismembrator (B. Braun, Biotech International) under cryogenic conditions. Cartilage powder was collected in TRIzol reagent (Invitrogen). After the standard TRIzol and chloroform steps, RNA was purified using Minispin columns (Qiagen) as described earlier. 17 All samples were then assessed for quality as well as quantity with the Agilent Bioanalyzer 2100 system (Agilent Technologies) prior to further processing. Average RNA integrity number (RIN) was 6.50 (range = 5.8-7.9), indicating a relatively uniform degradation across samples as these were prepared from clinically degraded material. This RIN range is acceptable for microarrays since we used Affymetrix Gene 2.0 ST Array, which is particularly designed for partially degraded RNA samples.
Microarray Hybridization
Briefly, 5 µg of biotinylated cDNA (from 20 ng RNA) were prepared with the NuGEN Ovation Pico WTA Amplification System following the manufacturer’s protocol. Following fragmentation with NuGEN Encore Biotin Module, cDNA was hybridized on Affymetrix Gene 2.0 ST Arrays (Affymetrix Inc.). The microarrays were scanned with the use of the Affymetrix GeneChip 7G 3000 Scanner. Detailed methods can be found elsewhere. 17
Data Analysis and Statistics
Background subtracted probe intensities were converted to log2, and then normalized using quantile normalization. As RNA quality was relatively low, it likely tends to limit the lower level of expression that is measureable on microarray. Low-expression genes may be indistinguishable from sampling noise. The presence of noisy, low-expression genes can decrease the sensitivity of detecting differentially expressed (DE) genes. However, our exploratory analysis of histogram of distribution of signals across the probesets revealed no obvious cutoff value for possible background probe (
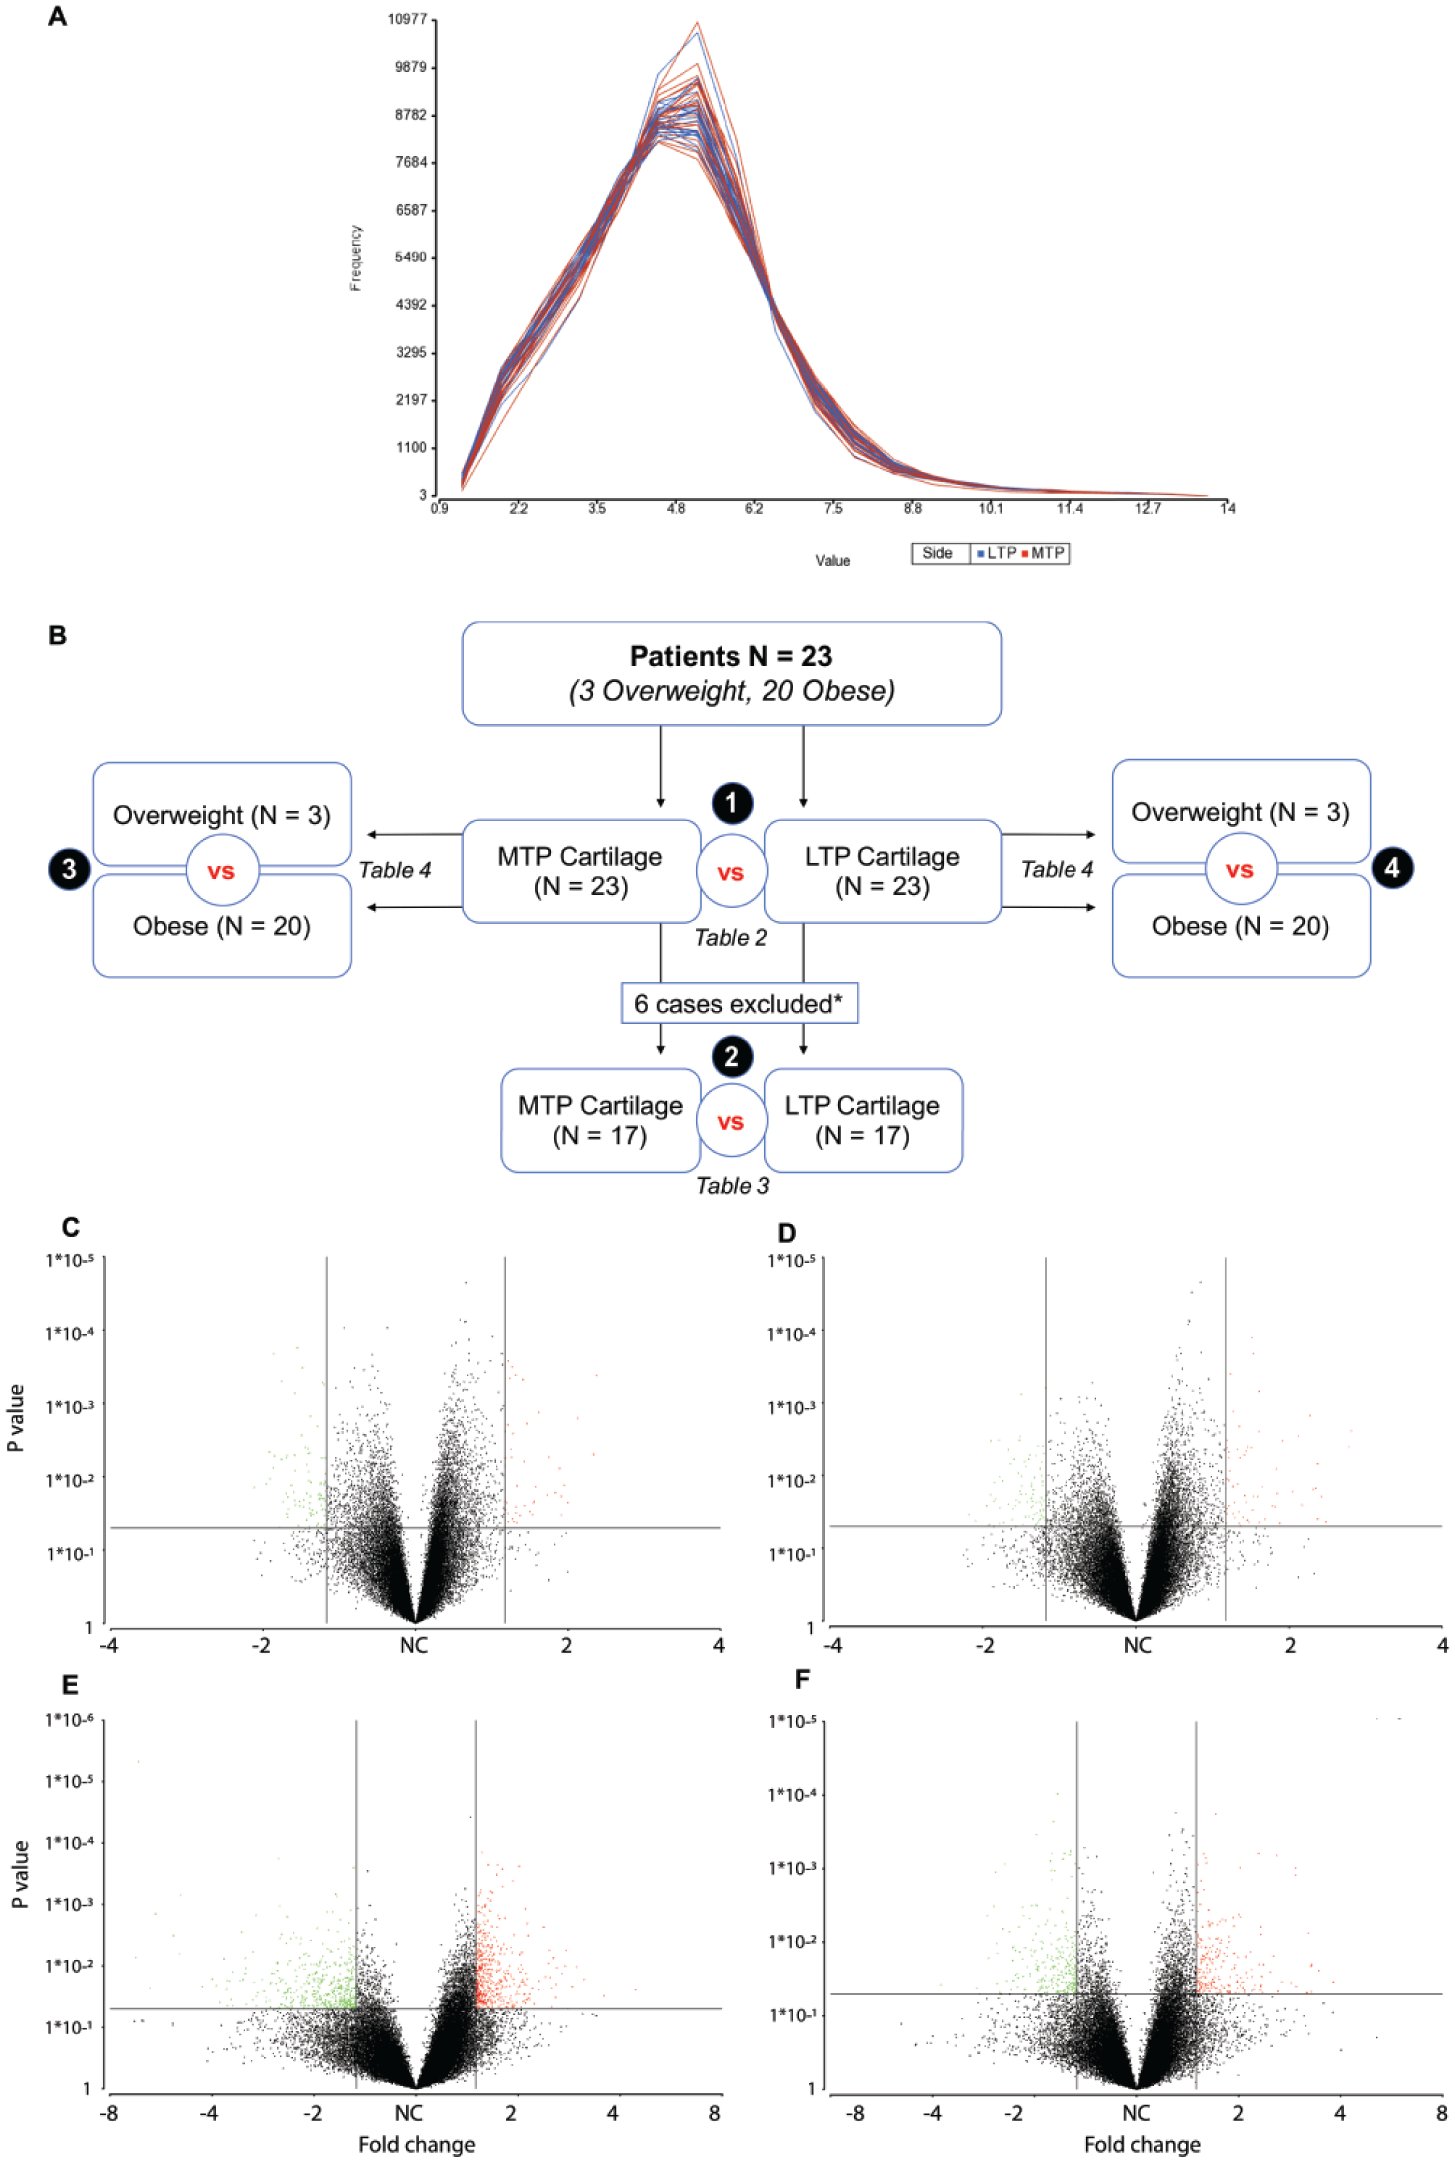
Study design and data visualization. Exploratory analysis of histograms of distribution of signal across the probesets (in medial vs. lateral comparison) revealed no obvious cutoff value for possible background probes. Therefore, to avoid a possible selection bias, the analysis was performed on the full probesets (
We first analyzed data using all 23 cases. Then, we analyzed the data using 17 cases that had higher K-L score on the medial compared with the lateral compartment (mean score = 3.70 vs. 2.41) and excluded 6 cases (4 cases had equal score on both medial and lateral compartments and 2 cases had higher score in the lateral compartment). Then we detected differential expression between overweight and obese patients based on a prior study in meniscus where we found that the largest differences in gene expression existed between overweight and obese patients.
18
A flow chart showing study design is depicted in
For comparison between medial and lateral compartments, we used 1-way ANOVA followed by filtration of DE genes using unadjusted P value (<0.05). To provide a metric for assessment whether a P value was significant by chance, false-discovery-rate (FDR) corrected P value was also provided using step-up method by Benjamini and Hochberg. All duplicate, non-annotated, uncharacterized, and pseudogenes were removed. With N = 23 or N = 17, we can detect an effect size of, respectively, 0.85 and 1.00 at 80% power and α = 0.05. For comparison between overweight and obese patients, we built a 2-way ANCOVA and included sex (categorical) and age (numeric) as covariates. We filtered the DE gene transcripts as above. For all analyses, we used a 1.5-fold cutoff for DE transcripts that passed unadjusted P value as well as FDR cutoff of 0.05. With an N = 3 in one group and N = 20 in the other group, we can detect an effect size of 1.80 at 80% power and α = 0.05. We also generated volcano plots to visualize our data. These plots allowed for a quick identification of DE genes with a quantifiable level of expression in terms of both direction (up- or downregulated) and magnitude (fold change) of expression as well as significance (P value).
Data Sharing
Data were deposited to the National Center for Biotechnology Information (NCBI) via Gene Expression Omnibus (GEO) 19 with GEO series accession code GSE98460 (http://www.ncbi.nlm.nih.gov/projects/geo).
Gene Ontology and Pathway Analysis
To better understand the functional attributes of a large number of DE genes associated with cartilage degeneration and OA, we performed hypergeometric tests on gene lists using GeneGo MetaCore tools (https://portal.genego.com). 17 Moreover, by using Kyoto Encyclopedia of Genes and Genomes (KEGG) pathway analysis, we classified these differentially expressed genes to significant signaling pathways and screened numerous enriched signaling pathways. For the sake of simplicity, the enrichment score was used to rank the pathways and only the top most pathway was reported.
Real-Time Polymerase Chain Reaction (PCR) Validation
Real-time PCR was performed using RNA from 16 medial compartment cartilage samples and 16 lateral compartment cartilage samples on a subset of genes DE between medial and lateral compartments. Prior to cDNA synthesis, RNA was treated with DNase-I (ThermoFisher Scientific), then 250 ng of RNA was reverse-transcribed with SuperScript II reverse transcriptase to synthesize cDNA using random primers. Transcript sequences for reference and target genes were assembled from the NCBI (www.ncbi.nlm.nih.gov/) and were cross-referenced with the Ensembl genome browser for the human genome (www.ensembl.org). We performed basic local alignment search tools (BLAST) searches to confirm that all the primer sequences span known variants. The following primers were used: MMP13 (forward 5′-TGGTCCAGGAGATGAAGACC-3′, reverse 5′-TCCTCGGAGACTGGTAATGG-3′), COL2A1 (forward 5′-CCCAGAGGTGACAAAGGAGA-3′, reverse 5′-CACCTTGGTCTCCAGAAGGA-3′), SELE (forward 5′-AGATGAGGACTGCGTGGAGA-3′, reverse 5′-GTACAGGCAGCTGTGTAGCA-3′), CTSS (forward 5′-ACAAGGGCATCGACTCAGAC-3′, reverse 5′-TTTGAACATGTGGCAGCACG-3′), and GAPDH (forward 5′-ACCCAGAAGACTGTGGATGG-3′, reverse 5′-GAGGCAGGGATGATGTTCTG-3′). Real-time PCR was performed with the use of Sybr Green PCR Master Mix (ThermoFisher Scientific) in duplicate reactions. Samples were amplified on the 7500 Fast Real-Time PCR System (Applied Biosystems) as follows: initial activation at 95°C for 10 minutes (1 cycle), denaturation at 95°C for 15 seconds (40 cycles), and annealing at 60°C for 60 seconds (1 cycle). We found that GAPDH was a good representative reference gene with negligible variation across samples; therefore, the Ct values for reference (GAPDH) and target genes were measured and normalized to GAPDH (ΔCt). The differences in gene expression between 2 groups were calculated using the 2−ΔCt approach. Data were analyzed using nonparametric Mann-Whitney test (GraphPad Prism).
Results
Differences in Medial and Lateral Compartments (All Cases)
Quantitative Data
Our analysis of DE transcripts between medial and lateral compartments showed that 1,984 transcripts were significantly (P < 0.05) DE in cartilage between the 2 compartments (
Transcripts and Biological Processes
The most highly elevated transcripts in the medial compartment included MMP13, MATN3, EPYC, SCARNA5, and COL2A1. Likewise, transcripts repressed in the medial compartment consisted of SELE, MCTP1, CTSS, VSIG4, F13A1, and STEAP4 (
Differentially Expressed Transcripts between Medial and Lateral Compartments at ⩾1.5-Fold (All Cases).
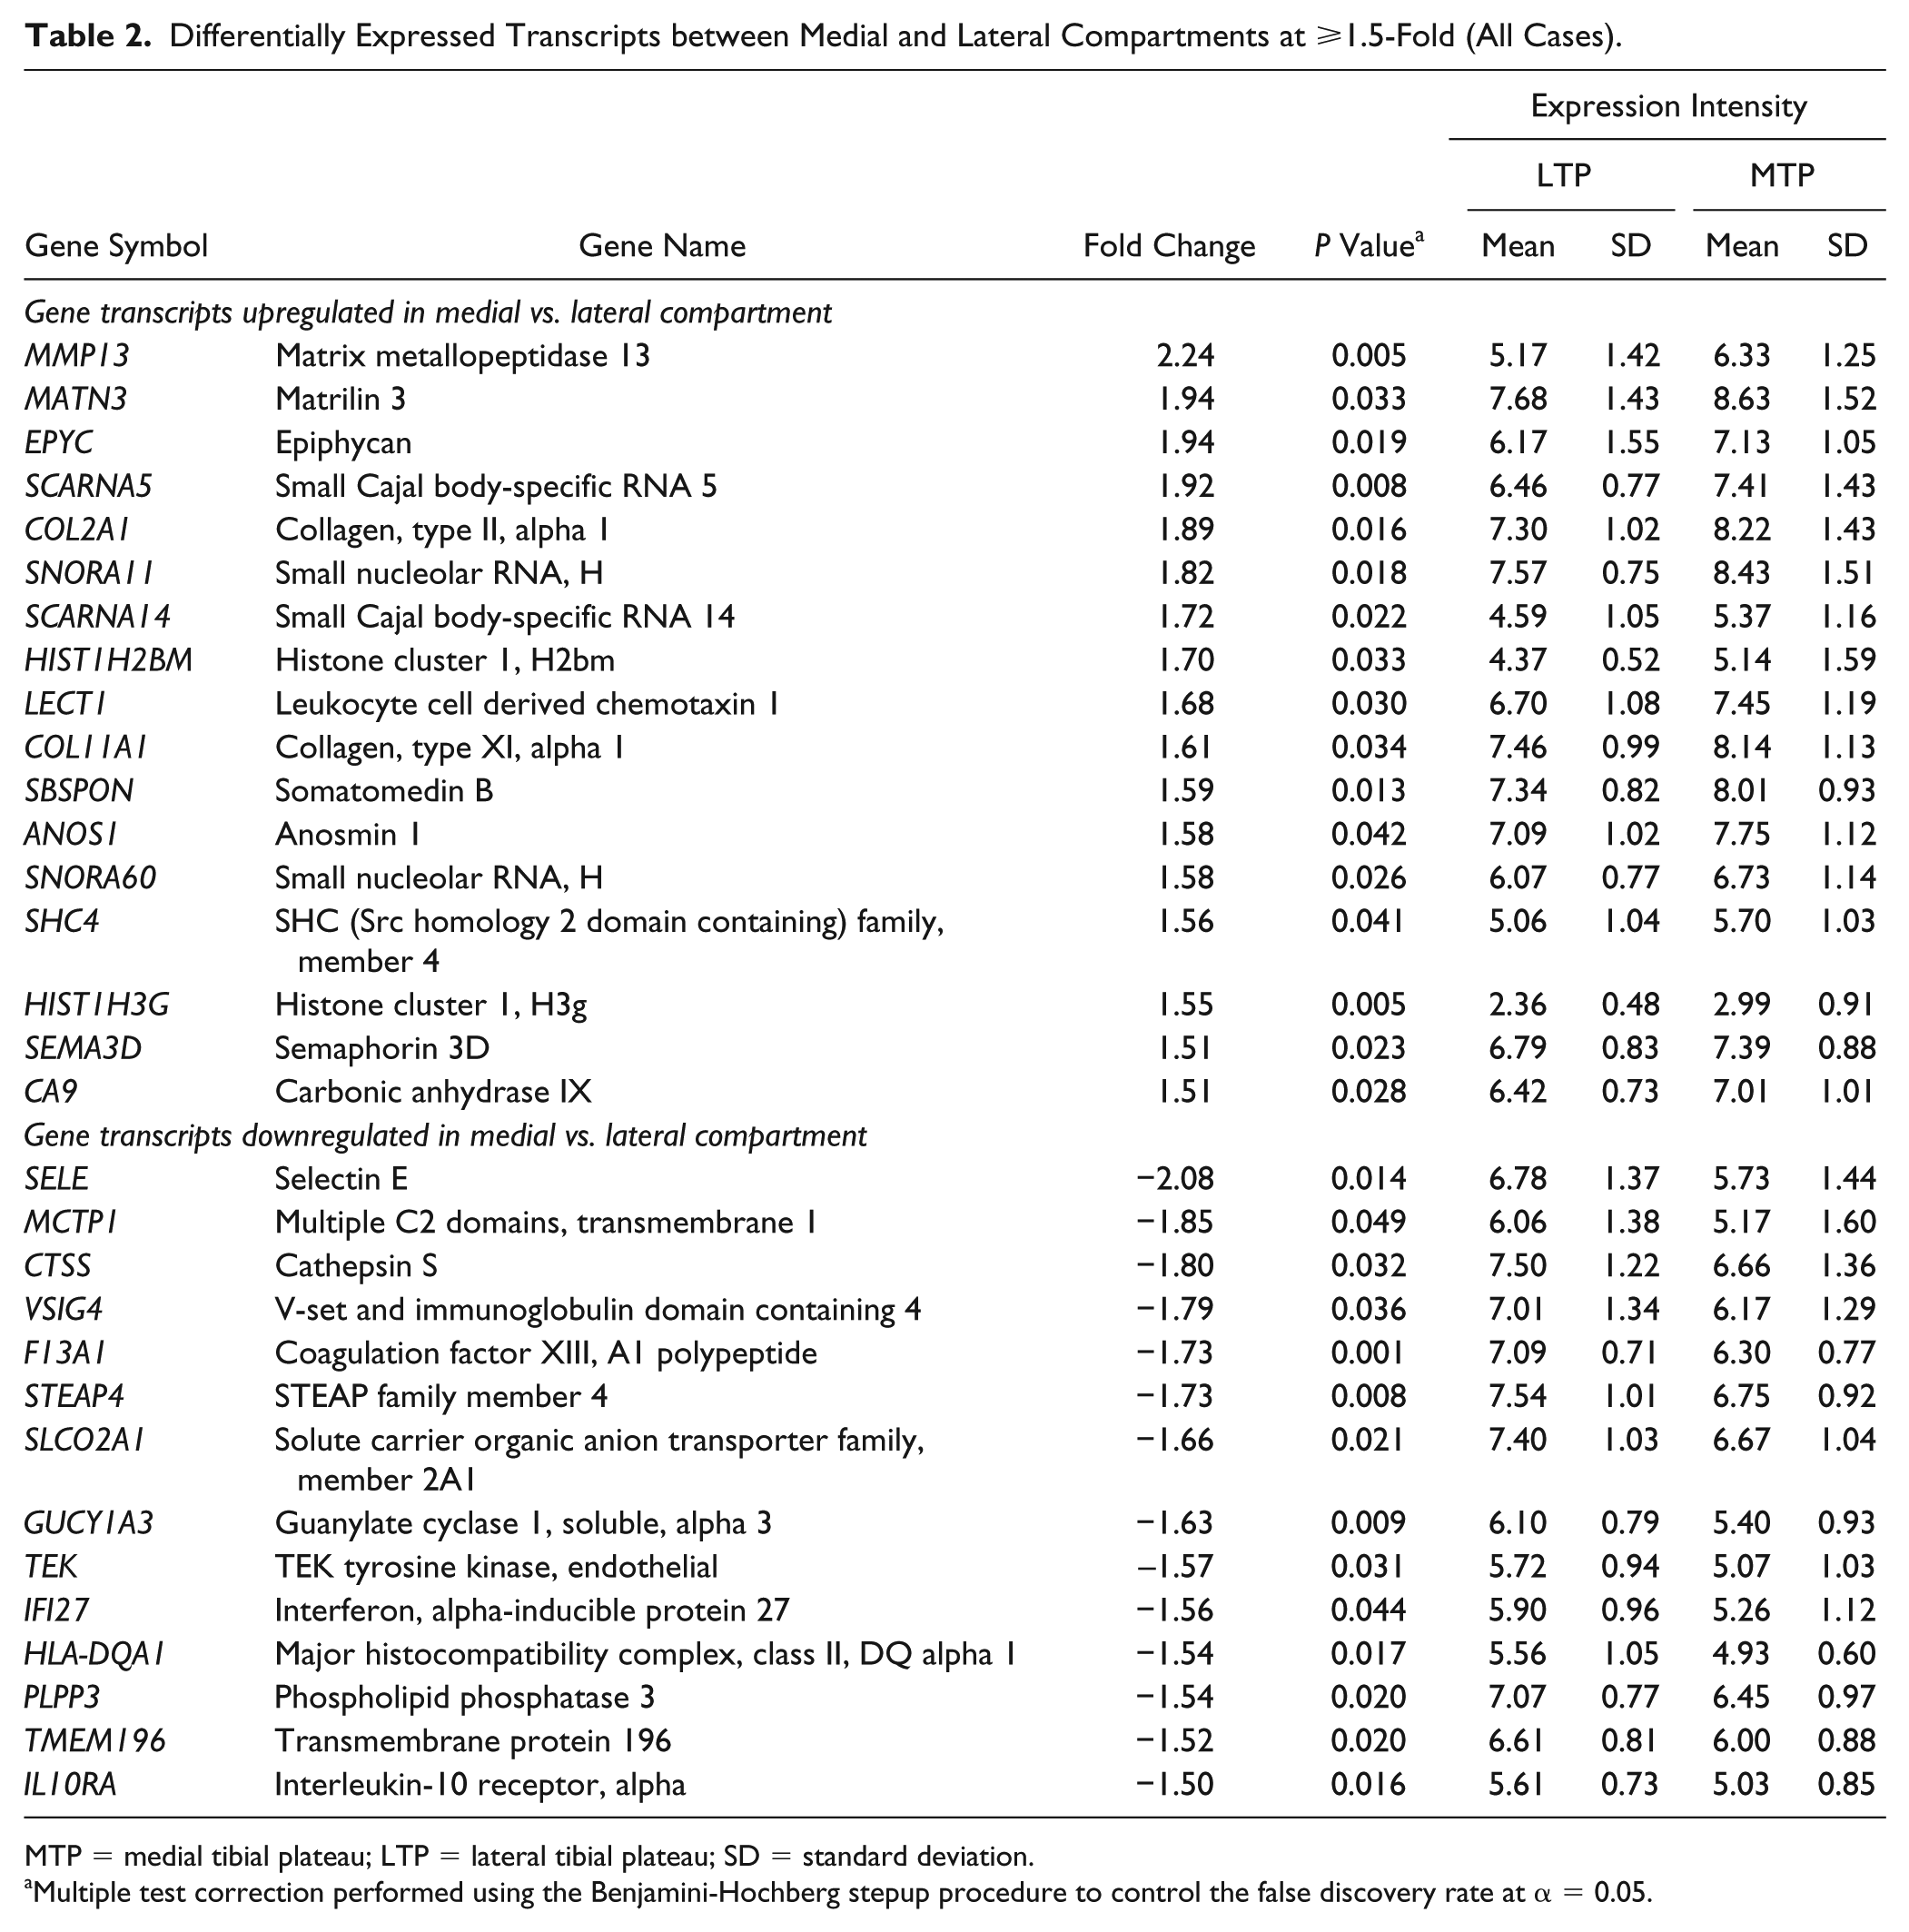
MTP = medial tibial plateau; LTP = lateral tibial plateau; SD = standard deviation.
Multiple test correction performed using the Benjamini-Hochberg stepup procedure to control the false discovery rate at α = 0.05.
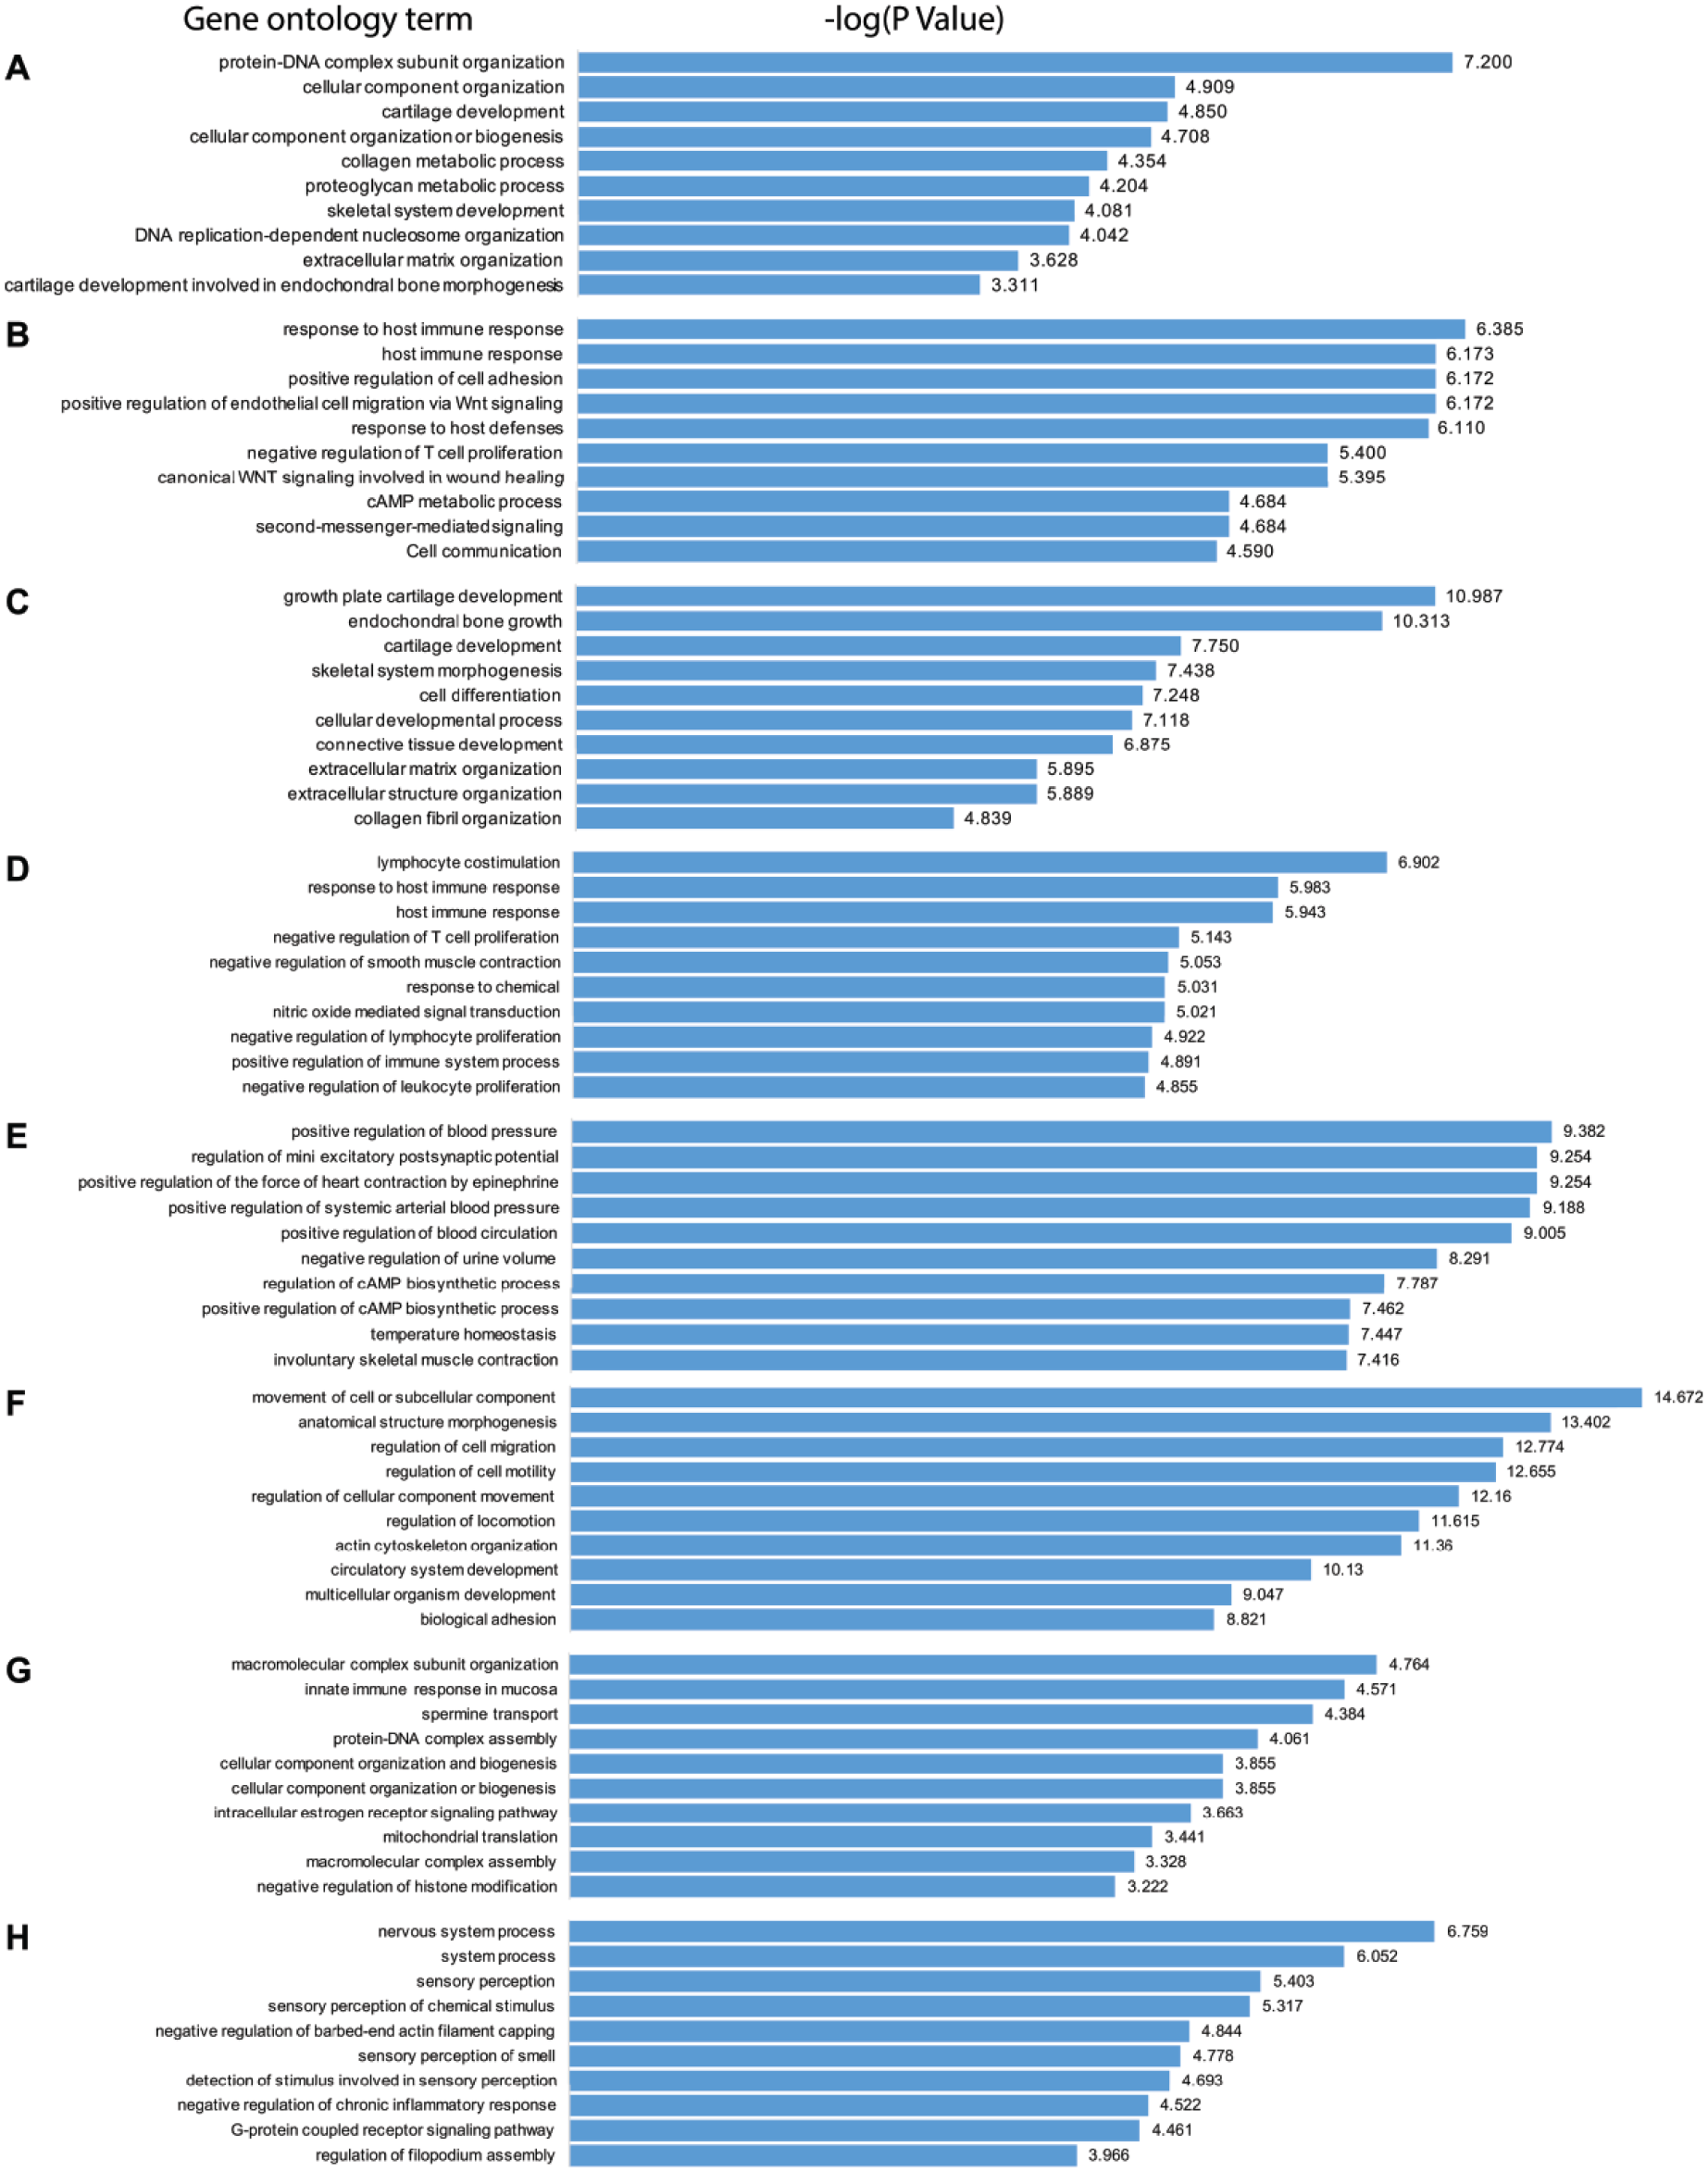
Biological processes (gene ontology analyses). Shown are the top 10 gene ontology biologic processes as determined based on the statistical significance of the −log(P value) identified by GeneGo MetaCore analysis. Biological processes elevated (
Differences Related to Medial and Lateral Compartments (Excluding 6 Cases)
Quantitative Data
We analyzed the data using 17 cases that had higher K-L score on the medial compared with the lateral compartment after excluding 6 cases that had equal or higher OA scores on the lateral side. Our analysis showed that in total 1,424 transcripts were significantly (P < 0.05) DE in cartilage between the medial and lateral compartments (
Transcripts and Biological Processes
The most highly elevated transcripts in the medial compartment included MMP13, EPYC, MT1G, MATN3, COL2A1, GREM1, SCARNA5, and VEGFA. Likewise, transcripts repressed in the medial compartment consisted of SELE, VSIG4, CTSS, STEAP4, F13A1, SLCO2A1, and IL10RA (
Gene Transcripts Differentially Expressed between the Medial and Lateral Compartments (6 Cases Excluded) a .
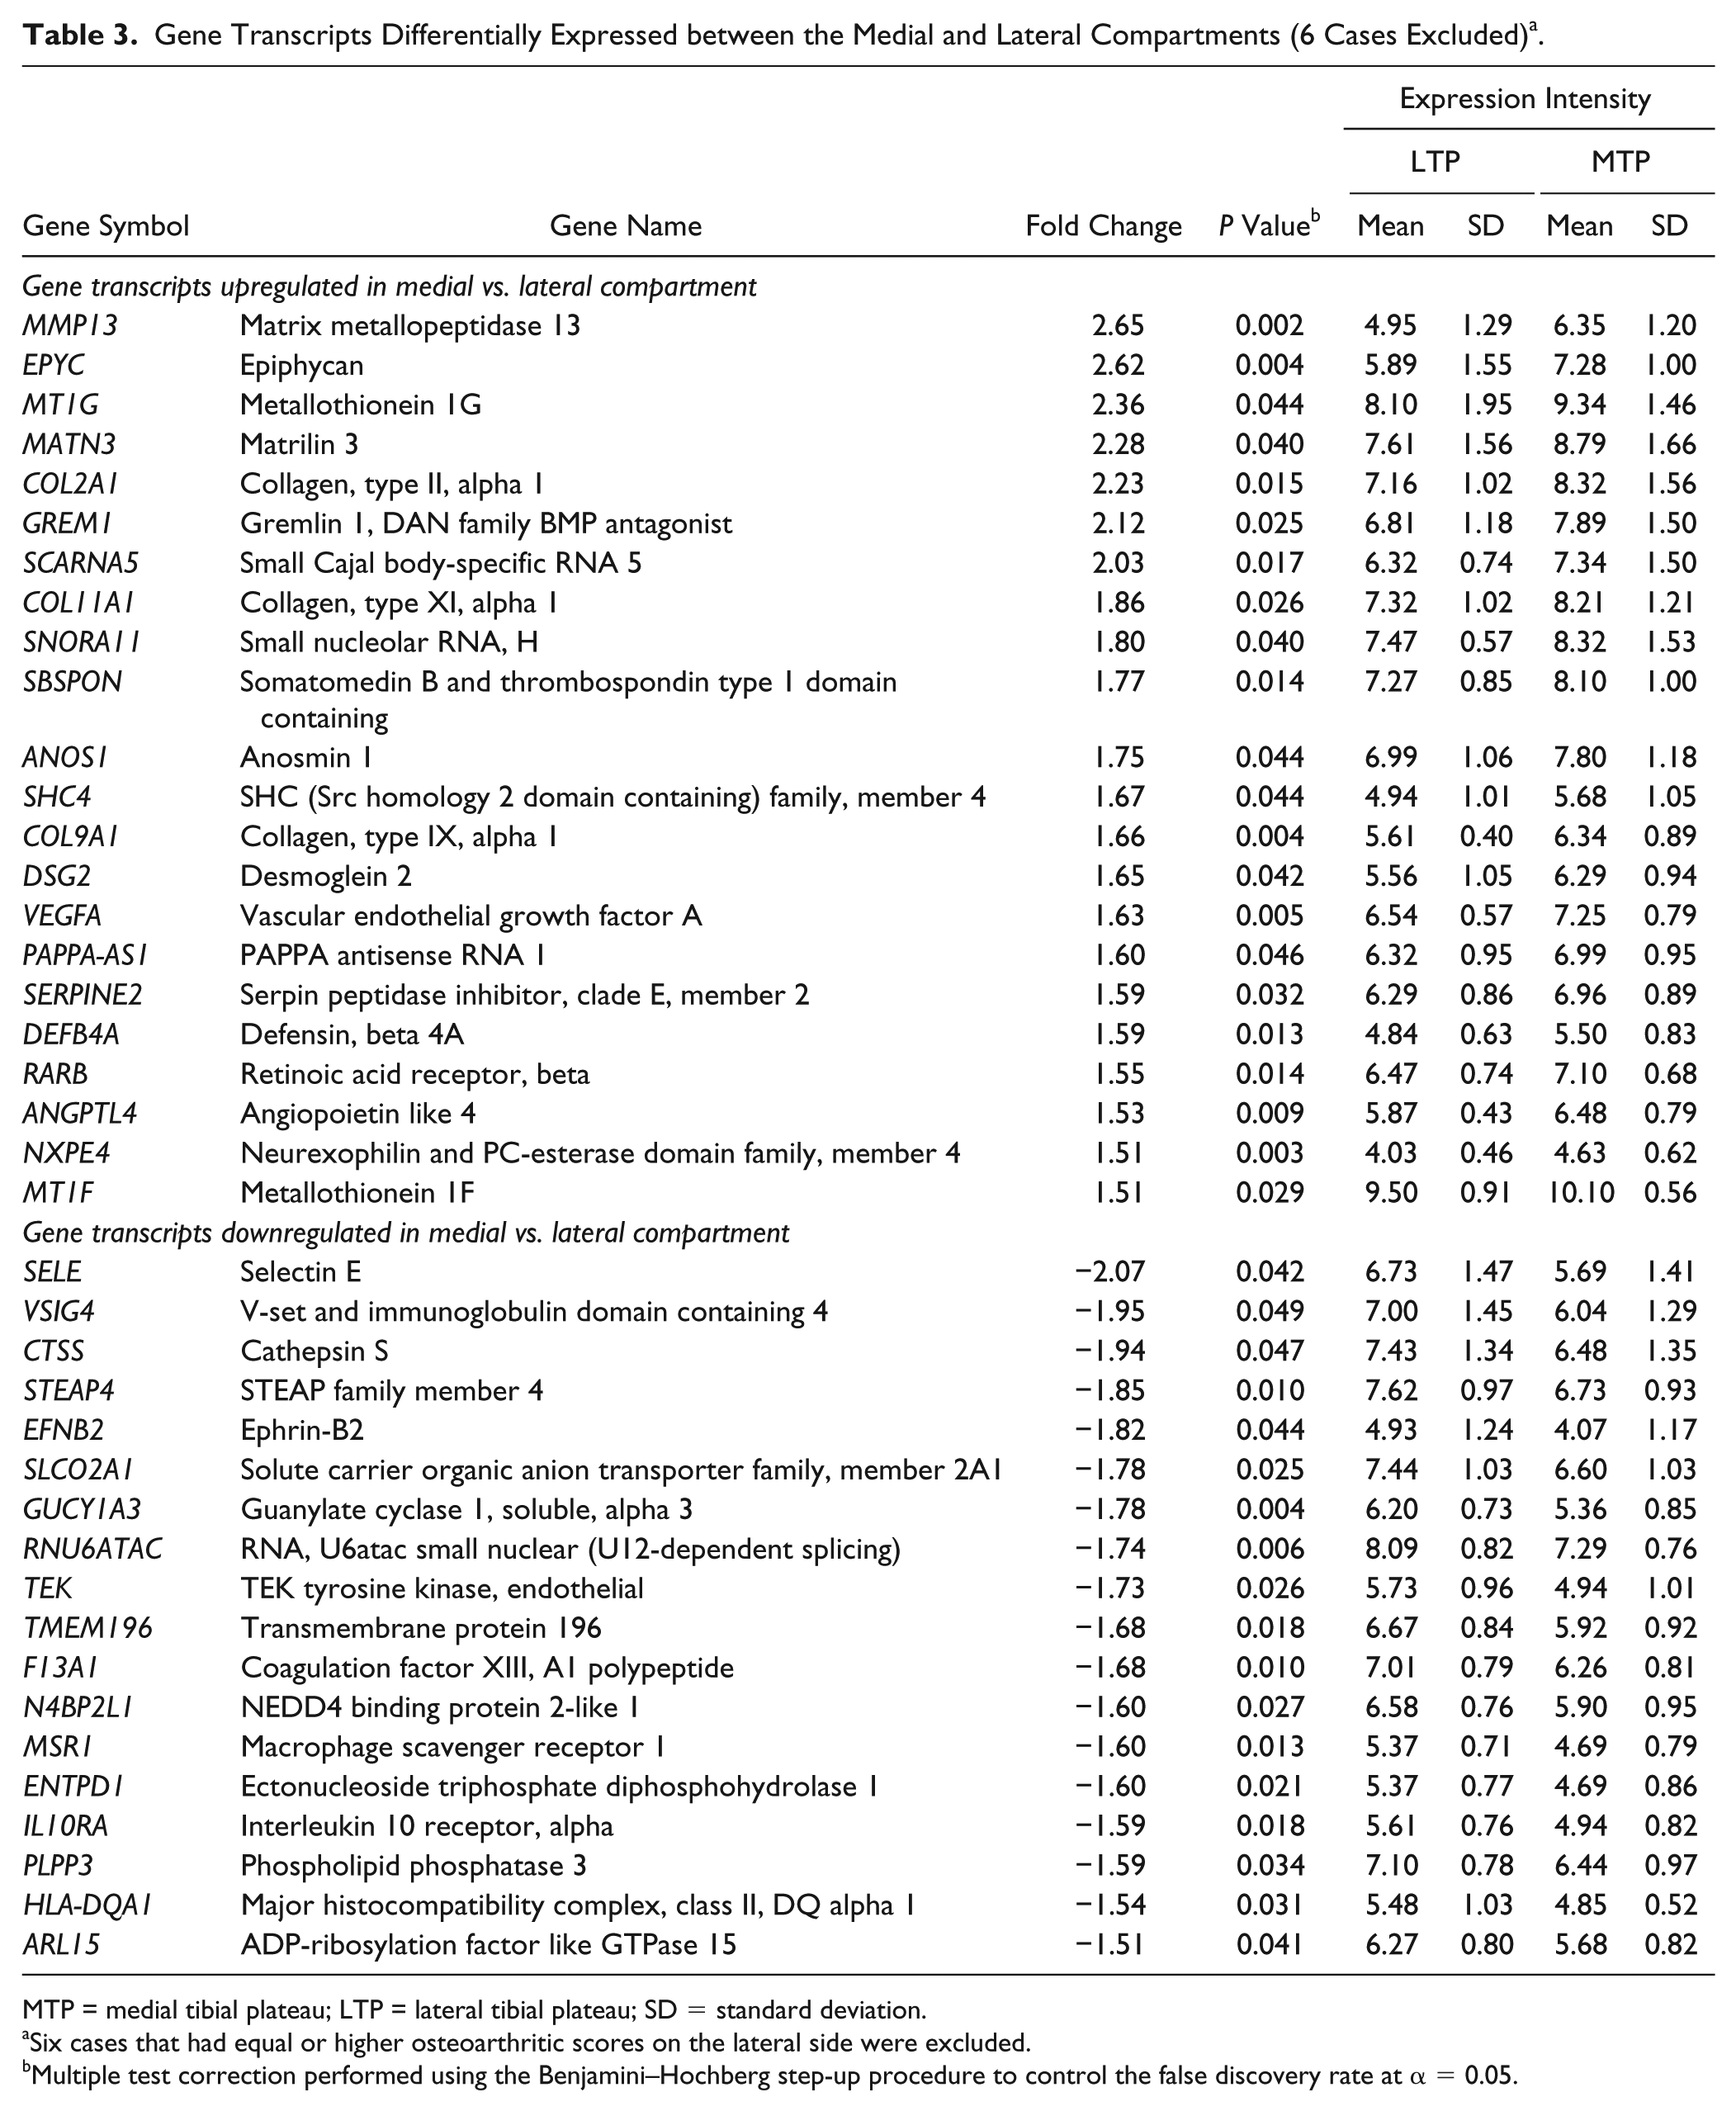
MTP = medial tibial plateau; LTP = lateral tibial plateau; SD = standard deviation.
Six cases that had equal or higher osteoarthritic scores on the lateral side were excluded.
Multiple test correction performed using the Benjamini–Hochberg step-up procedure to control the false discovery rate at α = 0.05.
Transcriptome Data in Relation to BMI
Quantitative Data
We found that 344 transcripts were significantly (P < 0.05) DE between overweight and obese in the medial compartment (
Differentially Expressed Transcripts between Overweight and Obese Patients at ⩾1.5-Fold a .
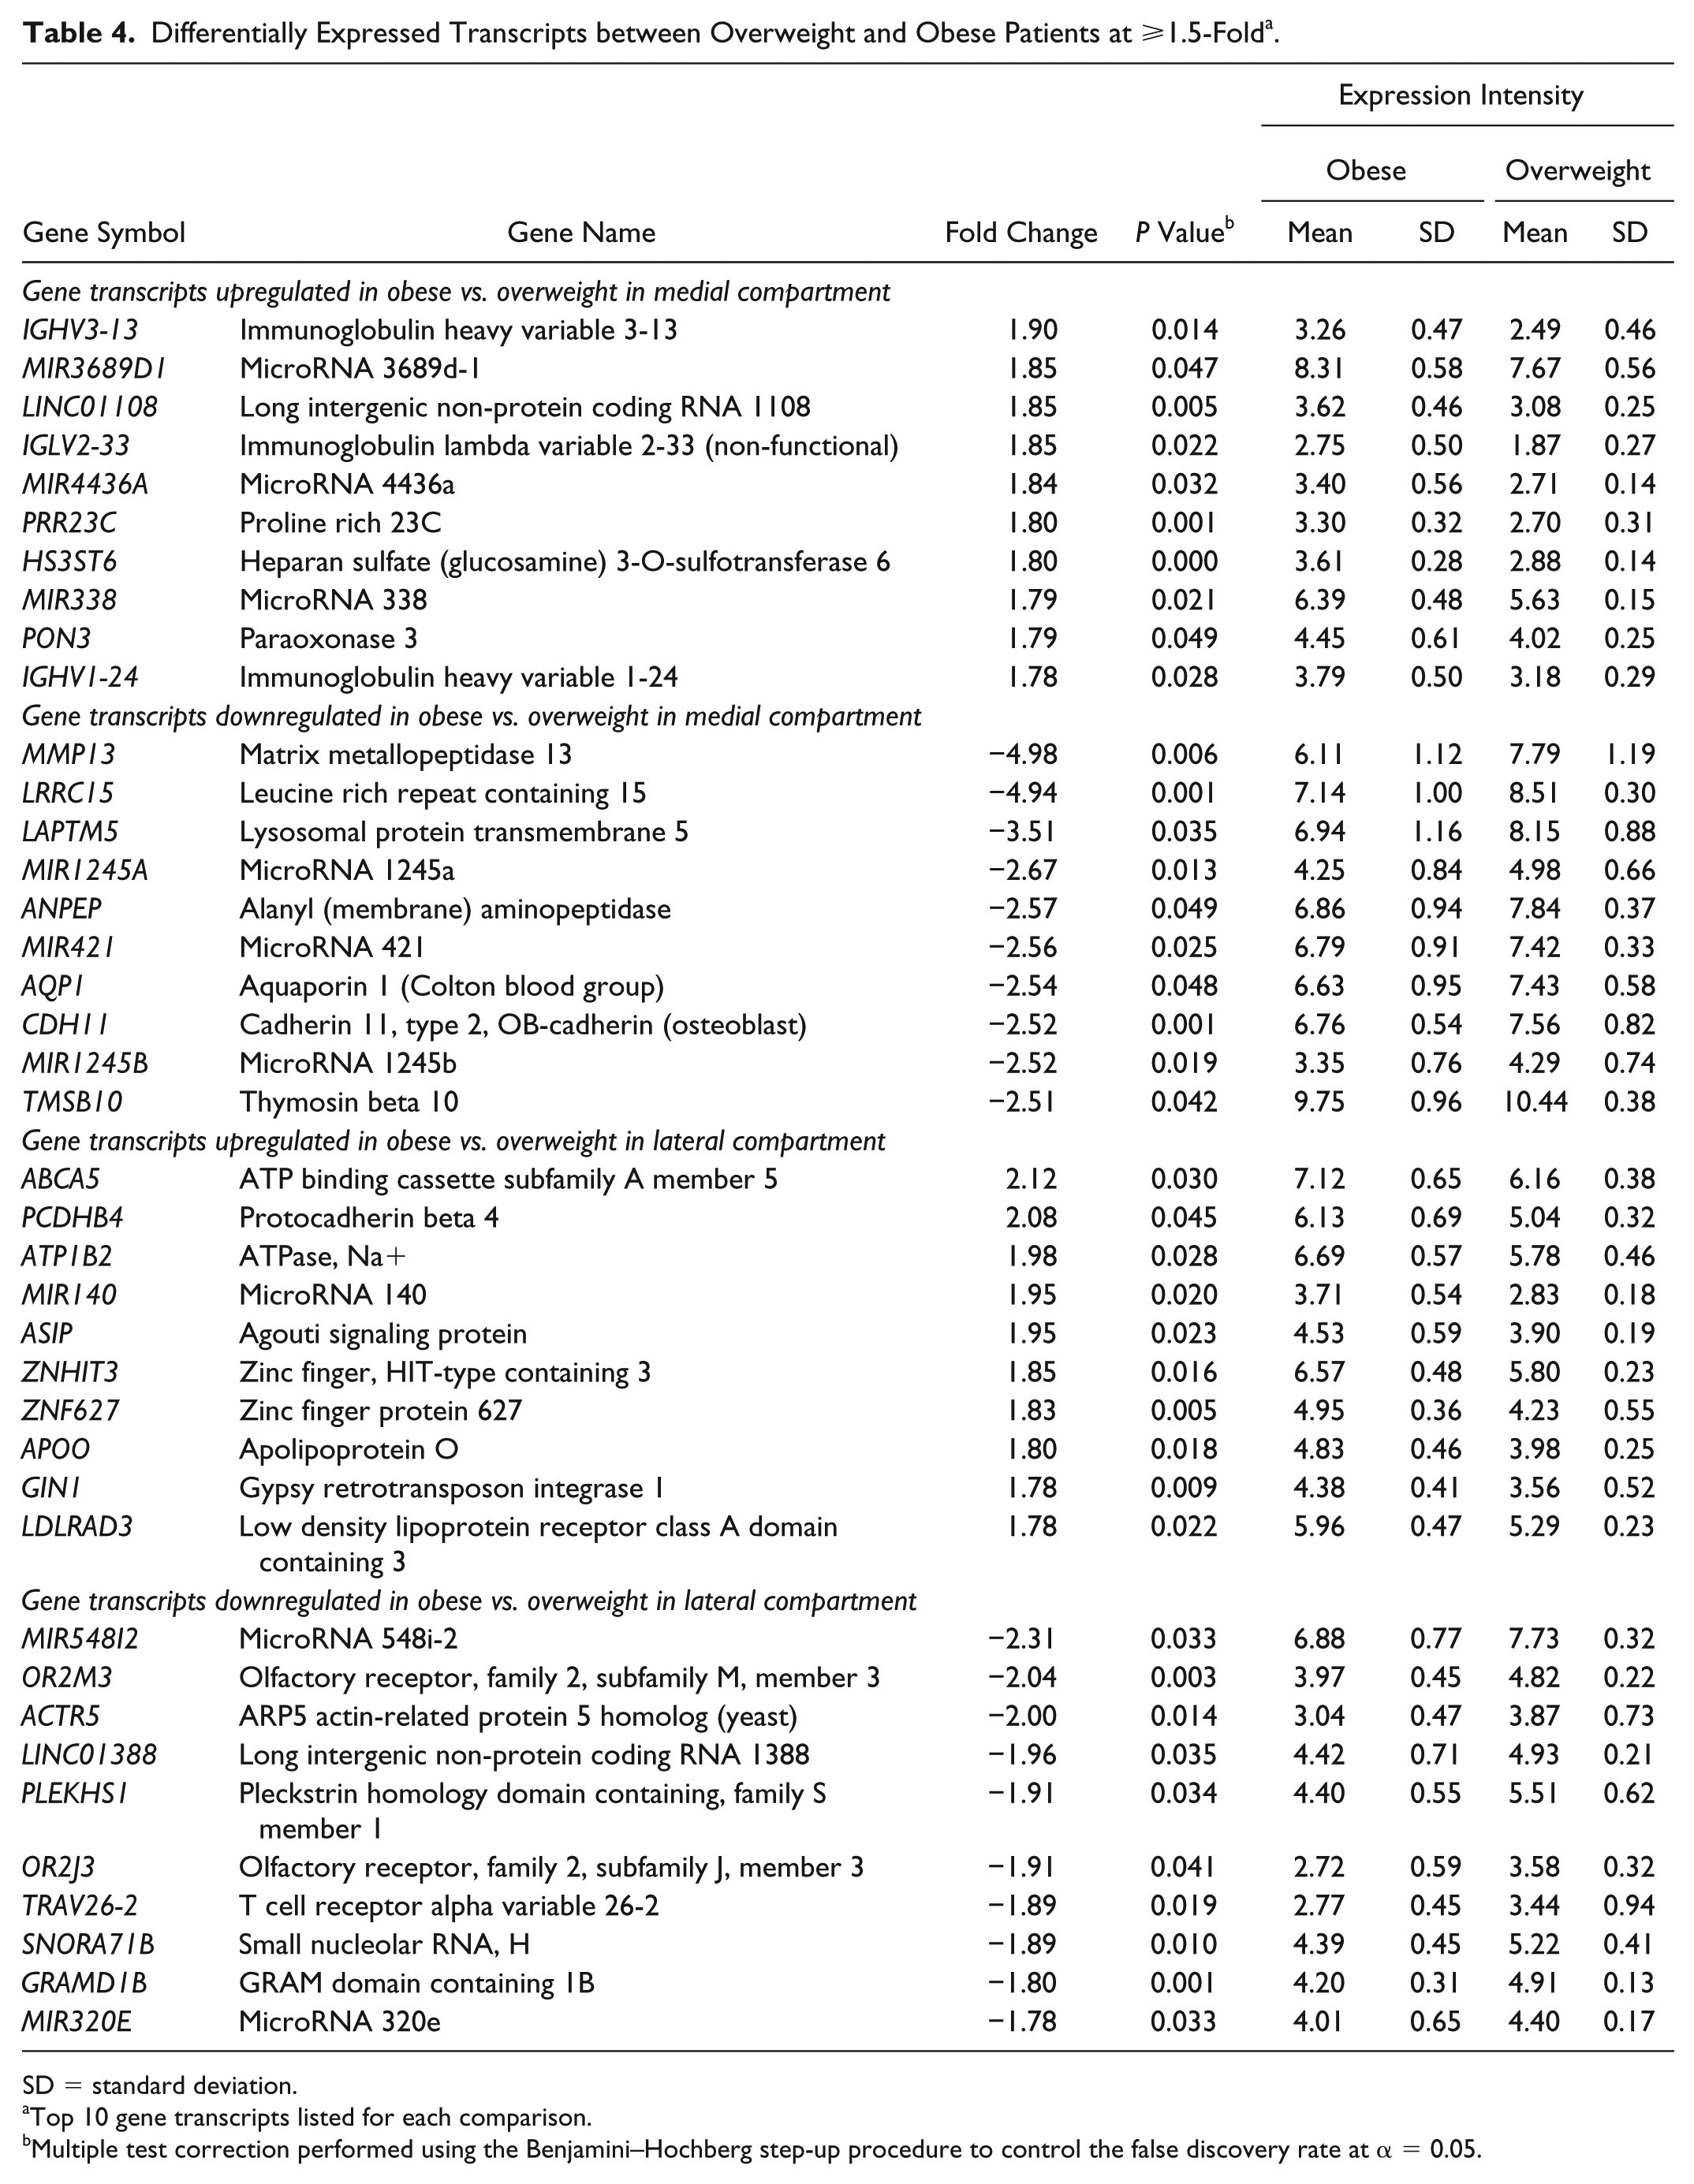
SD = standard deviation.
Top 10 gene transcripts listed for each comparison.
Multiple test correction performed using the Benjamini–Hochberg step-up procedure to control the false discovery rate at α = 0.05.
Transcripts and Biological Processes
None of the transcripts showed ⩾2-fold elevation in expression in obese patients compared with overweight in the medial compartment. In the lateral compartment, 2 transcripts, ABCA5 and PCDHB4, showed ⩾2-fold elevation in expression in obese patients. In contrast, transcripts that were highly repressed in obese patients in the medial compartment showed that numerous transcripts had ⩾2-fold expression and some of them such as MMP13 (−4.98-fold), LRRC15 (−4.94-fold), and LAPTM5 (−3.51-fold) even showed >3-fold suppression in their expression. In the lateral compartment, MIR548I2 (−2.31-fold), OR2M3 (−2.04-fold), and ACTR5 (−2.00-fold) showed >2-fold suppression in expression in obese patients compared to overweight.
The biological processes enriched by transcripts elevated in the medial compartment included metabolic processes and positive regulation of arterial blood pressure, while those enriched by the transcripts repressed in the medial compartment included cell migration and adhesion (
Gene transcripts elevated in obese patients in the medial compartment were enriched for neuroactive receptor-ligand interaction (
Gene transcripts elevated in obese patients in the lateral compartment were enriched for systemic lupus erythematosus (
Real-Time PCR Confirmation
To confirm the results obtained from microarray data, we examined the expression of 4 transcripts that we found to be DE between the medial and lateral compartments. Real-time PCR data confirmed that the expression pattern of all the tested transcripts was similar to microarray data: MMP13 and COL2A1 were elevated in the medial compartment, while SELE and CTSS were elevated in the lateral compartment (
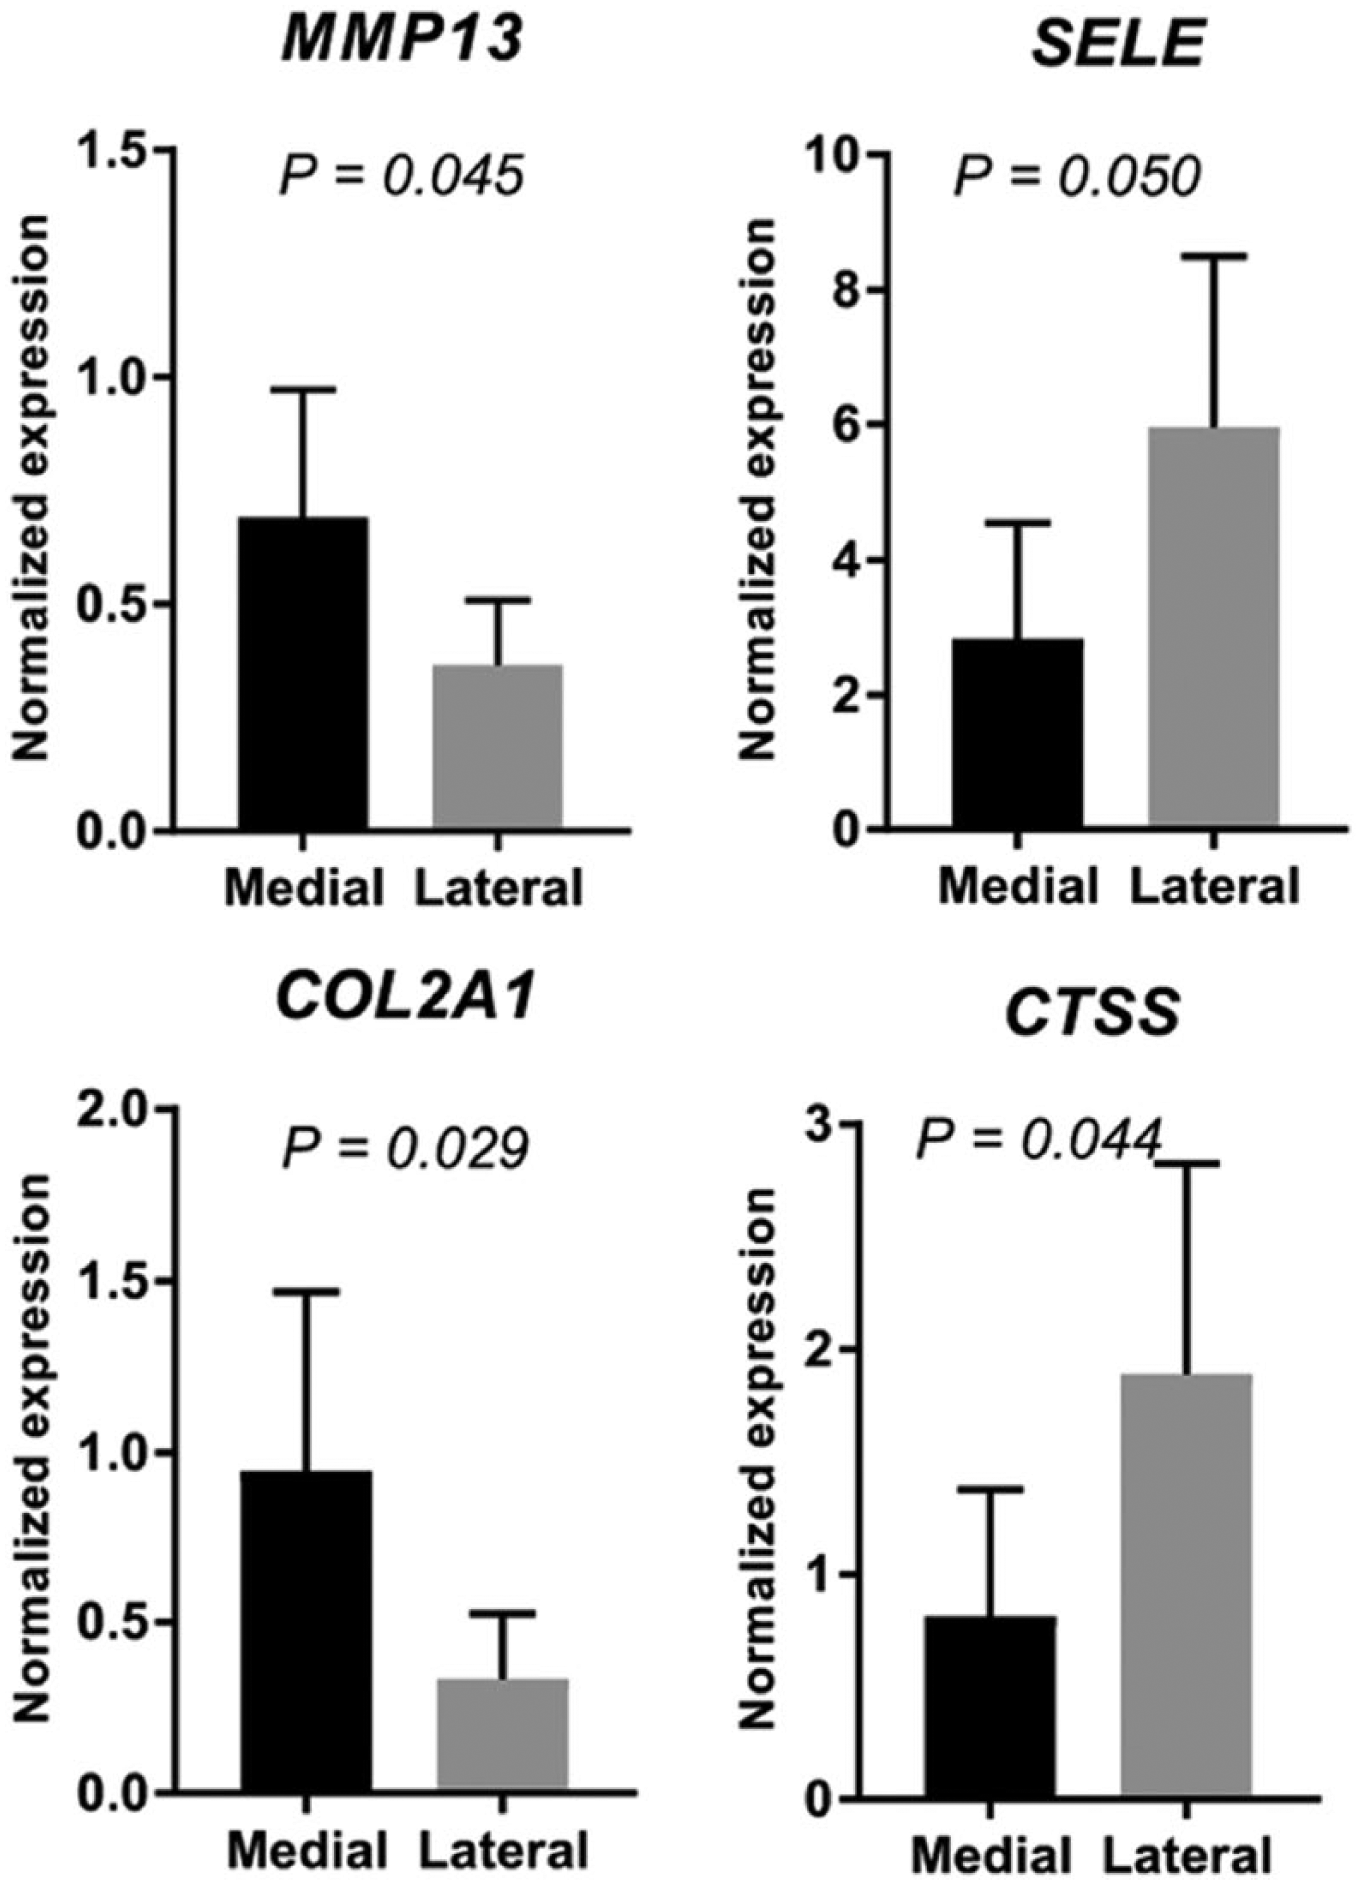
Validation of transcripts by quantitative real-time PCR. The expression of 4 selected genes (MMP13, COL2A1, SELE, and CTSS) was validated with the use of quantitative real-time PCR based on their differential expression between medial and lateral compartments. The expression pattern of all 4 genes was consistent with microarray data. The expression of MMP13 and COL2A1 was significantly higher in the medial compartment and that of SELE and CTSS was lower compared with the lateral compartment. This finding suggests that that the observations made by microarrays represent reliable differences in transcript expression between any 2 comparisons.
Discussion
Molecular differences between the medial and lateral compartments are reflective of the greater severity of OA in the medial compartment. The K-L system better reflected the molecular results than did the Outerbridge. Scoring of cartilage integrity by the Outerbridge scale indicated that the medial and lateral compartments were similar, while scoring by the K-L classification indicated that in most cases the medial compartment was more severely damaged than the lateral compartment.
The most significant findings are the transcript-level differences between the medial and lateral compartments. MMP13, a metalloproteinase, plays a role in cartilage extracellular matrix degradation, highly expressed in OA cartilage, 20 and is a critical target gene during OA progression. 21 COL2A1 is a marker for hyaline cartilage. 22 Interestingly, MMP13 and COL2A1 are upregulated in the medial compartment that had higher K-L score. Other studies have reported increased COL2A1 expression in severely damaged cartilage compared with normal and moderately degenerated specimens, 23 as well as in late-stage OA. 24 Our group has reported an increase in the pre-cartilage splice form of COL2A1, type II pro-collagen 25 currently used as a biomarker for OA progression. 26 These findings suggest an enhanced biosynthesis of COL2A1 in OA cartilage as an anabolic-like response within the degenerative environment.20,27,28
Of note, the processes enriched in the medial compartment were skeletal system development, cartilage development, collagen and proteoglycan metabolism, and matrix organization, most of which have been found to be associated with OA or enriched in (severely) degenerated cartilage.12,13,29 Although mechanistic studies for clarification of these processes and respective transcripts remains to be elucidated, these findings likely indicate an ongoing OA phenotype in the joint. An integrative meta-analysis of DE genes in OA cartilage has shown that immune response was one of the most significantly enriched gene ontologies. 30 Moreover, processes and signaling pathways related to immune response are repressed in the medial compartment of OA-operated mouse knees compared with sham-operated knees. 31 Given that chemokines are important players in RA and OA, they also mediate activation and migration of circulating cells into tissues. 32
We showed that the medial compartment was generally more affected than the lateral compartment. There were 4 cases where the score was the same and only 2 cases in which the severity score was higher in the lateral compartment. The lateral compartment of varus knees (which makes up 85% to 90% of knee replacements) is relatively unaffected in most cases, so gene expression of inflammation or immune response in a relatively unaffected compartment is supportive of an inflammatory or metabolic process in obesity contributing to cartilage degeneration as is generally thought. MMP13 and COL2A1 were highly expressed in the most-affected compartment, similar to medial versus lateral comparison as discussed above. SELE was highly downregulated in the medial compartment and has been shown to be upregulated by IL-1β. 33 In the KEGG pathway analysis, focal adhesion and phagosome pathways were identified to be significant. Both of these pathways have been shown to be enriched for RA and OA,34-36 suggesting their critical role in joint degeneration. Although signaling pathways enriched for alcoholism and tuberculosis appear to be unrelated to cartilage degeneration, they have been found to be significantly enriched for RA or OA in other studies.35,37
The gene expression differences between medial and lateral tibial plateau cartilage imply that these differences are more pertinent to K-L score than Outerbridge score. However, given the fact that K-L system has low sensitivity for describing specific radiographic changes, localizing these changes and for describing subtle knee OA phenotypes, we realize that this system takes into account joint space narrowing, osteophyte severity and location, and bone sclerosis. Therefore, overall K-L score reflects combined severity in these individual components. Basically, all of the arthritic compartments were advance grade in the involved compartment (medial side in varus knees, lateral side in valgus knees) and thus grade 3 or 4 on K-L, and all less involved compartments were a grade or more less involved. In contrast, Outerbridge classification is a grading system for joint cartilage breakdown and dictates that the worst area is assigned the grade. 15
Interestingly, we show that BMI has a distinct and differential impact on medial and lateral compartments despite the fact that cartilage from both compartments had similar Outerbridge score but different K-L score. The Outerbridge score is based on visual assessment and assigns the rating to the most-affected area of cartilage damage, even if it is just millimeters in size. In contrast, the K-L score is a radiographic score, and in this study, these were all weight-bearing X-rays such that the K-L score gives a more global assessment of the status of an entire compartment rather than assigning the highest score possible often based on small areas of focal damage.
Limb alignment (the varus-valgus angle) influences the differential loading of medial versus lateral compartments and implies that it can mediate OA development in obese patients. BMI is correlated with severity of OA in patients with varus, but not valgus, aligned limbs. 38 As we observed that the medial compartment transcriptomic changes were more consistent with BMI than the lateral compartment changes, it appears to support that the correlation of BMI with OA severity is mainly accounted for by varus limb malalignment. These observations are further strengthened by the findings that the effect of BMI on OA progression relies on limb alignment. 39 Thus, it is likely that local biomechanical factors mediate both the onset and progression of OA associated with obesity and this response is dependent on limb alignment.
Transcripts elevated with obesity in the medial compartment were enriched for metabolic processes including blood pressure. It is commonly appreciated that obesity likely leads to OA through systemic factors (adipokines, inflammatory signaling), accumulated micro-trauma, and through disruption of chondrocyte metabolism.3,40,41 This is in line with an in vitro study where it has been shown that chondrocyte metabolism (increased glycosaminoglycan production) increases with BMI. 42 Also, it has been shown that a high-fat diet 43 as well as intermittent “over” loading 41 instigate metabolic changes in murine chondrocytes. 44 Although cellular metabolism has been widely studied in other systems, its involvement in joints has also been largely appreciated in conjunction with aging. 45 It is thought that increased cellular metabolism leads to production of reactive oxygen species, 46 which in turn exert deleterious effects on cartilage leading to its degeneration and progression to OA as well as play key roles in altering the intracellular signaling mechanisms. 47 Thus, it is likely that obesity disrupts chondrocyte homeostasis (as evident by increased metabolic activities), which leads to joint degeneration. Some studies have identified a significant association of OA with cardiovascular risk factors,48,49 including blood pressure. 50 However, it remains elusive how obesity affects metabolic processes related to blood pressure in the onset and/or progression of OA. Given the role of metabolic and inflammatory factors, patients with diabetes and RA were excluded so we are looking at obesity in the absence of a known inflammatory or metabolic disease (although obesity itself is probably a metabolic disease). Furthermore, we did not treat obese and nonobese patients differently in any way regarding medication, blood loss, or other protocols. Finally, processes related to cell migration indicate cell proliferation, which is known to increase in OA joints. 51 In a prior study in meniscus, we have similar findings in which the aforementioned processes were repressed with obesity, 18 suggesting that it affects the gene expression profile that ties mechanics to biology.
We show that immune response was enriched for genes elevated with BMI in the lateral compartment. This functional attribute has been found to be enriched in aging 17 and injured cartilage tissues. As obesity is considered to exacerbate inflammation, our findings imply that increased BMI likely initiates local immune responses, resulting in increased inflammation in the joint. The biological processes that were repressed with obesity in the lateral compartment were mainly G-protein-coupled receptor signaling and sensory perception to chemical stimulus. G-protein-coupled receptor signaling perceives various extracellular signals including chemical stimulus and transduce them to heterotrimeric G-proteins, which then transduce these signals to appropriate effectors. 52 As the processes related to G-protein-coupled receptor signaling are activated by energy metabolism, 53 their suppression in obese patients in our analysis likely suggests that energy metabolism is low in overweight individuals; therefore, these biological processes are not activated in the cartilage. Some of the G-protein-coupled receptors (e.g., receptor 40) are regarded as important targets to counteract inflammation and cartilage degeneration. 53 Therefore, their suppression in obesity implies that there is likely increased inflammation and degeneration in the cartilage in obese individuals. Some other receptors such as receptor 55 are directly involved with obesity, as deficiency of this receptor is known to promote obesity. 54 Taken together, these findings suggest that G-protein-coupled receptor signaling plays an important role in linking obesity with OA. Furthermore, these findings support the notion that obesity exerts deleterious effects on the articular cartilage beyond simple mechanics. Literature on signaling pathways significantly enriched in obese and overweight patients (by KEGG pathway analysis) is scarce, and further investigation into the role of these signaling pathways in context of both obesity and OA is warranted. Nevertheless, a recent paper, however, has identified 7 genes that were enriched for olfactory transduction pathway, with potential involvement of this pathway in RA disease progression. 55
Considering the limitation that only 3 patients were overweight and none lean, and given the important differences between overweight and obese patients, and the fact that all overweight patients had the same BMI, we believe that the limitation of relatively few overweight patients or absence of lean patients had a moderate effect on our experimental design and statistical modeling. In a prior study on meniscus transcript profiling in relation to obesity, we observed that the largest difference in gene expression was between overweight (BMI = 25.0-29.9 kg/m2) and obese (BMI > 30.0 kg/m2) patients compared with both lean (BMI < 24.9 kg/m2) versus overweight and lean versus obese. 18 This observation may indicate that there is a weight threshold that changes tissue’s molecular response. Another limitation is the unavailability of normal cartilage in the present analysis. Because our focus was to determine the BMI-related changes in OA knees as well as between lateral and medial compartments, we believe future studies can compare these findings with normal cartilage using a matched patient cohort. However, given the association between obesity, cartilage degeneration, and OA, the present approach may be the optimal model to study this relationship. Last, it is likely that many unknown and unmeasured confounders such as rate of OA development, loading history, and exercise may have contributed to some of the gene expression differences reported in this study. While we did not have any data on the aforementioned confounders, we did have information on 2 important covariates, namely, age and sex, and they were included in the model. Nonetheless, in a future study with larger sample size and where data on other confounders are available, it would be interesting to see the impact of these variables on obesity-related differences.
In summary, RNA microarrays identified a number of important genes, biological processes, and pathways between the medial and lateral compartments. Moreover, these analyses informed us about the important differences between medial and lateral tibial articular cartilage from the same knee as well as about the transcriptomic differences in scoring system. Finally, concerning BMI, the most interesting findings are the differential impact of BMI on the medial and lateral compartments. Thus, these findings support the molecular interaction between obesity and OA and suggest that BMI is an important determinant of transcript-level changes in the cartilage from the medial and lateral compartments of the same knee.
Supplemental Material
Supplemental_Fig_1 – Supplemental material for A Microarray Study of Articular Cartilage in Relation to Obesity and Severity of Knee Osteoarthritis
Supplemental material, Supplemental_Fig_1 for A Microarray Study of Articular Cartilage in Relation to Obesity and Severity of Knee Osteoarthritis by Muhammad Farooq Rai, Linda J. Sandell, Toby N. Barrack, Lei Cai, Eric D. Tycksen, Simon Y. Tang, Matthew J. Silva and Robert L. Barrack in CARTILAGE
Supplemental Material
Supplemental_Fig_2 – Supplemental material for A Microarray Study of Articular Cartilage in Relation to Obesity and Severity of Knee Osteoarthritis
Supplemental material, Supplemental_Fig_2 for A Microarray Study of Articular Cartilage in Relation to Obesity and Severity of Knee Osteoarthritis by Muhammad Farooq Rai, Linda J. Sandell, Toby N. Barrack, Lei Cai, Eric D. Tycksen, Simon Y. Tang, Matthew J. Silva and Robert L. Barrack in CARTILAGE
Supplemental Material
Supplemental_Fig_3 – Supplemental material for A Microarray Study of Articular Cartilage in Relation to Obesity and Severity of Knee Osteoarthritis
Supplemental material, Supplemental_Fig_3 for A Microarray Study of Articular Cartilage in Relation to Obesity and Severity of Knee Osteoarthritis by Muhammad Farooq Rai, Linda J. Sandell, Toby N. Barrack, Lei Cai, Eric D. Tycksen, Simon Y. Tang, Matthew J. Silva and Robert L. Barrack in CARTILAGE
Supplemental Material
Supplemental_Fig_4 – Supplemental material for A Microarray Study of Articular Cartilage in Relation to Obesity and Severity of Knee Osteoarthritis
Supplemental material, Supplemental_Fig_4 for A Microarray Study of Articular Cartilage in Relation to Obesity and Severity of Knee Osteoarthritis by Muhammad Farooq Rai, Linda J. Sandell, Toby N. Barrack, Lei Cai, Eric D. Tycksen, Simon Y. Tang, Matthew J. Silva and Robert L. Barrack in CARTILAGE
Supplemental Material
Supplemental_Fig_5 – Supplemental material for A Microarray Study of Articular Cartilage in Relation to Obesity and Severity of Knee Osteoarthritis
Supplemental material, Supplemental_Fig_5 for A Microarray Study of Articular Cartilage in Relation to Obesity and Severity of Knee Osteoarthritis by Muhammad Farooq Rai, Linda J. Sandell, Toby N. Barrack, Lei Cai, Eric D. Tycksen, Simon Y. Tang, Matthew J. Silva and Robert L. Barrack in CARTILAGE
Supplemental Material
Supplemental_Fig_6 – Supplemental material for A Microarray Study of Articular Cartilage in Relation to Obesity and Severity of Knee Osteoarthritis
Supplemental material, Supplemental_Fig_6 for A Microarray Study of Articular Cartilage in Relation to Obesity and Severity of Knee Osteoarthritis by Muhammad Farooq Rai, Linda J. Sandell, Toby N. Barrack, Lei Cai, Eric D. Tycksen, Simon Y. Tang, Matthew J. Silva and Robert L. Barrack in CARTILAGE
Supplemental Material
Supplemental_Fig_7 – Supplemental material for A Microarray Study of Articular Cartilage in Relation to Obesity and Severity of Knee Osteoarthritis
Supplemental material, Supplemental_Fig_7 for A Microarray Study of Articular Cartilage in Relation to Obesity and Severity of Knee Osteoarthritis by Muhammad Farooq Rai, Linda J. Sandell, Toby N. Barrack, Lei Cai, Eric D. Tycksen, Simon Y. Tang, Matthew J. Silva and Robert L. Barrack in CARTILAGE
Supplemental Material
Supplemental_Fig_8 – Supplemental material for A Microarray Study of Articular Cartilage in Relation to Obesity and Severity of Knee Osteoarthritis
Supplemental material, Supplemental_Fig_8 for A Microarray Study of Articular Cartilage in Relation to Obesity and Severity of Knee Osteoarthritis by Muhammad Farooq Rai, Linda J. Sandell, Toby N. Barrack, Lei Cai, Eric D. Tycksen, Simon Y. Tang, Matthew J. Silva and Robert L. Barrack in CARTILAGE
Supplemental Material
Supplemental_Table_1_R1_6.19.18 – Supplemental material for A Microarray Study of Articular Cartilage in Relation to Obesity and Severity of Knee Osteoarthritis
Supplemental material, Supplemental_Table_1_R1_6.19.18 for A Microarray Study of Articular Cartilage in Relation to Obesity and Severity of Knee Osteoarthritis by Muhammad Farooq Rai, Linda J. Sandell, Toby N. Barrack, Lei Cai, Eric D. Tycksen, Simon Y. Tang, Matthew J. Silva and Robert L. Barrack in CARTILAGE
Supplemental Material
Supplemental_Table_2_R1_6.19.18 – Supplemental material for A Microarray Study of Articular Cartilage in Relation to Obesity and Severity of Knee Osteoarthritis
Supplemental material, Supplemental_Table_2_R1_6.19.18 for A Microarray Study of Articular Cartilage in Relation to Obesity and Severity of Knee Osteoarthritis by Muhammad Farooq Rai, Linda J. Sandell, Toby N. Barrack, Lei Cai, Eric D. Tycksen, Simon Y. Tang, Matthew J. Silva and Robert L. Barrack in CARTILAGE
Supplemental Material
Supplemental_Table_3_R1_6.19.18 – Supplemental material for A Microarray Study of Articular Cartilage in Relation to Obesity and Severity of Knee Osteoarthritis
Supplemental material, Supplemental_Table_3_R1_6.19.18 for A Microarray Study of Articular Cartilage in Relation to Obesity and Severity of Knee Osteoarthritis by Muhammad Farooq Rai, Linda J. Sandell, Toby N. Barrack, Lei Cai, Eric D. Tycksen, Simon Y. Tang, Matthew J. Silva and Robert L. Barrack in CARTILAGE
Supplemental Material
Supplemental_Table_4_R1_6.19.18 – Supplemental material for A Microarray Study of Articular Cartilage in Relation to Obesity and Severity of Knee Osteoarthritis
Supplemental material, Supplemental_Table_4_R1_6.19.18 for A Microarray Study of Articular Cartilage in Relation to Obesity and Severity of Knee Osteoarthritis by Muhammad Farooq Rai, Linda J. Sandell, Toby N. Barrack, Lei Cai, Eric D. Tycksen, Simon Y. Tang, Matthew J. Silva and Robert L. Barrack in CARTILAGE
Footnotes
Author Contributions
All authors were involved in drafting and revision of the manuscript, and all authors approved the final version to be published. Dr. Rai had full access to all the data in the study and takes responsibility for the integrity of the data and the accuracy of the data analysis.
Study conception and design: R. Barrack, Sandell, Silva, Tang, Rai.
Acquisition of data: Rai, Cai, R. Barrack, T. Barrack.
Analysis and interpretation of data: Rai, Tang, Silva, Cai, Sandell, R. Barrack, T. Barrack, Tycksen.
Acknowledgments and Funding
We thank Staci Johnson and Jenny Liu for help with sample collection. Funding for this study was provided by the Washington University Orthopaedic Research Funds to Dr. Barrack. Additional support was provided by grants from the National Institutes of Arthritis and Musculoskeletal and Skin Diseases (NIAMS), National Institutes of Health (NIH): R01 AR063757 (PI: L. J. Sandell), P30 AR057235 (Musculoskeletal Research Center, PI: L. J. Sandell), R00 AR064837 (PI: M. F. Rai). The content of this publication is solely the responsibility of the authors and does not necessarily represent the official views of the NIH or the NIAMS.
Declaration of Conflicting Interests
The author(s) declared no potential conflicts of interest with respect to the research, authorship, and/or publication of this article.
Ethical Approval
The Institutional Review Board (IRB, Human Research Protection Office) of Washington University approved the study (IRB Approval No. 201404093).
Informed Consent
Written informed consent was obtained from all participants.
Supplemental Material
Supplemental material for this article is available online.
References
Supplementary Material
Please find the following supplemental material available below.
For Open Access articles published under a Creative Commons License, all supplemental material carries the same license as the article it is associated with.
For non-Open Access articles published, all supplemental material carries a non-exclusive license, and permission requests for re-use of supplemental material or any part of supplemental material shall be sent directly to the copyright owner as specified in the copyright notice associated with the article.