
Abstract
Objective:
The aim of this study was to determine if the noninvasive or minimally invasive and nondestructive imaging techniques of quantitative T2-mapping or multiphoton microscopy (MPM) respectively, could detect differences in cartilage collagen orientation similar to polarized light microscopy (PLM). It was hypothesized that MRI, MPM, and PLM would all detect quantitative differences between repair and normal cartilage tissue.
Methods:
Osteochondral defects in the medial femoral condyle were created and repaired in 5 mature goats. Postmortem, MRI with T2-mapping and histology were performed. T2 maps were generated and a mean T2 value was calculated for each region of interest. Histologic slides were assessed using MPM with measurements of autocorrelation ellipticity, and by PLM with application of a validated scoring method. Collagen orientation using each of the 3 modalities (T2-mapping, MPM, and PLM) was measured in the center of the repair tissue and compared to remote, normal cartilage.
Results:
MRI, MPM, and PLM were able to detect a significant difference between repair and normal cartilage (n = 5). The average T2 value was longer for repair tissue (41.43 ± 9.81 ms) compared with normal cartilage (27.12 ± 14.22 ms; P = 0.04); MPM autocorrelation ellipticity was higher in fibrous tissue (3.75 ± 1.17) compared with normal cartilage (2.24 ± 0.51; P = 0.01); the average PLM score for repair tissue was lower (1.6 ± 1.02) than the score for remote normal cartilage (4.4 ± 0.42; P = 0.002). The strongest correlation among the methods was between MRI and PLM (r = −0.76; P = 0.01), followed by MPM and PLM (r = −0.58; P = 0.08), with the weakest correlation shown between MRI and MPM (r = 0.35; P = 0.31).
Conclusion:
All 3 imaging methods quantitatively measured differences in collagen orientation between repair and normal cartilage, but at very different levels of resolution. PLM is destructive to tissue and requires euthanasia, but because MPM can be used arthroscopically, both T2-mapping and MPM can be performed in vivo, offering nondestructive means to assess collagen orientation that could be used to obtain longitudinal data in cartilage repair studies.
Introduction
Structurally, articular cartilage is divided into 4 zones: superficial (tangential), intermediate (transitional), deep (radial), and calcified zones. Each zone is characterized by distinct extracellular matrix organization and composition, resulting in differing mechanical properties that are critical to normal mechanical function of a diarthrodial joint.1,2 Collagen organization in the superficial zone is characterized by fine fibrils running parallel to the joint surface. 3 This arrangement becomes more random through the intermediate zone and then more organized again where fibrils align perpendicular to the joint surface within the deep zone and calcified cartilage regions. 4 Collagen fibrils of articular cartilage are also specifically arranged depending on their proximity to chondrocytes as observed with electron microscopy. 5 It is the distinct collagen structure across these zones that provide healthy articular cartilage with the ability to appropriately dissipate the tension and shear under joint loading and motion. 6 For example, vertical fibrils play a crucial role in protecting articular cartilage from large tensile/shear strains, especially at the junction of cartilage with subchondral bone where peak strains occur following load. Superficial horizontal fibrils, on the other hand, protect the tissue mainly from excessive strains and distortions under physiological compression loads.7,8 Evaluation of cartilage collagen orientation following a cartilage repair procedure is an important component in measuring the quality and estimating the functionality of repair tissue and therefore assessing a reparative technique.
The perceived gold standard for evaluation of cartilage collagen orientation has been polarized light microscopy (PLM) using any of the available several scoring systems.9-12 It is widely used, primarily because of the simplicity of the method, which only requires paraffin-embedded histological specimens and a microscope with 2 optical polarizing filters. In PLM, light is linearly polarized before contact with the specimen. Highly oriented collagen fibrils are birefringent (defined by a refractive index that varies with the fibril orientation), altering the transmitted light polarization. The analyzer, set cross to the polarizer, only transmits light from birefringent regions, imparting information on the organization and quantity of collagen and the diameter of the collagen fibrils in the specimen.13-20
PLM is performed on histologic samples and is therefore destructive to the repair tissue if a biopsy is obtained or to the animal if euthanasia is performed for tissue assessment. Despite these shortcomings, it is still commonly utilized to quantitatively study repair cartilage because of its availability, efficacy, and reliability. PLM has also been used to validate other collagen imaging techniques such as optical coherence tomography (OCT), MRI, and multiphoton microscopy (MPM).19,21-24
Quantitative T2-mapping (T2 MRI) is a method for measuring collagen orientation in vivo and can be performed using clinically relevant magnetic fields. 25 MRI is increasingly being considered a surrogate marker of cartilage biochemistry although arguments can be made to support MRI as a primary outcome measure for cartilage assessment. 26 As compared with histology, MRI has the obvious advantage of being noninvasive and nondestructive, allowing it to be used in clinical settings and in laboratory animal studies to obtain longitudinal data. T2-mapping has shown high levels of accuracy in detecting cartilage degeneration when validated against the suitable standard of PLM. 27 The T2 relaxation time of hyaline cartilage has been shown to correlate with anisotropy of the collagen meshwork and is therefore highly sensitive to alterations of the collagen orientation seen with degeneration.25,27,28 Cartilage pathology manifests as a prolongation of T2 values due to imbibition with water and disruption of the ordered collagen matrix.29-32 Changes in T2 relaxation time have been related to changes in articular cartilage constitution with respect to presence and orientation of collagen.33-35
MPM allows acquisition of information regarding collagen structure but also offers resolution of tissue at the cellular level. 36 MPM analyzes a thin raster-scanned plane via localized nonlinear excitation of either fluorescence or second-harmonic generation (SHG) at the beam focus. For thick tissue imaging, this form of laser scanning microscopy has become the fluorescence microscopy practice of choice. 37 It has the capacity to penetrate to a greater depth than confocal microscopy and can provide resolution at the cellular or subcellular level with constituent specificity.38,39 SHG in MPM is the nonlinear equivalent of reflected light confocal. Second harmonic emits from wavelength-scale highly anisotropic structures such as collagen fibrils, providing the ability to image unlabeled collagen networks with micron-scale precision.36,37 Polarization effects with this technique are similar to those with PLM, with the hyperpolarizability matrix as the nonlinear equivalent of birefringence. 40 To simplify quantification of MPM images, the beam is often circularly polarized at the specimen, ensuring that the amount of emitted SHG signal is the same for any lateral fibrillar orientation. 41 Unlike conventional microscopy, these imaging capacities of MPM can be used without tissue sectioning, exogenous dyes, or fluorescent staining, giving rise to its use in a variety of applications, including several forms of in vivo studies, including studies of cell metabolism, tissue morphology, Alzheimer’s disease, and cancer.36,37,39 In close relation to the present study, MPM has been used for studies of collagen and elastin fiber networks in arteries and heart valves, changes in collagen matrices, evaluations of live, intact normal and pathological articular cartilage, and has also been proposed to have potential for studying the chondrocyte–matrix interactions that lead to joint disease.37-39,42-44 As these studies have shown, MPM is a proven strategy for imaging intact tissue. Additionally, there have been numerous implementations for MPM using small endoscopic optics with implications to medical diagnostics.45-48 With an envisioned MPM implementation similar to a conventional arthroscope, this method would be more invasive than MRI, but like PLM, it would yield cellular-scale resolution without the need for fixing, sectioning, and staining that is required for PLM.
There are no comparative studies evaluating collagen orientation in normal and repair cartilage to indicate which of the available techniques is acceptable for assessing collagen orientation following cartilage repair procedures. The objective of this study was to compare the quantitative capacities of T2-mapping and MPM to PLM in measuring differences of collagen fibril orientation between repair and normal articular cartilage. The hypothesis was that all 3 methods would be similar in their ability to quantitatively assess differences in collagen orientation. Because all 3 methods measure collagen orientation, if gold standard PLM revealed a difference between normal and repair cartilage, and MRI and MPM also detected a difference, then the hypothesis would be validated. If the hypothesis was correct, then the less invasive and nondestructive methods, MRI or MPM, could potentially compliment PLM for assessments of collagen fibril orientation.
Materials and Methods
Specimens
Histological sections and MRI data from 9 goats that had osteochondral defects created and repaired as part of another study 49 were evaluated. In each goat, a single 6 mm × 6 mm cylindrical defect was created unilaterally in the central weightbearing aspect of the medial femoral condyle using a trephine tool. Defects were filled with a 6 mm × 6 mm porous acellular scaffold composed of ceramic, synthetic polymer, and type I collagen. After 18 months, the animals were euthanized and MRI was performed. Osteochondral sections, including the repaired defect and surrounding host tissue, were then removed, fixed in 10% neutral buffered formalin, embedded in paraffin, and sectioned at 8 µm. Hematoxylin and eosin–stained sections from all animals were reviewed and sections from 5 animals were selected for inclusion in this study. Two authors (KAR, LAF) reviewed the histologic sections and selected all of those that were considered good histologic sections (entire defect included on slide, minimal sectioning artifact) and with a subjectively visible difference in repair and host cartilage tissue on microscopic evaluation of hematoxylin and eosin–stained sections, in an effort to optimize the potential for observing a difference in normal and abnormal tissues when present.
Magnetic Resonance Imaging
MRI of the femorotibial joint was conducted on a 3 Tesla clinical system (GE Healthcare, Milwaukee, WI) using an 8-channel knee coil (Invivo, Waukesha, WI). Morphologic imaging was performed using a cartilage-sensitive fast spin echo sequence that has been previously validated for cartilage assessment in nonclinical models, obtained in the sagittal and coronal planes.27,50 These were acquired with repetition time (TR) of 3500 to 6000 ms, echo time (TE) of 20 to 30 ms (effective), field of view of 10 to 11 cm, and matrix of 512 × 512, providing a minimum spatial resolution of 195.3 µm in both the frequency and phase directions, and slice resolution of 1.2 mm with no gap, at 3 excitations. A wide receiver bandwidth of 62.5 kHz was used over the entire frequency range. The organized collagen environment of hyaline cartilage demonstrates a dependence of T2 relaxation times on its orientation to the main magnetic field (Bo). At 54.70 to Bo, nuclear dipole interactions reach zero and there is a prolongation of T2 relaxation times when short TEs are used. The cartilage measured in this study was sampled from regions ranging from approximately 0° to 25° from Bo to minimize magic angle effect. Caution was used to avoid sampling directly at the magic angle.
Quantitative T2-mapping (GE Healthcare, Milwaukee, WI) was performed using a multislice, multiecho modified Carr Purcell Meiboom Gill (CPMG) pulse sequence that uses interleaved slices and tailored refocusing pulses to minimize contribution from stimulated echoes. 25 Standard T2-mapping pulse sequence parameters used were a TR of 800 ms, 8 sampled echoes using sequential multiples of the first echo time (9-10 ms), field of view of 12 cm2, and matrix of 384 × 256, providing a minimum in-plane resolution of 312.5 µm in the frequency direction by 468.8 µm in the phase direction and slice resolution of 2.0 mm2 with no gap, at 2 excitations. A receiver bandwidth of 62.5 kHz was used. Quantitative T2 relaxation times were calculated on a pixel-by-pixel basis by fitting the echo time to the corresponding signal intensity data (Functool 3.1, GE Healthcare, Milwaukee, WI) using a mono-exponential decay equation: SI(TE)=S0 * exp(−TE/T2), where TE is the echo time, SI(TE) is the signal intensity at the corresponding echo time, S0 is the apparent proton density, and T2 is the transverse relaxation time constant. Standardized regions of interest (ROIs) of 2 mm were created at the site of the defect and at a location 0.8 to 1.0 cm anterior to the repair at an angle of approximately 20° to 25° to Bo taking care to avoid imaging at the magic angle ( Figure 1 ). While zonal (deep and superficial halves) ROI sampling of the cartilage is much preferred, the thickness of the repair cartilage (<1 mm) precluded zonal analysis and mean values were obtained.
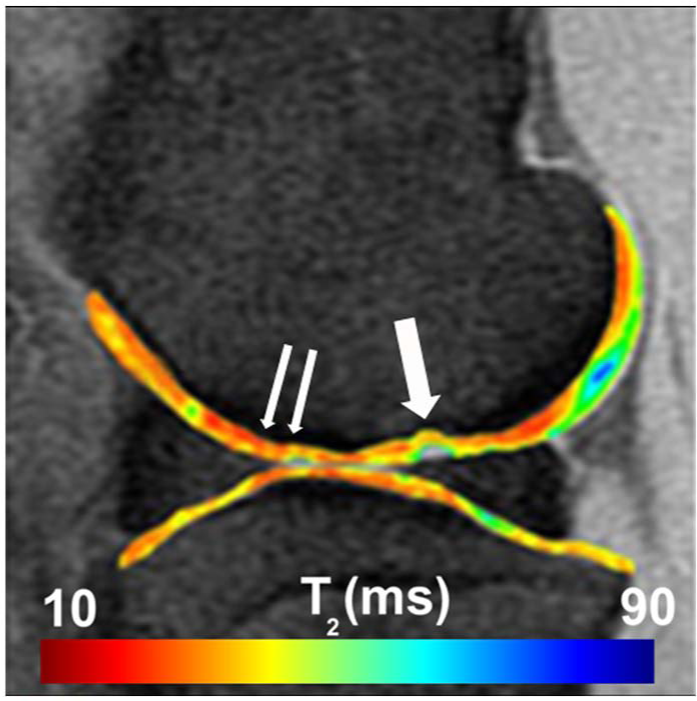
Sagittal quantitative T2-mapping of the stifle joint performed on a clinically relevant field strength (3 T) MRI unit. Regions of interest were assessed centrally within the defect (single arrow) and remote to the defect (double arrow).
Multiphoton Microscopy
One of the advantages of MPM is the ability to extract detailed images from thick, intact tissues, as it can be applied arthroscopically. MPM can image up to 2 µm in depth, but the type of lens used for arthroscopic MPM would dictate the resolution. The MPM system used in the present study had equivalent arthroscopic resolution potential. However, for direct comparison with PLM, paraffin-embedded sections were imaged. They were covered with 23 mm × 23 mm alphanumeric photo-etched gridded cover slips (Electron Microscopy Sciences, Hatfield, PA) to provide a reference for each region of interest. The glass slides were etched along the edges of the cover slips with a carbon-tipped pencil (General Tools and Instruments, New York, NY) to ensure consistent placement of the gridded slips after histologic processing and during subsequent PLM imaging.
For MPM imaging, a previously described, custom-built microscope was used. 51 Briefly, 760-nm illumination from an ultrafast MaiTai Ti:sapphire laser (SpectraPhysics, Mountain View, CA) was scanned with a BioRad MRC600 laser scanner, directed into an Olympus IX-70 inverted microscope, and focused with a 20x/0.75 Zeiss Fluar objective lens. A Berek polarization compensator (New Focus 5540, Santa Clara, CA) placed in the beam before the scanner was adjusted for circular polarization of the illumination at the specimen. Nonlinear emissions were collected in epi mode and separated from the excitation beam directly after the objective with a 670DCXXRU longpass dichroic filter (Chroma Technology, Rockingham, VT). Emission filters were chosen for an ultraviolet (350-400 nm for collagen SHG) and blue (520-550 nm for autofluorescence) separation (UG11+IR and BGG22 filters with a separating 410DCLP dichroic, Chroma Technology). The resulting 2 emission channels were collected with HC125-02 bialkali photomultiplier tube assemblies (Hamamatsu, Hamamatsu City, Japan) directed into the external ports of the BioRad acquisition electronics, and pseudo-colored as grayscale and green, respectively. All images were acquired with the same laser power and photomultiplier tube gain. Image analysis was accomplished using custom-written software within the IDL visualization and analysis environment (ITT Visual Information Systems, Boulder, CO). For determining ellipticity, standard 2-dimensional image autocorrelations were calculated from the SHG images, in which each pixel represents the strength of the image correlation at different length scales within the image. The central pixel in the autocorrelation is always a maximal value, representing the strength at the 0-shift limit. A curve is fit to the autocorrelation surface identifying the full width at half maximum with respect to this maximal 0-shift limit. This autocorrelation ellipticity method has been previously applied.45,52 The autocorrelation ellipticity is then defined as the ratio of the maximum to minimum radius of this curve (a unitless measurement). Higher ellipticity values are indicative of correlation values that are different along different directions of the image. They indicate more fibrous collagen or collagen fibrils that are thicker or more aligned. Collagen of that nature is associated with repair cartilage, as collagen type II maintains a thinner web-like structure.
ROIs were defined as central repair tissue and remote normal cartilage. Remote cartilage was considered as that located 1cm from the center of the defect. Four images were obtained at each designated ROI, starting at the surface of the tissue and progressing to but not including the subchondral bone. Only the second images, one image deep from the superficial edge and within the tangential zone of cartilage, were analyzed. These second images were chosen because they did not contain empty space or subchondral bone, which would cause anomalous results in the automated image analysis routine. The remaining images were used as references to confirm that the same location within the tissue was compared between imaging modalities. Grid coordinates on the cover slips and distance between images were also recorded for each image, providing additional methods for identifying the same ROIs in subsequent PLM. The entire cartilage surface was inspected with bright field microscopy before MPM was performed to ensure repair region location. Surfaces were further examined with bright field microscopy before imaging each ROI to ensure proper navigation between ROIs.
Polarized Light Microscopy
Following MPM, the same tissue sections were deparaffinized and cover-slipped with the same alphanumeric photo-etched gridded cover slips used for MPM to record the same ROIs used in MPM imaging. Each unit of the grid was 0.6 mm × 0.6 mm. PLM images were taken at the same place as during MPM to make direct comparisons between imaging modalities.
An ordinal scoring method recently validated for assessment of cartilage collagen organization was used.9,52 Scores of 0 to 5 were assigned based on the presence of properly organized collagen fibrils in the superficial zone (SZ), transitional zone (TZ), and deep zone (DZ) with 5 being normal. A score of 5 was assigned to samples with parallel orientation of fibrils in the SZ, distinct zones of uniform birefringence, separated by a more randomly oriented, less birefringence TZ, and perpendicular orientation of collagen fibrils in the DZ. Conversely, a score of 0 was given for sparse bright patches throughout the specimen, and randomly oriented fibrils with no indication of appropriate alignment in the SZ and DZ. Features constituting a score greater than 3 were associated with normal native cartilage, a score of 3 indicated a highly successful cartilage repair, whereas a score of less than 3 was given to more granular, fibrocartilage repair tissue.
Statistical Analyses
One-sample t tests were performed to determine if each of the 3 techniques (T2-mapping, MPM, PLM) could detect a difference between central repair and remote normal cartilage measurements. For each measurement technique, values are reported as the mean of n = 5 ± SD. A value of P ≤ 0.05 was considered significant. Spearman rank correlations were performed to assess the strength of the relationship between those imaging techniques that could detect a difference between central repair and remote normal cartilage measurements as determined by the one-sample t tests. To assess interreader reliability for the PLM scoring method, a Spearman rank correlation and a McNemar’s χ2 test were performed to assess the significance of agreement between readers above that of chance alone. A kappa coefficient was also calculated to quantify the magnitude of agreement. Intraclass correlation coefficient for agreement (ICC) was also calculated to assess interreader reliability for any one reader’s score and the reliability of the mean score between all readers. Both parametric and nonparametric analyses were used because of the fact that some of the data were continuous and some were ordinal (i.e., the PLM scoring system).
ICC was calculated using Statistical Package for the Social Sciences (SPSS) statistics software version 20.0 (IBM Corporation, Armonk, NY). All other statistical analyses were performed using Statistix 9.0 (Analytical Software, Tallahassee, FL).
Results
A difference between repair and normal tissue was evident with all 3 imaging modalities. The repair tissue was histologically fibrocartilaginous with incomplete restoration of normal cartilage matrix composition and/or architecture ( Figure 2 ). Surrounding tissue appeared normal with respect to matrix and cellular organization and content.
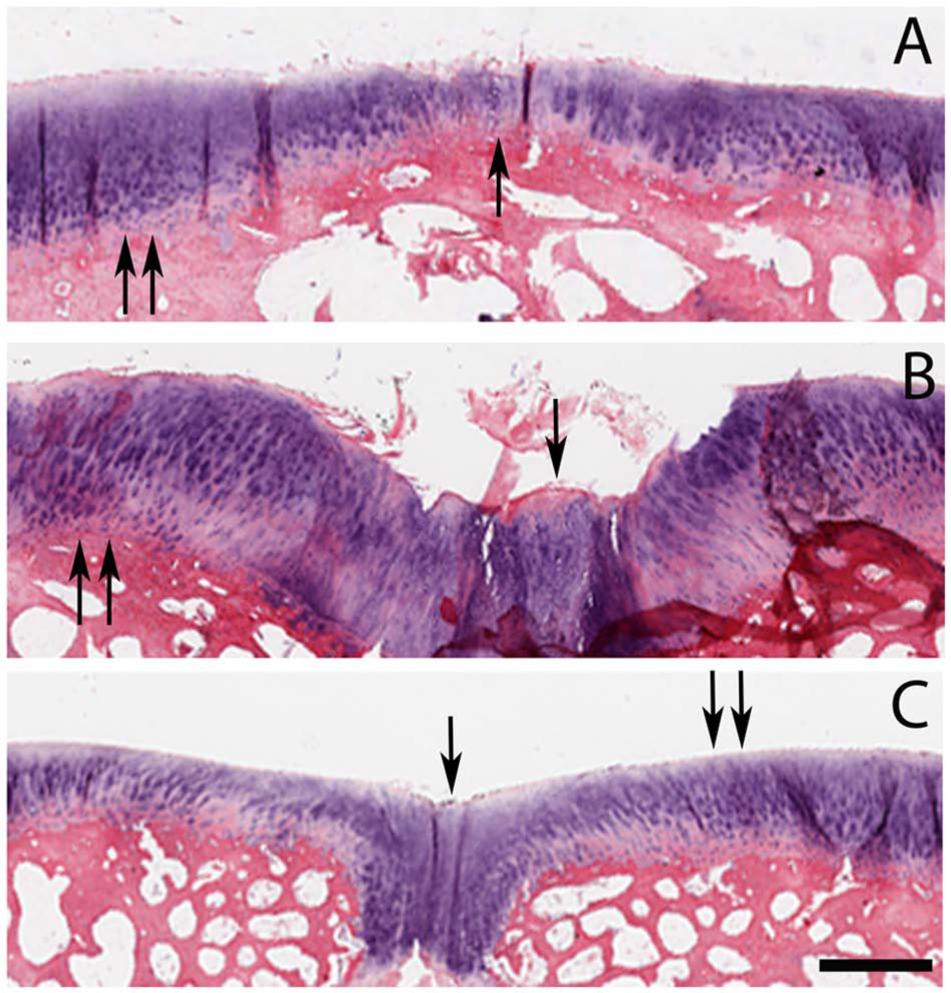
Axial plane histologic sections (hematoxylin and eosin) of cartilage repair region from 3 animals (
Magnetic Resonance Imaging
Quantitative T2-mapping indicated increased collagen organization in normal cartilage compared with repair tissue as indicated by a decreased mean T2 relaxation time (P = 0.04). The average T2 value was longer for repair tissue (41.43 ± 9.81 ms) compared with normal cartilage (27.12 ± 14.22 ms; Figure 3 ).
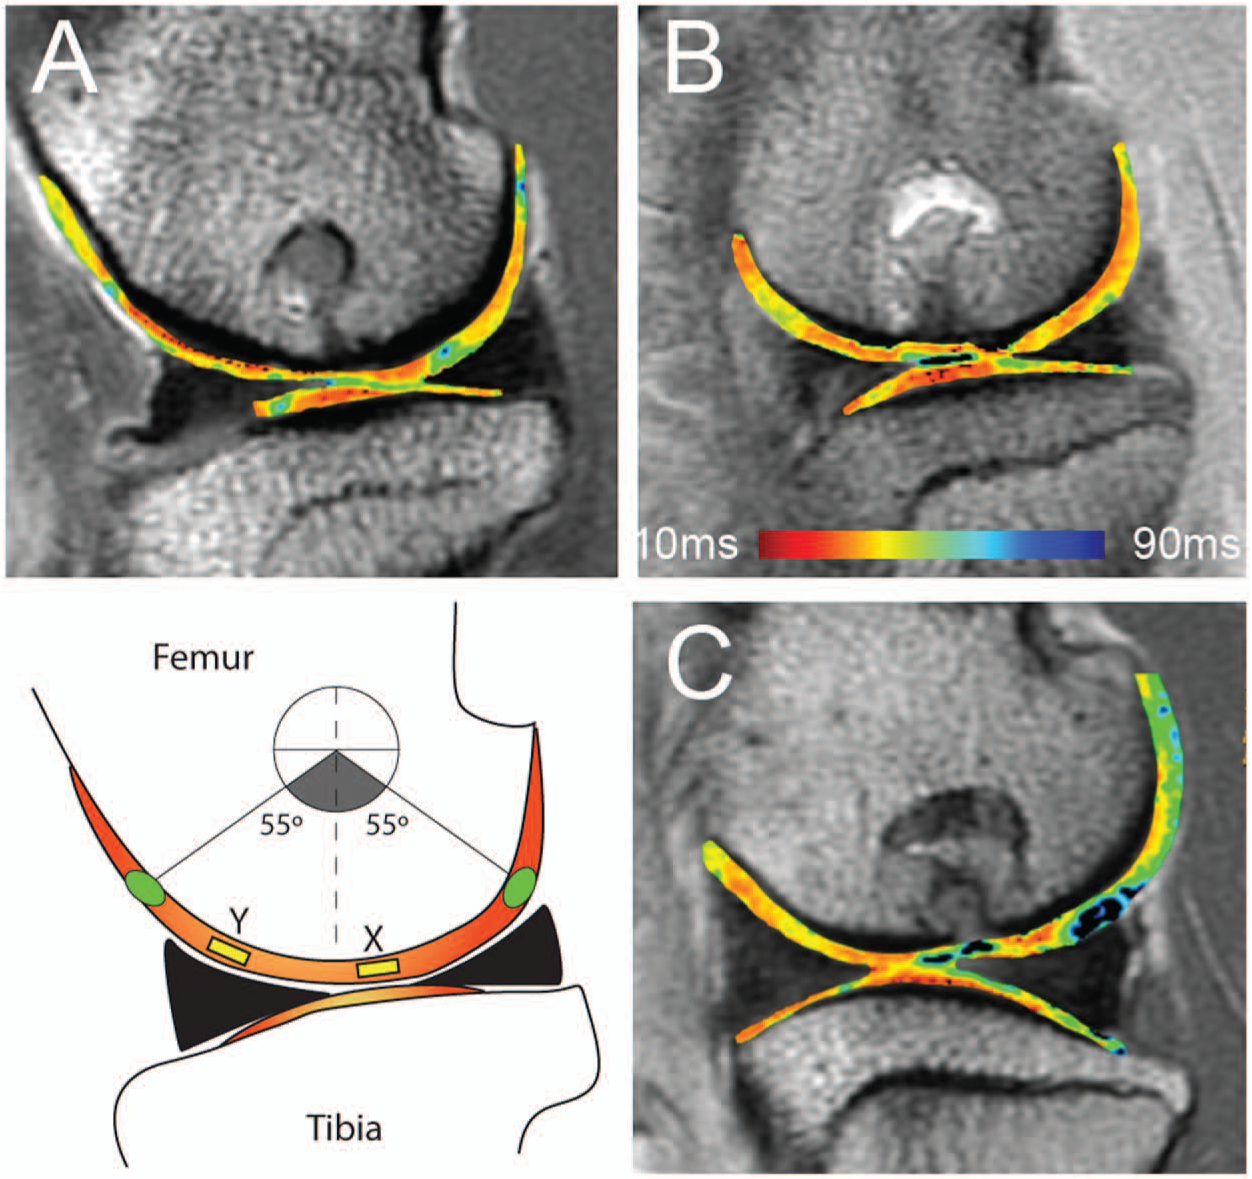
Sagittal magnetic resonance images from the same 3 animals (
Multiphoton Microscopy
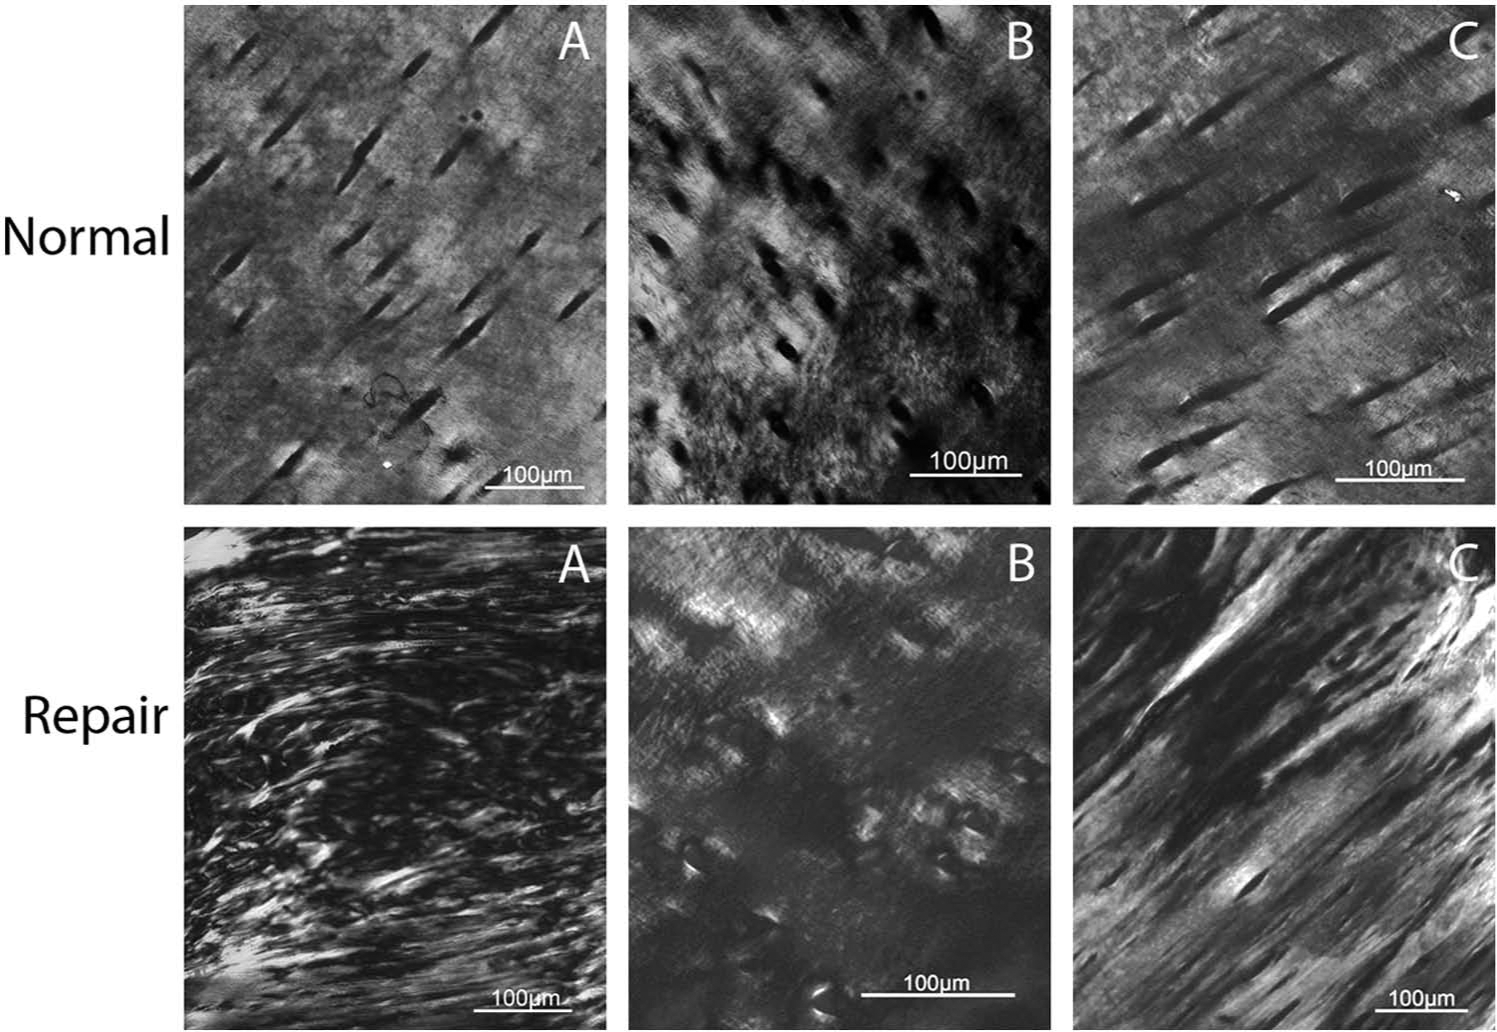
Quantitative MPM imaging indicated that repair tissue was significantly more fibrous than normal cartilage (P = 0.01). The autocorrelation ellipticity was higher in fibrous tissue (3.75 ± 1.17) compared with normal cartilage (2.24 ± 0.51; Figure 4 ).
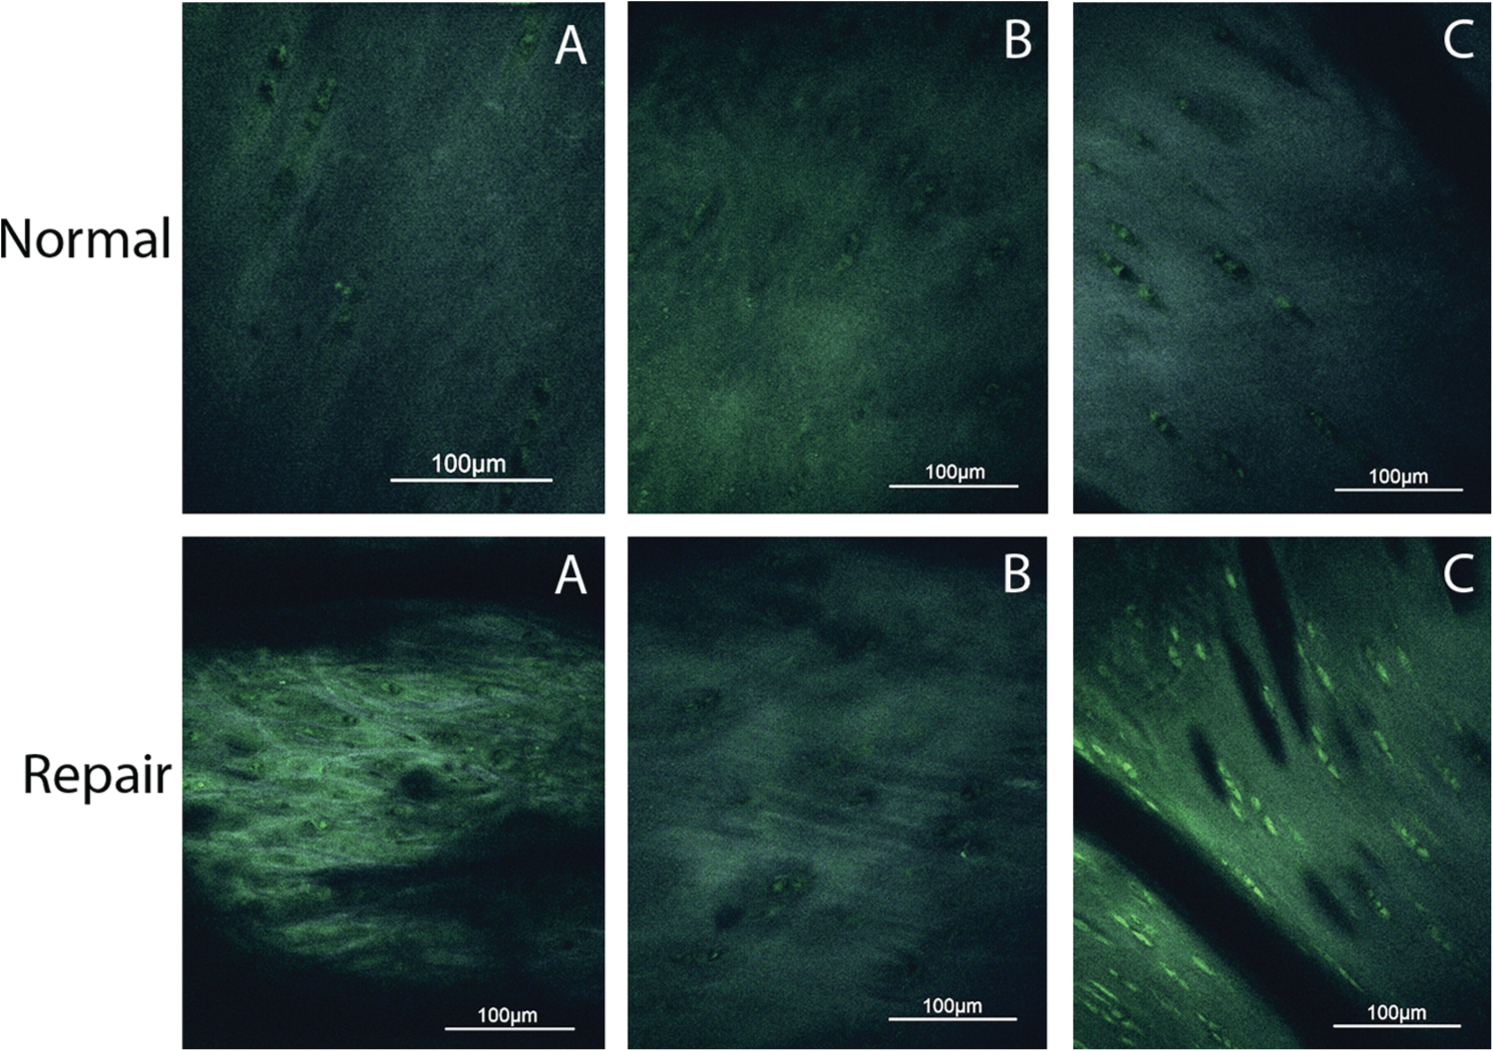
Axial plane multiphoton microscopy images obtained from the same 3 animals (
Polarized Light Microscopy
PLM also indicated that collagen orientation was significantly better (higher score) in normal cartilage compared with repair tissue (P = 0.002; Figure 5 ). The average score for repair tissue was lower (1.6 ± 1.02) than the score for remote normal cartilage (4.4 ± 0.42). Because of the use of a reader-dependent scoring system, further statistical analyses were performed. Spearman rank correlation between the 2 readers (KAR, LAF) was 0.92 (P = 0.0001) indicating good interreader reliability. To provide additional evidence for interreader reliability, a McNemar’s χ2 test revealed that the significance of agreement was above that of chance alone (P = 1.00). The calculated kappa coefficient, which quantifies the magnitude of agreement, was 1.0 indicating there was no difference between the readers’ scores. The ICC score for any one reader was 0.914 (95% confidence interval lower boundary at 0.694) and ICC mean score for both readers was 0.955 (95% confidence interval lower boundary at 0.819). A value of 1.0 indicates perfect agreement.
Axial plane polarized light microscopy (PLM) images of the same 3 animals (
Comparison of All Three Imaging Modalities
A Spearman rank correlation was used to compare each modality against the other two. The strongest correlation was between T2-mapping and PLM (r = −0.76; P = 0.01), followed by MPM and PLM (r = −0.58; P = 0.08), with the weakest correlation shown between T2-mapping and MPM (r = 0.35; P = 0.31).
Discussion
A significant difference in collagen orientation was detected between repair tissue and remote normal cartilage using each of the 3 imaging modalities tested—T2-mapping, MPM, and PLM. This suggests that any of the 3 techniques could be used to quantify and compare collagen orientation in normal and repair cartilage tissues. Histologically, PLM has been the gold standard for assessment of collagen orientation in cartilage and for a period of time, it was the only available method. It remains a routine method of assessment but requires a biopsy or euthanasia of an animal model to obtain the tissue. Repeated biopsy or euthanasia of animal models is expensive, disruptive to tissues, and negates the ability to obtain longitudinal data in cartilage repair studies. Results of this study suggest that more contemporary methods of cartilage imaging such as quantitative T2-mapping or MPM are acceptable alternatives to histological assessment of cartilage for collagen orientation. Use of T2-mapping or MPM not only have the advantage of longitudinal data acquisition capability but also have the ability to assess cartilage collagen orientation in live, unaltered tissue thereby avoiding potential artifact from exogenous tissue processing. Acquisition of longitudinal MPM data would require repeated arthroscopic surgery, which would likely limit the frequency of data acquisition as opposed to MRI, which is noninvasive and could be repeated several times without potential harm to the patient.
The correlation between T2-mapping and PLM was good to excellent whereas the correlation between MPM and PLM was moderate to good. These correlations should be interpreted with caution given the different levels of resolution and information that each of the techniques can provide. Investigators should take into consideration not only the level of resolution desired but also the availability of equipment when choosing an in vivo imaging modality. Although quantitative T2-mapping is less invasive and more readily available than MPM, it has a much lower level of resolution. Resolution of MRI is approximately 0.15 to 0.3 mm whereas MPM reveals cellular detail with a resolution down to less than 1 µm.53,54 One notable benefit with MRI is that is provides general information about the entire joint organ, including the subchondral bone and synovium, which cannot be obtained via PLM or MPM. 39 Currently, in vivo MPM imaging of cartilage is performed in a manner similar to arthroscopy with an MPM microscope adapted to the size of a standard arthroscope.47,48 The physics of MPM and the ability to image live tissue at the micro level render MPM capable of gathering molecular signals and assessing tissue morphology, cell metabolism, and disease states in living tissue without sectioning or exogenous stains or dyes. 37
Although the correlation between T2-mapping and MPM was fair (r = 0.35), it is important to note that both methods were able to detect the difference between remote normal cartilage and central repair cartilage. One-sample t tests provided the most unimpeded information, as these tests were not confounded by discrepancies in resolution or type of information gathered by each modality and demonstrated that all modalities could detect a difference between normal and repair cartilage. Spearman rank correlations had the potential to provide additional comparison but may have been affected by the above discrepancies. Furthermore, the goal of this study was to determine if T2-mapping and/or MPM could provide some reasonable assessment of cartilage collagen orientation in cartilage repair studies. The goal was not to compare MRI with MPM or to determine which method for cartilage collagen structure imaging was superior or more sensitive based on PLM as the standard. All the imaging modalities used in this study can be affected by structural properties, such as collagen content, in addition to collagen orientation. Collagen concentration was not factored into our analysis but it would be interesting to understand the magnitude by which it affects each of the imaging techniques.
The results of this study support the use of T2-mapping and MPM as noninvasive or minimally invasive, quantitative methods for assessment of cartilage collagen orientation. PLM measurements of collagen orientation detected a difference between normal and repair cartilage, and because it is a historical gold standard method, this validated the fact that the difference did in fact exist. T2-mapping and MPM both detected differences in collagen orientation similar to PLM, indicating that when PLM could detect a difference between repair and normal cartilage, MPM and MRI could do the same. Therefore, it is warranted to propose that T2-mapping and MPM could potentially complement the destructive method of histological analysis necessary in PLM. MRI and MPM can be performed in vivo, saving time as well as monetary and animal resources, and allows longitudinal data to be obtained in an objective, quantitative manner.
Footnotes
Acknowledgments and Funding
The authors gratefully acknowledge Ms. Paula Sharp for assistance in preparation of the manuscript and Dr. Li Foong Foo for assistance in performing the MRI scanning of the goats. Fellowship funding for Keir A. Ross was provided by Kensey Nash Corporation.
Declaration of Conflicting Interests
Gino Bradica, Emme Castiglione, and Ryan A. Saska are employed by Kensey Nash Corporation.
Ethical Approval: This study was approved by our institutional review boards.