
Abstract
Objective:
Matrix-induced autologous chondrocyte implantation (ACI) offers a potential solution for cartilage repair but is currently hindered by loss of the chondrocyte differentiated phenotype. To further our understanding of the mechanism of dedifferentiation, changes in the phenotype in relation to mechanotransduction were recorded in response to monolayer culture.
Methods:
Bovine cartilage explants were excised and chondrocytes cultured for 9 days (P1), 14 days (P2), and 21 (P3) days. Changes in morphology and regulatory volume increase (RVI; a mechanotransduction response) were determined by the expression of key genes by RT-PCR and confocal microscopy, respectively.
Results:
A loss of a differentiated phenotype was observed in P1 with a reduction in sphericity and an overall increase in cell volume from 474.7 ± 32.1 µm3 to 725.2 ± 35.6 µm3. Furthermore, the effect of 2-dimensional (2-D) culture-induced dedifferentiation on mechanotransduction was investigated, whereby RVI and Gd3+-sensitive REV5901-induced calcium rise were only observed in 2-D cultured chondrocytes. A significant up-regulation of types I and II collagens and Sox9 was observed in P1 chondrocytes and no further significant change in type I collagen but a return to baseline levels of type II collagen and Sox9 upon further culture.
Conclusion:
These data indicated the presence of an intermediate, mesodifferentiated phenotype and highlight the importance of mechanotransduction as a marker of the chondrocytic cell type.
Introduction
An emerging treatment for patients with osteoarthritis is autologous chondrocyte implantation (ACI), whereby small cartilage explants are removed from patients, chondrocytes isolated, and subsequently grown (“expanded”) in 2-dimensional (2-D) monolayer culture medium in vitro until a suitable density is reached prior to re-introduction into the patient via a 3-dimensional (3-D) support.1,2 When cultured in 2-D monolayers, chondrocytes switch from spherical/ellipsoid morphology to one that is spread/attached, and to date, these changes have not been quantified in dimensional terms but have been found to be independent of other changes in chondrocytic phenotype. 3 A decline in the expression of chondrocyte-specific type II collagen upon monolayer culture has been largely documented and is used, often in conjunction with changes in type I collagen expression, as a phenotypic marker. Additionally, the transcription factor Sox9, a regulator of type II collagen production,4,5 has been shown to be down-regulated in response to 2-D culture6,7 and is often used as another marker in chondrocyte differentiation. As well as expressing the correct matrix proteins, the chondrocyte response to mechanical signals is essential for the development of suitable in vitro engineered tissue, and thus, mechanotransduction, the process of sensing and responding to these signals, offers an essential marker of the chondrocytic phenotype. It has previously been shown that both in situ and freshly isolated chondrocytes lack the capacity for regulatory volume increase (RVI), whereas following 2-D culture, it has been shown that chondrocytes are able to robustly regulate volume following an increase in extracellular osmolality. 8 It has been suggested that chondrocyte RVI is principally mediated by the NKCC and stimulated by latrunculin B (implicating the actin cytoskeleton) and gadolinium chloride (GdCl3). 9 Interestingly, this therefore raises the suggestion that the response to change in extracellular osmolality is potentially a key marker of the differentiated phenotype as well as the standard matrix markers currently used.
The sensitivity of chondrocyte RVI to GdCl3 suggests a relationship with stretch-activated membrane channels and in particular calcium. Previous work has shown that in response to changes in extracellular osmolality, chondrocytes exhibit a rise in intracellular calcium ([Ca2+]i), thought to be mediated by sodium/calcium exchanger (NCX) 10 with a morphologically dependent sensitivity to inhibition using GdCl3. 11 Furthermore, it has been shown that culturing chondrosarcoma chondrocytes in the presence of GdCl3 induced the loss of a differentiated phenotype. 12 As changes in [Ca2+]i appear to be linked to the morphological/phenotypic state of chondrocytes as well as volume regulation, calcium signaling offers a potential third marker of phenotype. We have recently shown that REV5901, a cysteinyl-leukotriene receptor antagonist, is capable of mediating a calcium rise in chondrocytes mediated by IP3-dependent store release and NCX in freshly isolated chondrocytes. 13 Therefore, the [Ca2+]i response to REV5901 loading offers a novel mechanotransduction marker of culture-induced dedifferentiation.
In order to determine quantifiable cellular changes during chondrocyte monolayer culture, changes in cell morphology were determined by confocal laser scanning microscopy (CLSM) in addition to studying the expression of key molecular markers of phenotype by RT-PCR. Additionally, mechanotransduction responses of the chondrocytic phenotype were explored through determining the changes in RVI capacity and [Ca2+]i signaling in response to REV5901 loading to explore changes that can be utilized as phenotypic markers in future research.
Methods
Culture Media and Experimental Salines
The tissue culture media used were Dulbecco’s Modified Eagle Medium (DMEM) (Sigma, St. Louis, MO) supplemented with 1% penicillin/streptomycin solution under aseptic conditions. For work on freshly isolated chondrocytes, the osmolarity of DMEM was adjusted to 380 mOsm/kg H2O (mOsm) by the addition of 50 mM sodium chloride (NaCl). Media used for long-term culture were supplemented with 1% penicillin/streptomycin solution, 20 mM L-glutamine, 10% fetal calf serum (FCS), 50 µg/mL filter-sterilized ascorbic acid, and 50 mM NaCl. For all volume regulation experiments, the capacity of chondrocytes to demonstrate RVI was studied by applying a 42% hyperosmotic challenge as previously described. 8 Calcium measurement experiments were performed using basic physiological saline (BPS) as previously described. 13 When performing “calcium-free” and “sodium-free” experiments, CaCl2 was replaced with 2 mM EGTA, and the osmolality was adjusted using choline chloride, 14 respectively.
Chondrocyte Isolation and Culture
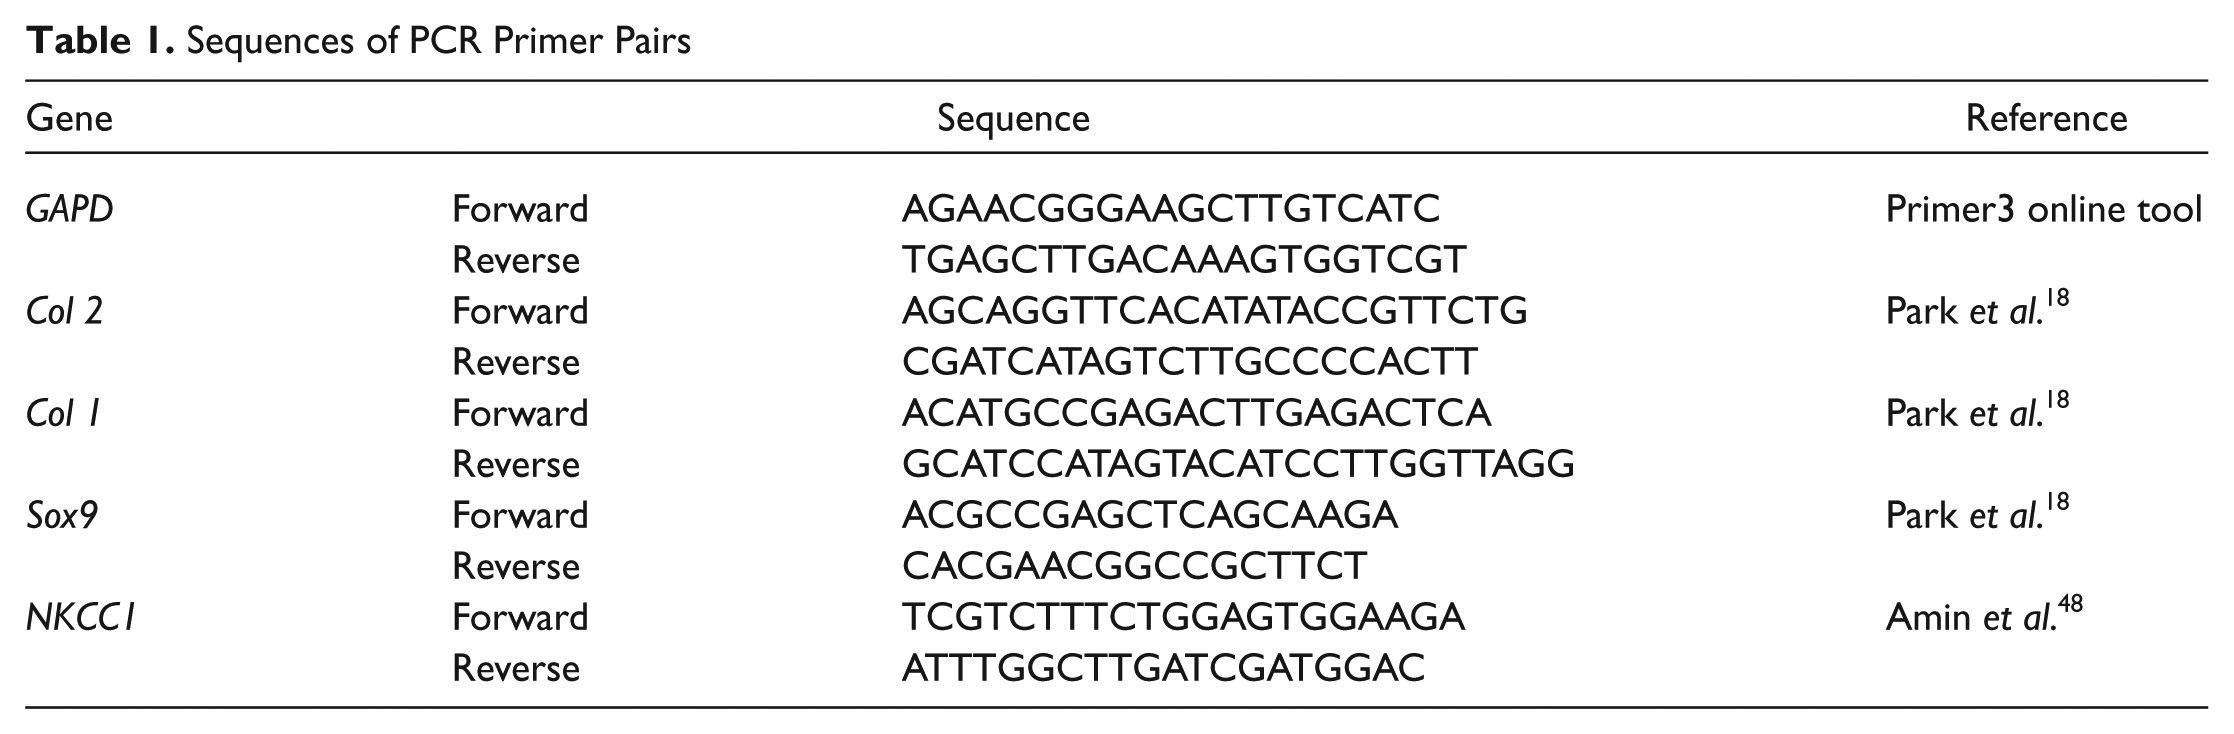
Bovine metacarpal joints of freshly slaughtered 18- to 21-month-old female animals were obtained from the local abattoir (with permission) and full-depth cartilage isolated into 280 mOsm DMEM supplemented with 1% penicillin/streptomycin solution under aseptic conditions and chondrocytes isolated as previously described. 15 Following isolation and in order to optimize the culture conditions, chondrocytes were seeded and subcultured upon reaching confluence for up to 21 days at 3 different culture densities: high density (HD; 2 × 10⁵ cells/cm2), 16 intermediate density (MD; 1 × 10⁵ cells/cm2), 7 and low density (LD; 2 × 10⁴ cells/cm2). 17 Upon reaching 80% confluence, the supplemented media were removed and chondrocytes lifted in 0.05% trypsin-EDTA solution (380 mOsm) for 5 to 10 minutes at 37 °C for further subculture or the use in required experimentation. Chondrocytes were counted and assayed for viability at the end of every passage using trypan blue staining and a growth curve constructed. A linear growth curve of log cell number Log(N) was plotted against time in days (t) and regression analysis performed.
Expression Profiling of Expanded Chondrocytes
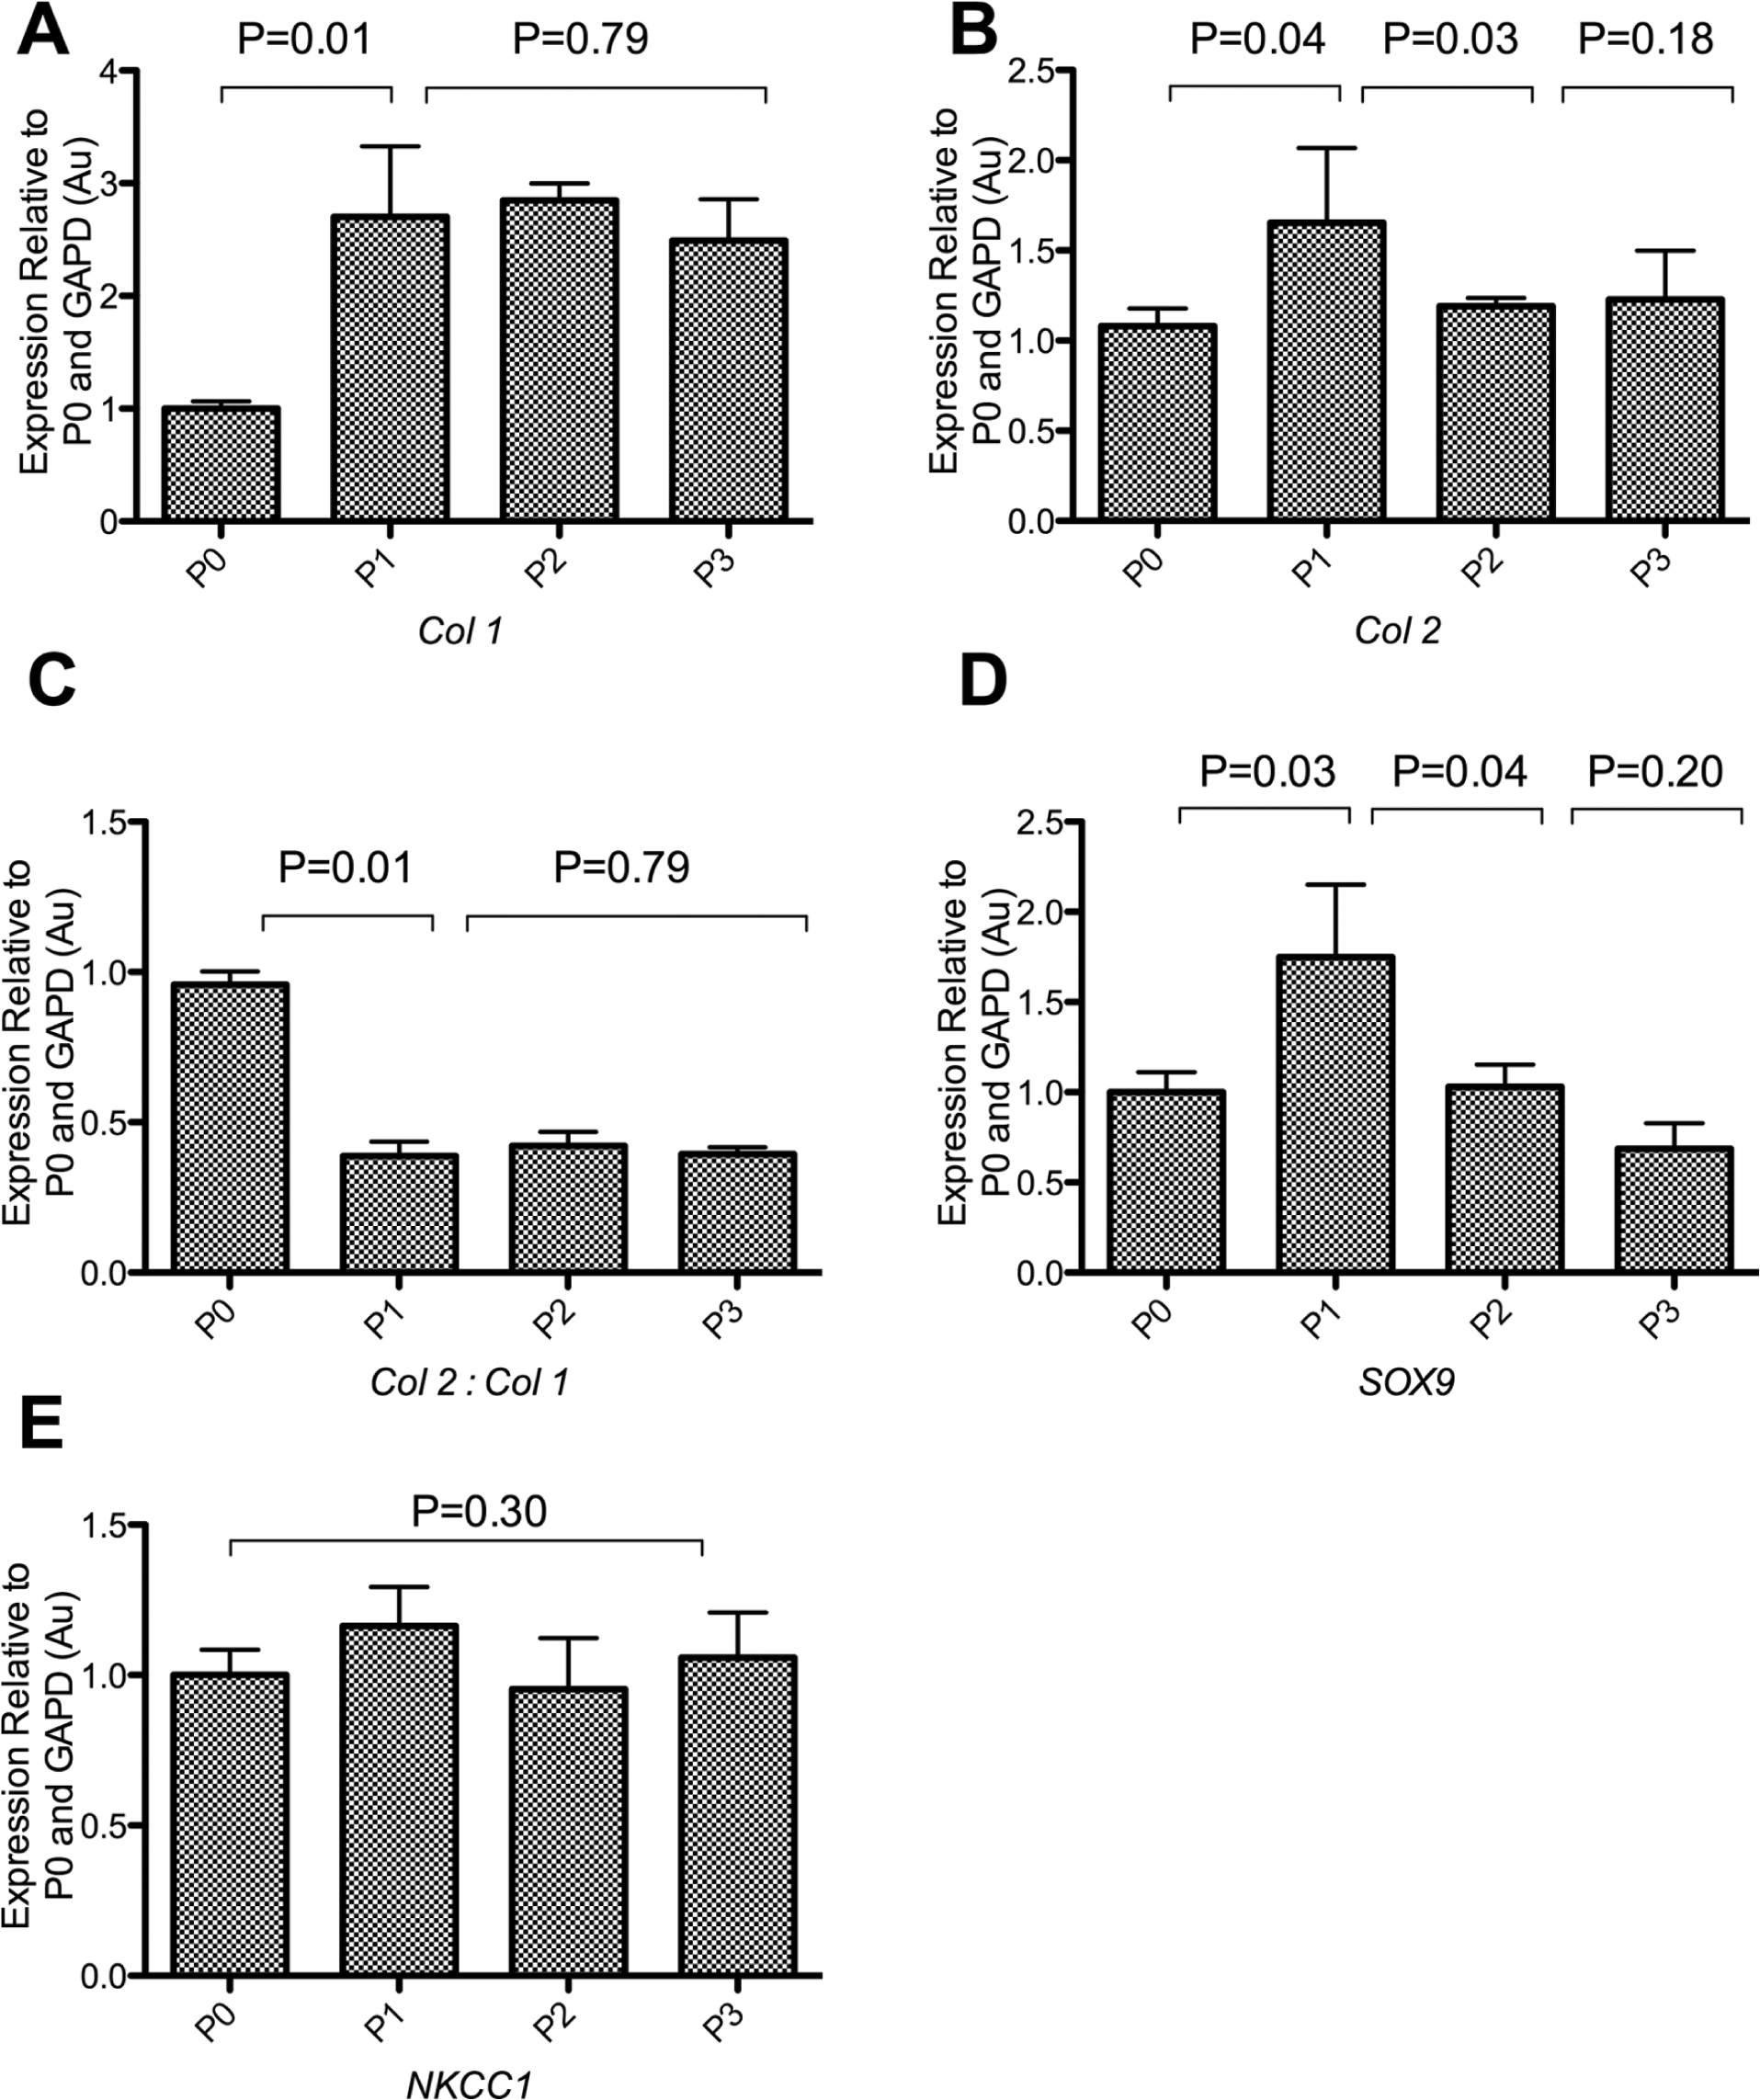
The change in expression of key marker genes was studied by reverse-transcriptase polymerase chain reaction (RT-PCR) at the end of each passage. There was 1 µg of RNA sample isolated using RNEasy minikint (Qiagen, Hilden, Germany) and reverse transcribed using the ImPromII Reverse Transcription (RT) System (Promega, Fitchburg, WI) per the manufacturers’ instructions. Published sequences were used
18
or novel sequences designed using the Primer3 online tool and tested for specificity by running an online alignment search using Basic Local Alignment Search Tool (BLAST) on the National Center for Biotechnology Information (NCBI) website (
Table 1
). PCR was used to assay the expression of key genes during chondrocyte expansion using GoTaq Green Master Mix (Promega) per the manufacturer’s instructions and performed with initial denaturation at 95 °C for 2 minutes, annealing at the melting temperature of primers (58 °C), and extension at 72 °C for 2 minutes with the cycle repeated 35 times. PCR products were separated on 1% ethidium bromide tris-borate-EDTA (TBE)–buffered 2% agarose gels and visualized by video capture under ultraviolet (UV) excitation prior to analysis by gel densitometry.
19
Briefly, images of gels were imported into Scion Image (Scion Incorporated, Frederick, Maryland, USA) to measure band area (A), band intensity (I), and background pixel intensity (IB) (
Sequences of PCR Primer Pairs
Measurement of Chondrocyte Morphology, Volume, and RVI
The change in morphology of chondrocytes during culture was observed by studying the cell dimensions including depth (average vertical dimension), width (average shortest dimension parallel to the culture substrate), length (average longest dimension parallel to the culture substrate), volume, and sphericity (the ratio of the surface area of a sphere with the same volume as a given chondrocyte to the surface area of the chondrocyte). Chondrocytes were seeded 2 hours prior to imaging and incubated in the dark with 5 µM calcein-AM at 37 °C for 30 minutes prior to acquisition of images using CLSM, whereby calcein was excited using a 488-nm argon laser, the photometric data collected at a bandpass of 510 to 535 nm, data sampled at 512 × 512 pixels, and 3-D z-stacks acquired using a z-step of 1.0 µm, as previously described.
19
The extracellular osmolality was subsequently raised to 540 mOsm (42%) and images acquired 1.5, 3, 5, 10, and 20 minutes after challenge. All experiments were performed at 37 °C. Images were reassembled in Imaris version 7.1 (Bitplane, Zurich, Switzerland) and isosurface objects created at 60% threshold, permitting the calibrated volume for a sphere, for freshly isolated chondrocytes.
19
However, due to their irregular shape, a threshold of 60% was deemed unsuitable for “flat” chondrocytes, including C-20/A4 chondrocytes, as the “isosurface” object did not contain the cell body. The depth of the nucleus at 60% threshold was termed “nuclear coefficient” (dη) and was thus used to standardize the apparent volume (V10%) of chondrocytes obtained at 10% threshold (
Regression analysis for volume recovery was performed and used for the calculation of half the time required for chondrocytes to regulate 100% of initial volume in response to the challenge (t½).
Calcium Imaging
Changes in intracellular calcium were determined using a fluorescence plate (BMG LabTech, Ortenberg, Germany) reader in conjunction with Fluo-4 AM (Invitrogen, Paisley, UK), as previously described.13,21,22 Chondrocytes were incubated with 3 µM Fluo-4 AM (Invitrogen) for 30 minutes at 37 °C, media replaced with BPS, and initial calcium measurement recorded prior to inducing a rise in [Ca2+]i by loading 50 µM REV5901 (Cambridge Biosciences, Cambridge, UK) and observing changes in [Ca2+]i for 5 minutes (excitation at 494 nm and emission at 520 nm). All experiments were performed at 37 °C. For the purposes of investigating individual channel and/or signaling molecule contribution to the calcium rise, various inhibitors were employed. Sodium-sensitive calcium influx (mediated but not exclusively by the sodium calcium exchanger; NCX), Gd3+-sensitive stretch-activated cation channels (SACC), and transient receptor potential vanilloid (TRPV) channels were inhibited by the use of Na+-free BPS, 10 100 µM Gd3+, 11 or 10 µM ruthenium red, 23 respectively. Pharmacological inhibitors were added to culture media with Fluo-4 AM (Invitrogen) and incubated for 30 minutes before [Ca2+]i measurement. The inhibition factor (IF) of various pharmacological inhibitors was determined as the difference between [Ca2+]i rise in the presence of the inhibitor relative to REV5901-induced [Ca2+]i rise and was expressed relative to REV5901-induced [Ca2+]i rise.
Statistical Analysis
All statistical analysis and plotting of graphs were performed using GraphPad Prism version 5.0c (GraphPad Software, San Diego, CA). Equations of linear regression were obtained and r2 values given for every equation. All values are shown as mean ± standard error of the mean (SEM). Student t tests were carried out using Gaussian distribution and homogeneous variance to determine whether 2 sets of values are different and deemed significantly different if P < 0.05. The number of individual joints utilized for each experiment was denoted (N), and the number of cells studied, where applicable, was denoted (n).
Results
Expansion and Growth Rates
Chondrocytes cultured at HD exhibited high viability (90.4% ± 4.0%) despite not showing an increase in cell number by the end of the first passage (day 9) ( Fig. 1 ). Conversely, chondrocytes cultured at MD exhibited an increase of 47.5% ± 29.4% in cell number and a viability of 90.1% ± 5.5% during the first passage (9 days) but subsequently ceased to stimulate further increase in cell number after this passage with an average doubling time of 19 days. Finally, chondrocytes cultured at LD exhibited a steady increase in cell number (doubling time of 3.7 ± 0.2 days), and this culture density was therefore selected for all expansion experiments despite a reduction in viability to 71.0% ± 8.7%. These data suggested that despite a reduction in chondrocyte viability, LD was a favorable choice for 2-D cell culture and was used thereafter as part of the standard culture technique with subculture performed on days 9 (P1), 14 (P2), and 21 (P3).
Growth curve of bovine articular chondrocyte upon in vitro culture. Chondrocytes were subcultured upon 80% confluence, counted, and reseeded at the same density. A growth curve was plotted of log total cell number versus time and a linear regression used to calculate growth rate and doubling time. There was a steady increase in cell number only when cultured at LD. Data were pooled from 23 individual experiments (N = 12). Data shown as mean ± SEM. R2 values for regression analysis are shown.
Morphology, Shape, and Volume of Freshly Isolated and Expanded Chondrocytes
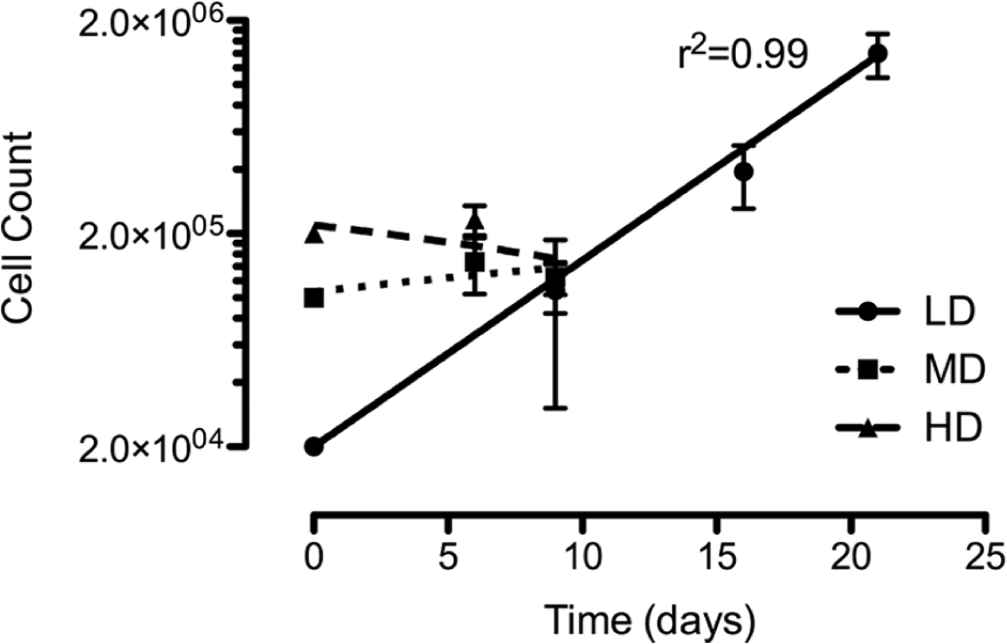
Upon the introduction into 2-D monolayer culture, the most prominent observation was a change in morphology, whereby chondrocytes acquired a “flat” fibroblast-like structure within 9 days of culture, which included flattening of the nucleus. There was a decrease in cell depth (a) in response to culture from 4.08 ± 0.11 µm in freshly isolated chondrocytes to 2.2 ± 0.2 µm, 2.0 ± 0.1 µm, and 2.2 ± 0.1 µm in P1, P2, and P3 chondrocytes, respectively (P < 0.0001) (
Cellular dimensions and sphericity of chondrocytes as quantified using the Imaris Isosurface Surpass utility (Bitplane). A series of chondrocyte images were acquired using confocal microscopy were reassembled in Imaris (Bitplane), and isosurface “objects” were created in Imaris (Bitplane) where the depth (a), width (b), and length (c) of each object were determined. There was a significant 2-fold increase and decrease in chondrocyte length and depth, respectively. Moreover, there was a significant decrease in sphericity upon 9 days of culture, indicating a switch in morphology from as early as the first passage. Data pooled from 16 individual experiments (N = 4, n = 119). Data shown as mean ± SEM. Student t test values are shown and deemed nonsignificant (N/S) when P ≥ 0.05.
Images were acquired by CLSM and chondrocyte volumes calculated using Imaris 7.1 (Bitplane). Freshly isolated chondrocytes possessed a volume of 474.7 ± 32.1 µm3, whereas upon 2-D culture, there was a significant increase (P = 0.02) in chondrocyte cell volume to 673.4 ± 39.6 µm3, 724.8 ± 39.6 µm3, and 725.2 ± 35.6 µm3 in P1, P2, and P3 chondrocytes, respectively.
Phenotype and Expression Profiling of Cultured Chondrocytes
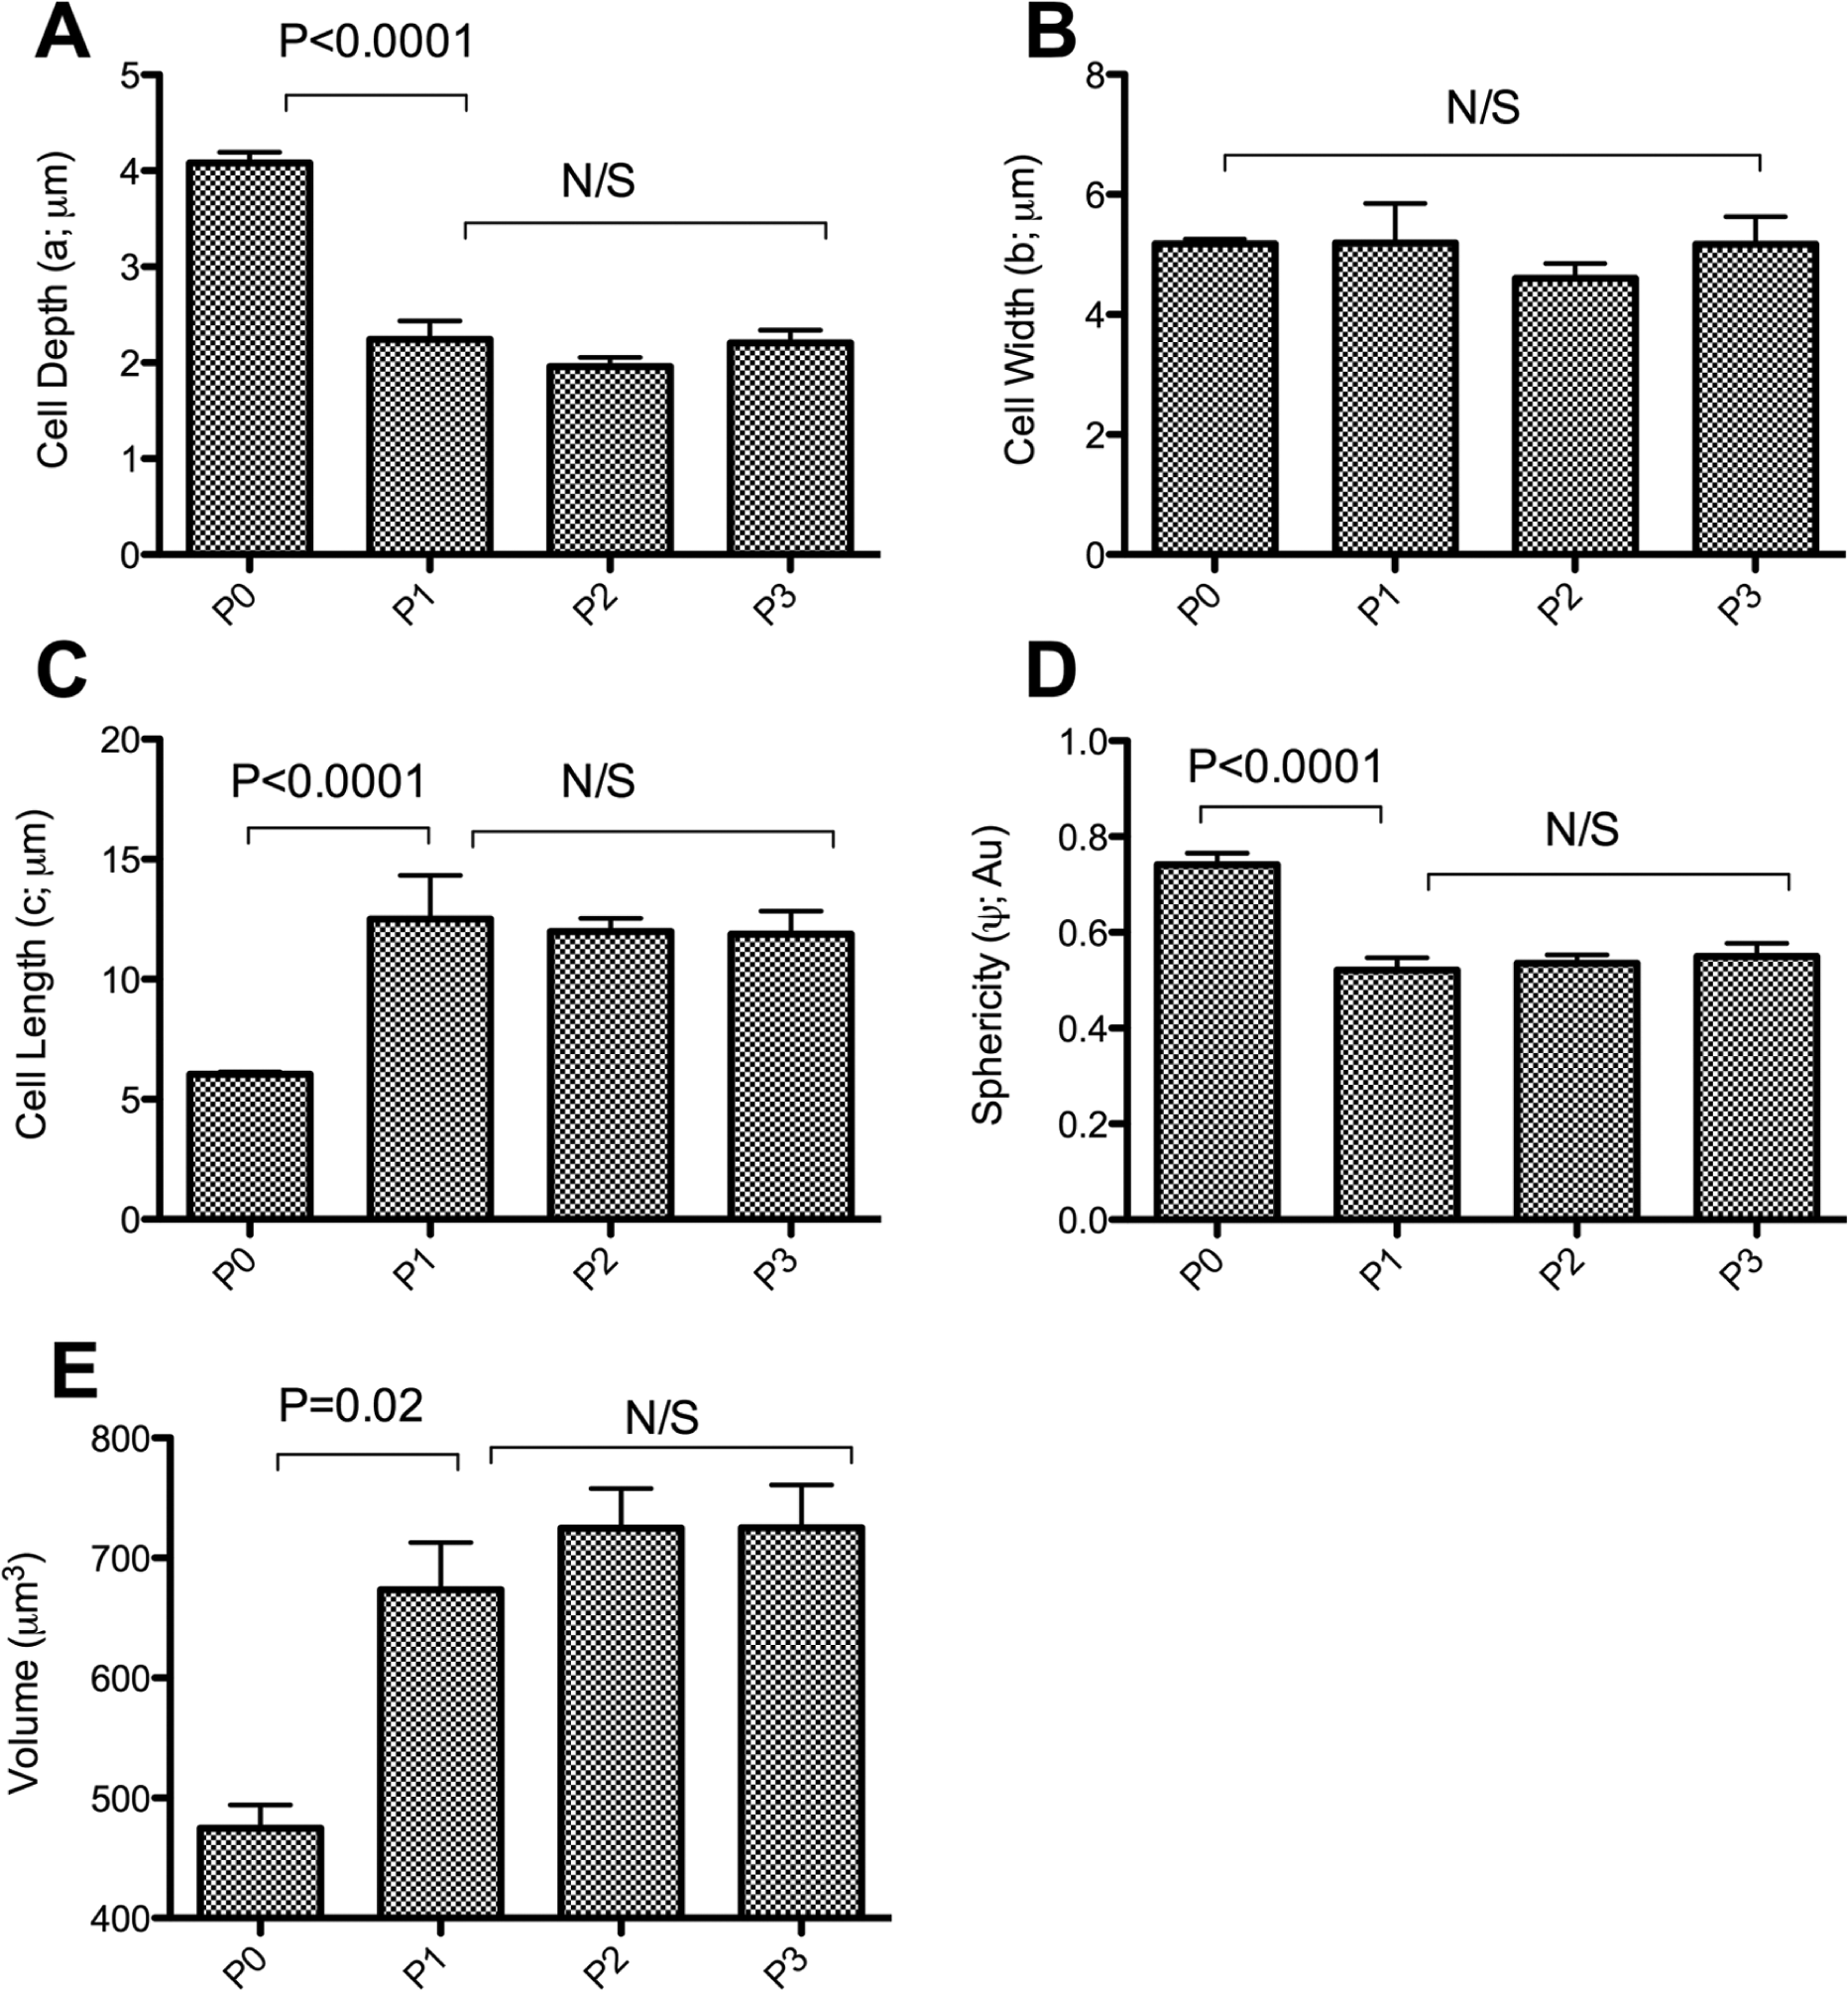
Changes in the expression of key marker genes of the chondrocyte phenotype were determined to correlate those to changes in cellular morphology. A significant up-regulation of collagen was observed as early as the first passage, with relative expression level of type I collagen increasing from 1.00 ± 0.064 to 2.7 ± 0.6 after 9 days in culture (P = 0.01) ( Fig. 3 ). The expression levels of type II collagen increased transiently within 9 days of culture from 1.0 ± 0.1 to 1.6 ± 0.2 (P = 0.04) and subsequently returned to baseline levels after 14 days of culture, with no significant differences observed compared to freshly isolated chondrocytes (P = 0.18). The ratio of type II collagen to type I collagen expression was therefore reduced by a factor of approximately 2 from as early as the first passage to 0.6 ± 0.2, indicating an early onset switch of phenotype that was maintained for the remainder of the culture period with no further subsequent change (P = 0.79) ( Fig. 3 ). The expression of the chondrocytic transcription factor Sox9, a key regulator of chondrocytic phenotype, was also studied upon 2-D culture to confirm data obtained from the collagen ratio for the purpose of determining the switch in chondrocyte phenotype. A significant yet transient 1.8 ± 0.4–fold increase in Sox9 expression (P = 0.03) was observed within 9 days of culture and declined upon further culture to baseline levels observed in freshly isolated chondrocytes (P = 0.20) ( Fig. 3 ). This increase coincided with the transient rise in type II collagen expression, indicating a potential role for Sox9 in type II collagen expression and suggesting that dedifferentiation occurred in a 2-step trend.
The expression profiling of chondrocytes before and throughout culture. Changes in the expression of key genes compared to amounts in freshly isolated chondrocytes (P0) were recorded upon confluence after 9 days in culture (P1), 14 days in culture (P2), and 21 days in culture (P3). The level of expression of Sox9 declined upon culture despite the transient increase in P1. Both the expression levels of types II and I collagen increased during 2-D expansion, but the ratio of type II collagen to type I collagen expression decreased significantly during the first few days of culture. Transient increase in Sox9 and type II collagen during P1 suggested that the loss of phenotype might be a multistep process. There was however no change in NKCC1 expression for the duration of the culture period. Experiment repeated 6 times (N = 6). Data shown as mean ± SEM. Student t test values are shown and deemed nonsignificant (N/S) when P ≥ 0.05.
Recent work has shown that the capacity for RVI is related to the chondrocytic phenotype, 8 and thus, changes in expression of the NKCC1, associated with the capacity for RVI, 19 were therefore recorded in response to 2-D culture. Interestingly, despite chondrocyte RVI being mediated by the NKCC, 8 there was no change in NKCC1 expression with values of 1.2 ± 0.1 Au, 1.0 ± 0.17 Au, and 1.1 ± 0.2 Au in P1, P2, and P3 chondrocytes, respectively, relative to freshly isolated chondrocytes (P = 0.95) ( Fig. 3 ).
RVI in Freshly Isolated and 2-D Expanded Chondrocytes
Following an increase in extracellular osmolality, freshly isolated chondrocytes decreased in volume from 474.7 ± 19.5 µm3 to 364.5 ± 17.0 µm3 at time 1.5 minutes and subsequently continued to decrease in volume over the following 20 minutes to 317.2 ± 12.6 µm3 at 20 minutes after osmotic challenge ( Fig. 4A ). Conversely, P1, P2, and P3 chondrocytes decreased in volume b at 1.5 minutes to 588.6 ± 15.3 µm3, 639.5 ± 14.4 µm3, and 628.3 ± 19.8 µm3, respectively, which were not significantly different to each other (P > 0.05). When comparing the relative percentage change to freshly isolated chondrocytes, there was a significantly different (P < 0.0001) decrease in volume to 588.60 ± 15.32 µm3, 639.549 ± 14.435 µm3, and 628.328 ± 19.84 µm3 in P1, P2, and P3 chondrocytes, respectively. Unlike freshly isolated chondrocytes, 2-D cultured chondrocytes exhibited RVI, whereby at 20 minutes after osmotic challenge, P1 chondrocytes recovered 99.6% of their original volume, P2 chondrocytes recovered 99.9% of their original volume, and P3 chondrocytes recovered 99.6% of their original volume. While the recovery of volume was not significantly different (P > 0.05) for any of the passages, it was conceivable that the rate was different, and therefore, the rate of volume recovery, measured as t½, was calculated. Interestingly, P1 cultured chondrocytes exhibited linear volume recovery with a t½ of 9.6 ± 0.6 minutes, termed “slow” RVI. Conversely, both P2 and P3 cultured chondrocytes exhibited biphasic volume recovery, a “robust” RVI of 2.8 ± 0.5 minutes and 3.5 ± 0.5 minutes between 1.5 minutes and 5 minutes, followed by “slow” RVI of 10.1 ± 0.7 minutes and 10.9 ± 0.5 minutes, respectively ( Fig. 4B - D ). Together, these data demonstrate that the capacity for RVI differs between freshly isolated and 2-D cultured chondrocytes and correlates to the time in culture.
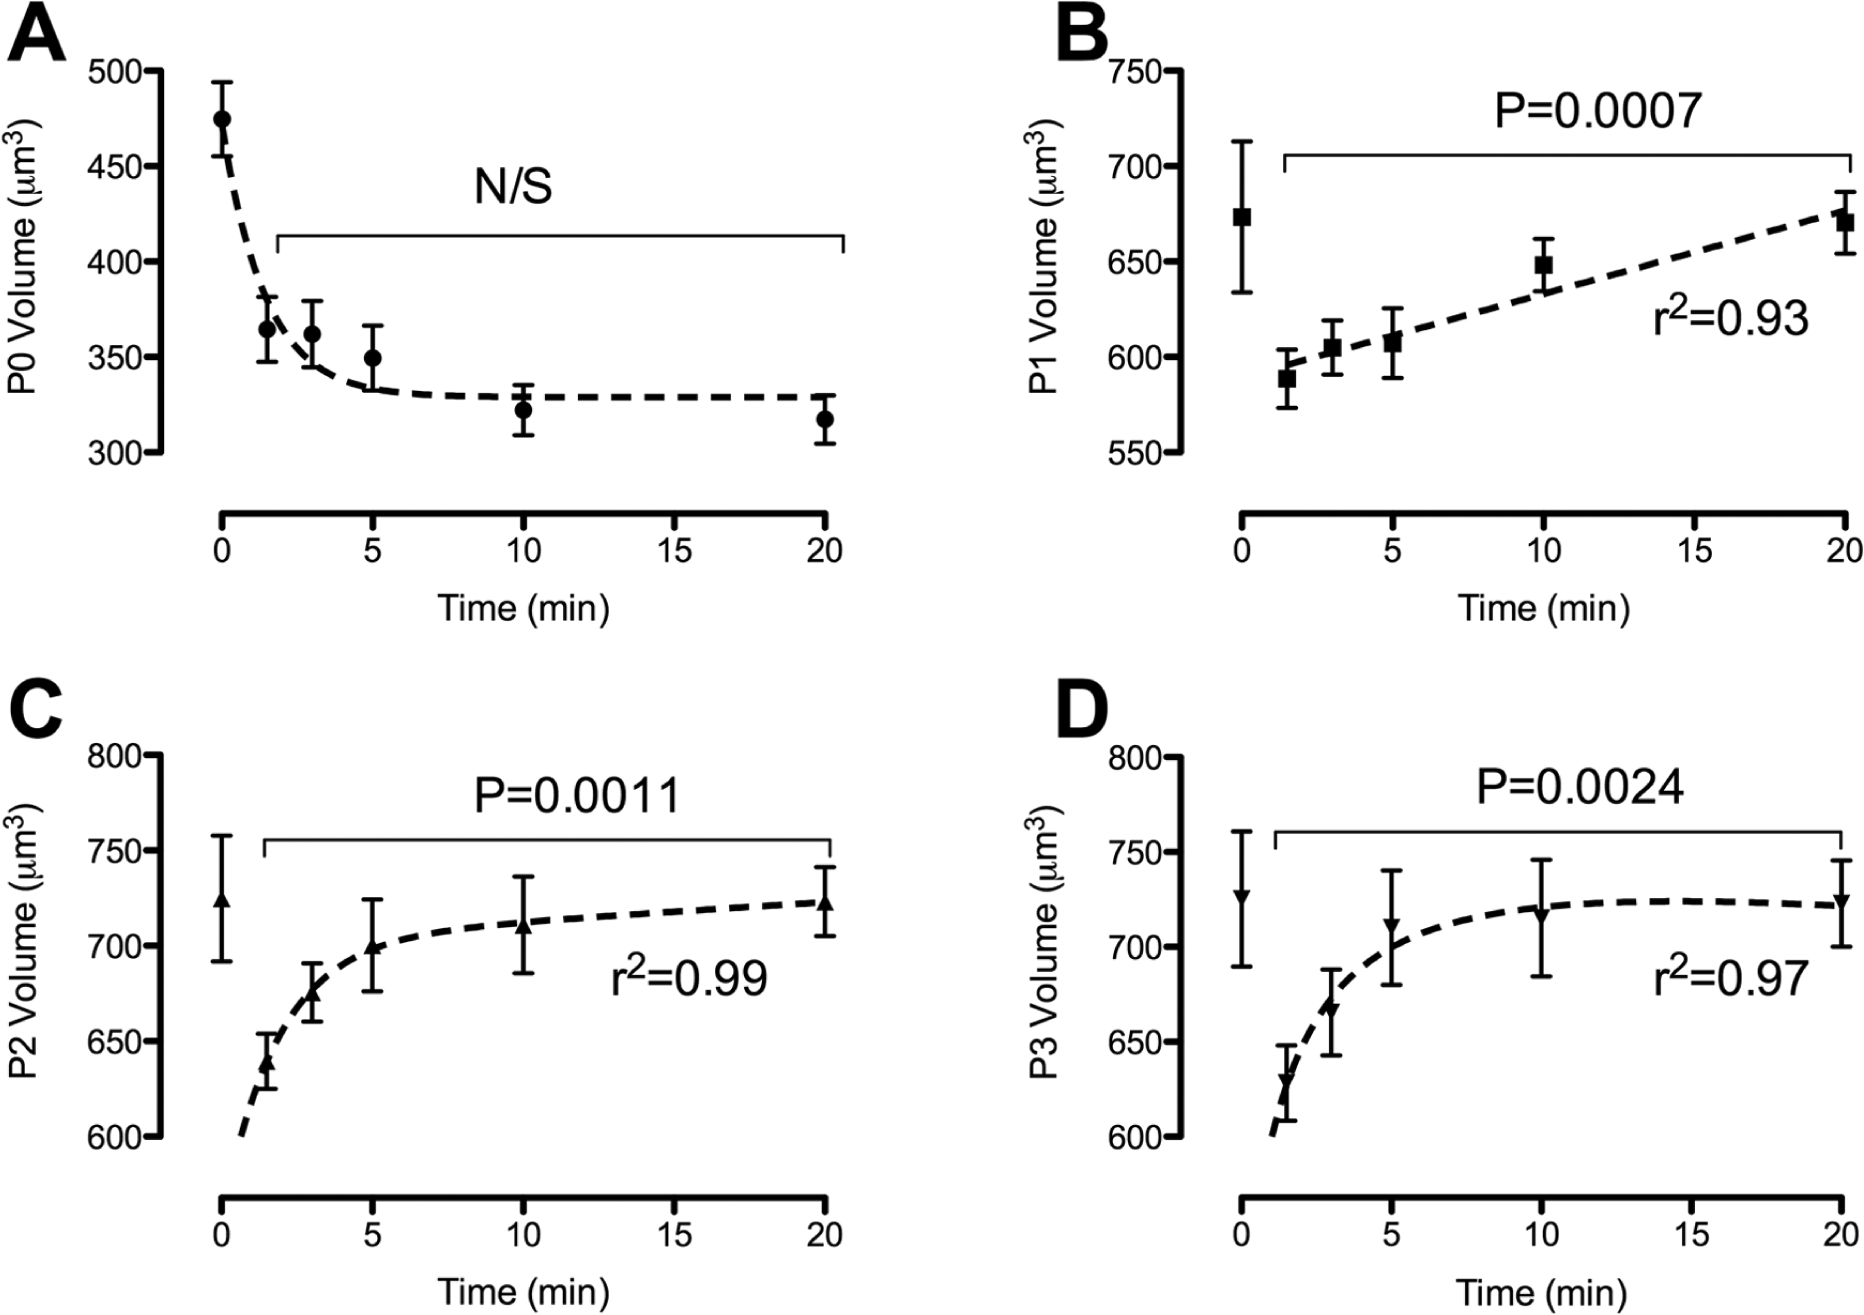
The capacity of freshly isolated and 2-D expanded chondrocytes to exhibit RVI in response to hyperosmotic conditions. Freshly isolated (
Phenotype-Dependent Responses to REV5901-Induced [Ca2+]i Rise
The role and signaling pathway of REV5901 were studied in response to 2-D culture. Initial control experiments indicated DMSO induced a small but insignificant rise in [Ca2+]i in both freshly isolated and 2-D cultured chondrocytes, reaching 1.4% ± 0.3% and 1.0% ± 0.3%, respectively. When perfused with a final concentration of 50 µM REV5901, a significant and sustained rise in [Ca2+]i levels to 38.0% ± 5.7% and 12.5% ± 0.6% was observed in freshly isolated chondrocytes and P1 chondrocytes, respectively (P = 0.02) (
Fig. 5A
). Following incubation with 2 mM EGTA, there was a significant reduction in the contribution of intracellular stores to REV5901-induced [Ca2+]i rise from 27.9% ± 3.2% in freshly isolated to 2.0% ± 0.8% in P1 chondrocytes (P = 0.0007) (
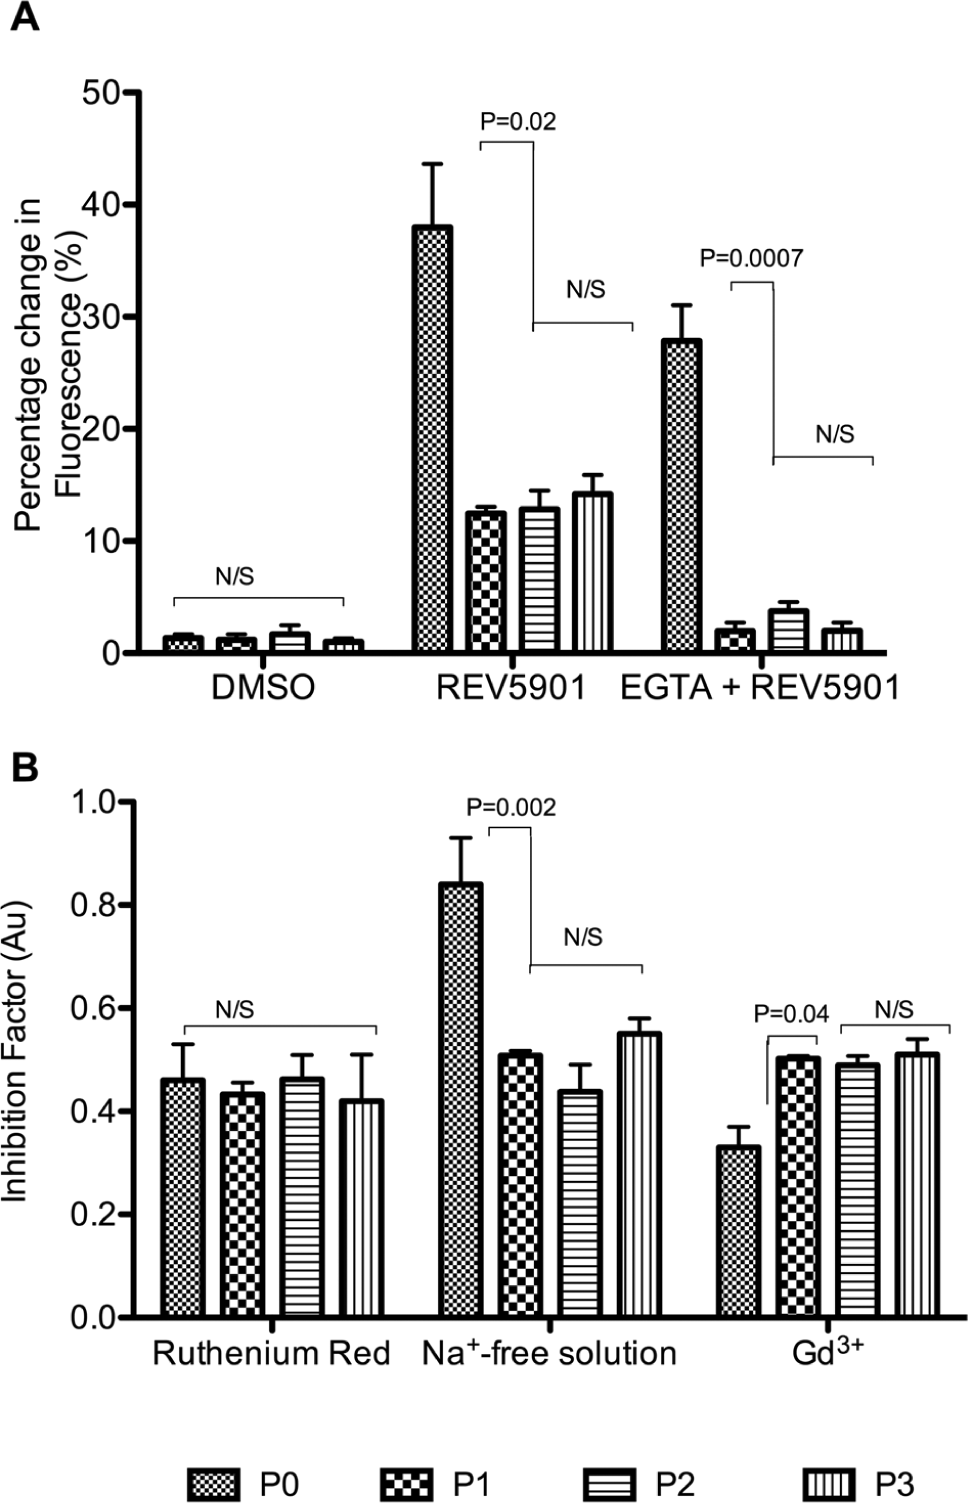
The effect of REV5901 loading on freshly isolated and 2-D cultured chondrocytes. (
As the level of REV5901-induced transmembrane calcium influx was not affected by 2D culture, membrane channel-dependent regulation of intracellular calcium was investigated using pharmacological or chemical inhibitors to calcium influx ( Fig. 5B ). The sensitivity of chondrocytes to the absence of extracellular sodium ([Na+]e) was decreased following 2-D culture from an IF of 0.8 ± 0.1 in freshly isolated chondrocytes to an IF of 0.5 ± 0.0 in P1 chondrocytes (P = 0.002), indicating a dependency on sodium- sensitive calcium channels in freshly isolated chondrocytes. Conversely, the sensitivity to Gd3+ was increased upon culture with IF increasing from 0.3 ± 0.0 in freshly isolated to 0.5 ± 0.0 in P1 chondrocytes (P = 0.04). No significant differences however were observed in the sensitivity of freshly isolated and 2-D cultured chondrocytes to ruthenium red inhibition of the TRPV channels (P = 0.75) ( Fig. 5B ). Together, these data have demonstrated a change in calcium channel expression and/or activity upon 2-D culture from a mechanism that is [Na+]e dependent to one that is stretch sensitive.
Discussion
It has been well documented that the in vitro 2-D culture of chondrocytes induces a switch in phenotype from “differentiated” (chondrocytic) to “fibroblast-like” (dedifferentiated). These changes are evident by the loss of the round morphology and the decrease in type II to type I collagen expression ratio.24,25 Despite evidence of redifferentiation in 3-D culture, 25 the ability of dedifferentiated chondrocytes to redifferentiate is limited to the number of passages they undergo in 2-D culture.26,27 Therefore, the loss of the chondrocytic phenotype is a major setback to chondrocyte expansion, and thus, ACI as functional cartilage is made predominantly of collagen type II. These distinct changes were studied in response to a standardized cell culture technique to further our understanding of chondrocyte phenotype and 2-D culture-induced dedifferentiation, with the aim of developing functional markers of the chondrocytic phenotype.
Firstly, the culture methodology was optimized using different seeding densities in serum-enriched media. At HD and MD, chondrocytes did not undergo significant cell growth possibly due to contact inhibition28,29 despite maintaining viability, as determined by trypan blue staining (data not shown). However, chondrocytes cultured at LD divided at a doubling time of 3.7 days, which is comparable to previously published data.30,31 Interestingly, it appeared that chondrocytes cultured at LD exhibited significantly larger cell death when compared to MD and HD cultures, which is possibly attributed to cell-to-cell interactions promoting cellular survival in vitro. This is the first observation of limiting effects of HD chondrocyte culture on cell division despite similar observations reported upon HD culture in porcine hepatocytes, whereby an initial >90% viability was followed by a decline with time. 32
The first and most apparent effect of monolayer culture was the loss of the round morphology quantified by studying the sphericity of chondrocytes. By the ninth day in monolayer, a drop in sphericity was observed with no change recorded upon further culture, thereby indicating the complete loss of morphology as early as the first passage, as previously observed by others but not quantified. 33 This switch in morphology was further confirmed by studying accompanying changes in cellular dimensions, whereby upon culture, there was a decrease in cell depth, increase in cell length, and increase in chondrocyte cell volume. While the values for volume of freshly isolated chondrocytes were in accordance with those reported in the literature, this is the first time that a change in cell volume has been reported during culture. 34 The increase in cell volume upon culture may be attributed, but not exclusively, to actin reorganization, 35 which has been shown to be sufficient to induce changes in cellular volume in transforming growth factor–treated epithelial cells. 36 Another potential reason for the increase in chondrocyte cell volume is the release from maturational arrest upon serum-supplemented 2-D culture of chondrocytes previously shown to induce hypertrophic-like properties including type X collagen expression 37 shown to undergo up-regulation upon 3-D encapsulation of P5-7 auricular chondrocytes prior to apoptosis. 27 No up-regulation, however, was observed here in the expression of NKCC1, another hypertrophic tissue marker. 38 Further work to confirm the potential of 2-D culture for the induction of chondrocyte hypertrophy is required to determine the effect of serum on the expression of other hypertrophy markers including matrix metalloproteinase 13 39 and bone sialoprotein. 40
The modification in the expression “battery” of chondrocytes in response to 2-D culture was documented by RT-PCR and densitometry analysis. The ratio of col2:col1 has long been used as a marker of chondrocyte differentiation, and we have similarly reported a decline in col2:col1 ratio within the first passage, which decreased insignificantly upon further culture. Type I collagen expression levels increased upon 9 days in culture (P1) and remained elevated for the remainder of culture as previously reported. 7 Interestingly, the expression of the chondrocyte-specific type II collagen transiently yet significantly increased 9 days in culture prior to returning to baseline levels. Similar observations were reported upon 3-D encapsulation of dedifferentiated chondrocytes, whereby a transient up-regulation of type II collagen was observed up to the twelfth day in culture in porcine auricular 27 and in primary human chondrocytes derived from passages 1 to 4. 41 These data demonstrated that the loss of phenotype may occur in 2 stages, whereby an intermediate phenotype in P1 chondrocytes (thereafter termed “mesodifferentiated”) was characterized by the up-regulation of both collagens in 2-D culture prior to the ultimate suppression of type II collagen expression.
As Sox9, an early chondrogenic marker in mesenchymal stem cells, has been shown to regulate the expression of type II collagen in chondrocytes, 42 Sox9 expression levels reported here were also used as a marker of chondrocyte differentiation, whereby the level of Sox9 expression increased following 9 days in culture and simultaneously to the rise in type II collagen expression, prior to subsequent decline upon further culture. The simultaneous increase in type II collagen expression may be therefore attributed to the up-regulation in Sox9 expression in P1 chondrocytes. To our knowledge, this is the first report of transient up-regulation of Sox9 expression upon 2-D culture.
The capacity of chondrocytes to exhibit RVI in response to a hyperosmotic challenge was studied as a novel marker of phenotype, with volume regulatory mechanisms classified into “slow” and “robust” as previously described, 11 whereby P0 (differentiated) chondrocytes did not exhibit RVI. We have shown that P1 chondrocytes exhibited linear volume recovery deemed “slow” RVI over the course of the experiment. Conversely, P2 and P3 chondrocytes exhibited logarithmic volume recovery deemed “biphasic”, with robust RVI followed by slow RVI at rates similar to those observed in P1 chondrocytes. Previous work by us has shown a heterogeneous response to hypertonic challenge in 2-D cultured chondrocytes, whereby 54% of dedifferentiated chondrocytes exhibited RVI. 8 We here observed a more homogeneous response within 3 different stages of 2-D culture with a switch from slow to robust RVI. This may be attributed to potential selectivity of the culture protocol. Although cartilage is often deemed a homogenous tissue, recent work has indicated the existence of a progenitor population within cartilage with distinctive capacity to maintain a chondrocytic phenotype upon culture. 43 Indeed, differences in the regulation of chondrocyte pH were observed between the zones in situ, 44 and it may be argued that monolayer culture stimulates the outgrowth of a population of chondrocytes, which are later studied as dedifferentiated chondrocytes, often found to exhibit homogeneous mechanotransduction responses.
It has to be noted however that the newly developed methodology for the acquisition of “flat” cell volume figures assumes a high degree of similarity in response to hypertonic challenge between the nucleus and the cell. The ratios of percentage change in values for cell volume acquired using the nuclear coefficient formula in response to hypertonic challenge (relative to values in isotonic conditions) were compared to their counterpart ratios using values for cell volume obtained at 10% thresholding, and no significant differences were found (data not shown).
As no change in NKCC1 expression upon 2-D culture has been detected here or by others, 7 it can be suggested that the change in actin cytoskeletal organization upon 2-D culture 35 may have induced the activation of NKCC1 transporters. 8 Indeed, NKCC, and thus RVI, is regulated by F-actin, and interestingly, it has recently been shown that reorganization is linked to stretch-activated calcium channels, whereby the treatment of freshly isolated avian chondrocytes with Gd3+ induced RVI in response to hypertonic challenge. 9 Additionally, recent work in our research group has shown that NKCC1 knockdown using small interfering RNA (siRNA) did not abolish the capacity of C-20/A4 chondrocytes to exhibit RVI, thereby suggesting the involvement of other channels including epithelial sodium channel 45 or the Na(+)/H(+) exchanger. 46
Finally, changes in [Ca2+]i signaling in response to loss of phenotype upon 2-D culture were studied using REV5901 as an inducer of [Ca2+]i rise, and it was observed that there was a decrease in intracellular store contribution to REV5901-induced calcium rise in response to 2-D culture. Previous work has shown that mechanical pressure enhanced the sensitivity of inositol triphosphate receptors (activated in response to REV5901 loading), 13 possibly providing calcium-dependent chondroprotective mechanisms.47,48 Therefore, it can be suggested that the loss of phenotype may also contribute to the reduction in intracellular store sensitivity to REV5901 upon 2-D culture. Conversely, an increase in store operation via IP3 receptor up-regulation in response to culture, however, has been seen of both myocytes and smooth muscle cells.49,50 There was no change in total extracellular calcium influx upon REV5901 loading in response to culture despite changes in individual channel contribution to calcium influx as determined by using calcium channel inhibitors. The IF in the presence of ruthenium red did not undergo any significant change upon culture, suggesting no change in the role of TRPV channels in calcium homeostasis upon 2-D culture. Our work was nevertheless mildly limited by the nonspecific effect of ruthenium red as previously described, 51 and as a consequence of this, we are not able to discern the individual TRPV channels involved. Of interest are TRPV1, which has been previously shown to be up-regulated in response to 2-D culture, 52 and TRPV4, a key regulator of Sox9 expression. 53
Changes in the capacity of sodium-sensitive calcium channels and SACC to regulate REV5901-mediated rise in [Ca2+]i in response to culture were more prominent. The IF of sodium-free BPS decreased upon culture, which supported previous observations of an unidentified channel shown to mediate Gd3+-insensitive rise in [Ca2+]i in freshly isolated bovine articular chondrocyte 11 and thus suggested NCX as a potential candidate. Conversely, the sensitivity of REV5901-induced [Ca2+]i rise to Gd3+ inhibition increased upon 2-D culture, thereby confirming previous reports that SACC is involved in mechanotransduction following a change in either morphology and/or phenotype.11,12 Moreover, treatment of chondrocytes with Gd3+ has been previously shown to induce the loss of a differentiated phenotype 12 potentially via a calcium-dependent pathway. 54
Together, these data have confirmed and quantified changes documented in response to 2-D culture, and these differences were considered “markers” of dedifferentiation necessary for future experiments. Indeed, the differentiated phenotype encompasses more than the collagens produced, and mechanotransduction responses as a marker of phenotype should be used to provide a more accurate understanding of chondrocyte function during expansion for the purposes of ACI therapy. As similar conclusions have been drawn in other species including porcine and avian tissue, future work to ascertain the applicability of these conclusions to human chondrocytes is required. Additional work to assay changes within the first 9 days in culture is required to better understand the cause and effect relationships between the various markers. Nevertheless, these data suggested the existence of a distinct phenotype in P1 chondrocytes previously undefined, characterized by 1) the up-regulation of type II collagen and Sox9 and 2) the exhibition of slow RVI and Gd3+-sensitive Ca2+ signaling and termed “mesodifferentiated” ( Table 2 ).
Summary of the Properties of Differentiated, Mesodifferentiated, and Dedifferentiated Chondrocytes as Defined Using Key Markers of Phenotype
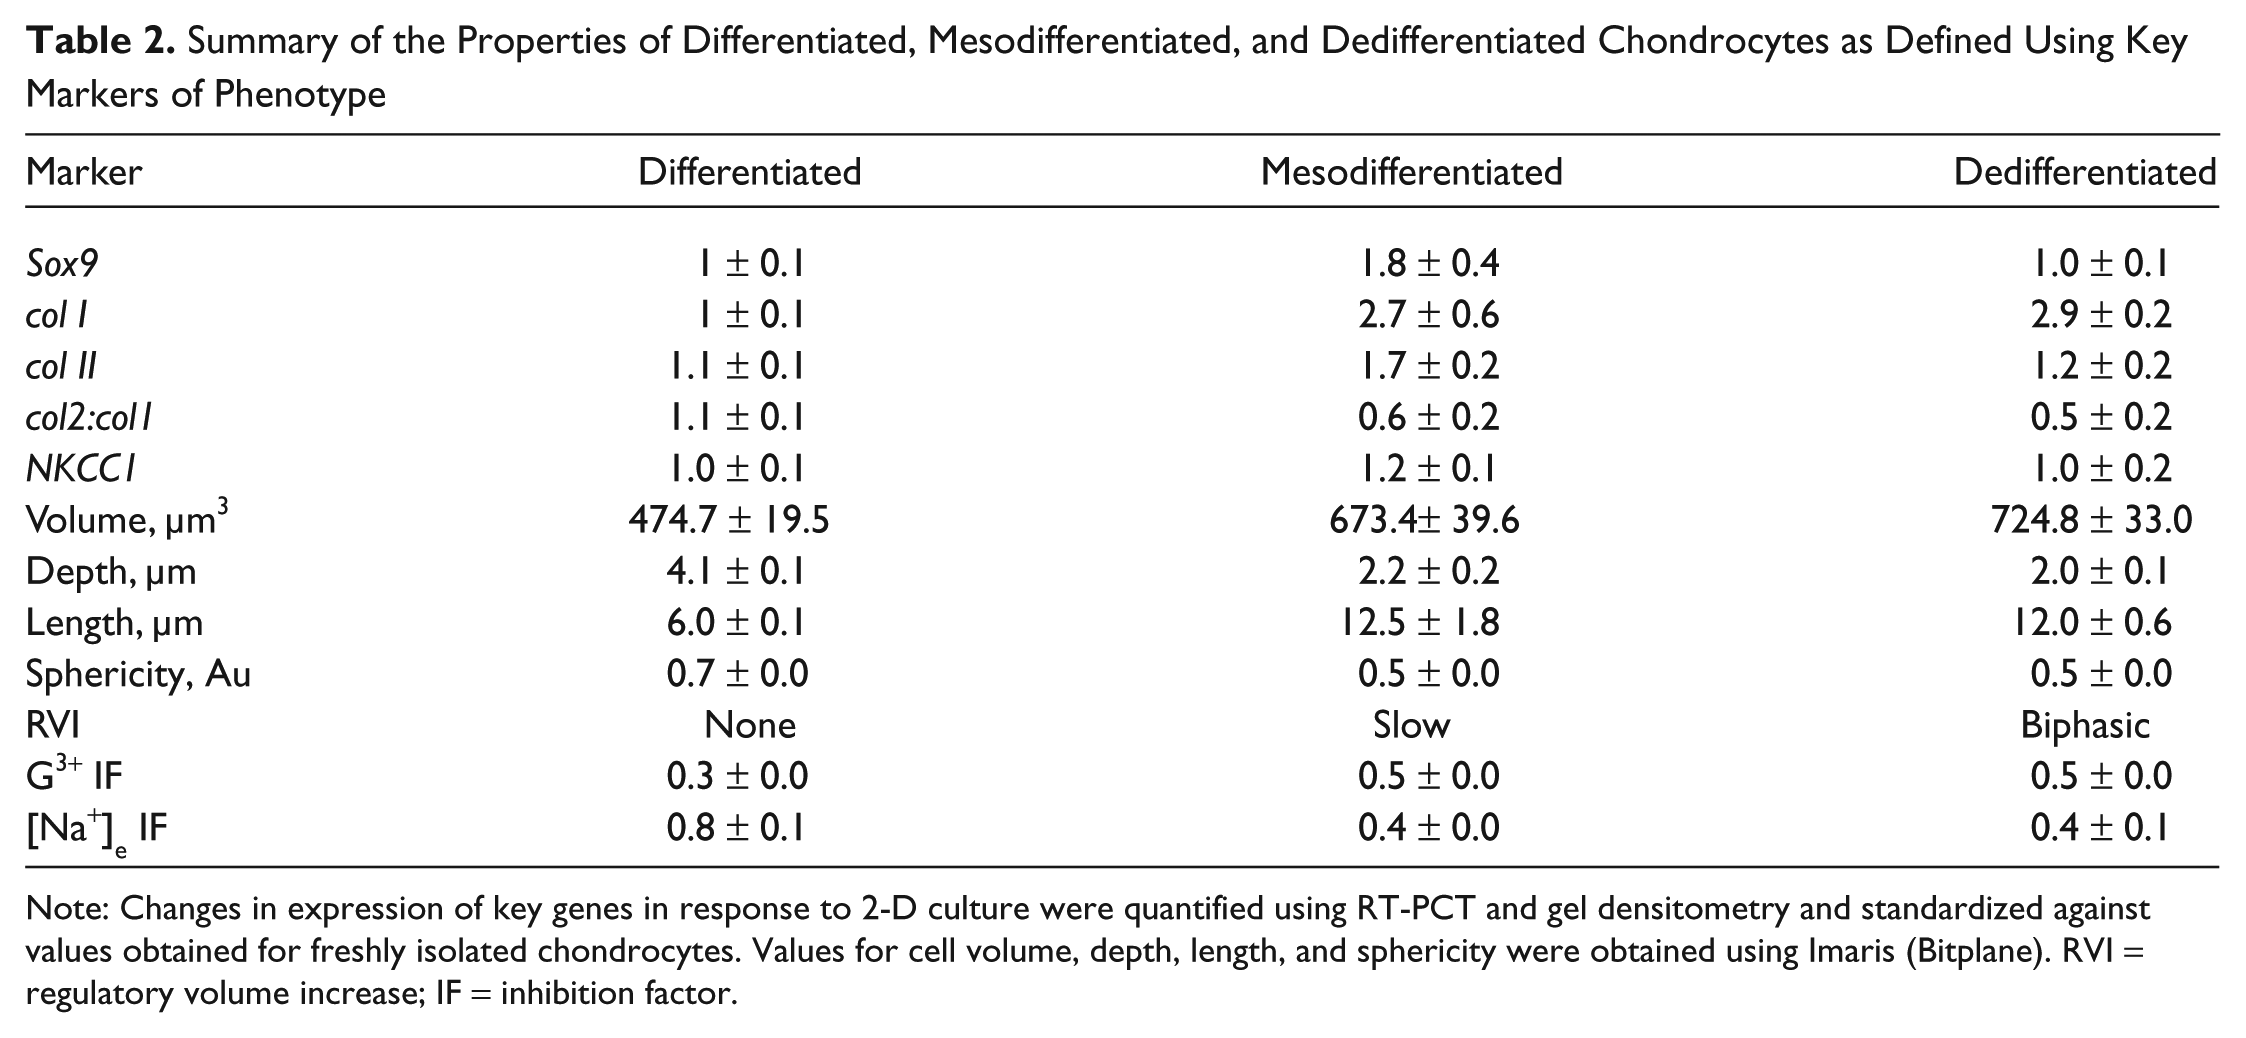
Note: Changes in expression of key genes in response to 2-D culture were quantified using RT-PCT and gel densitometry and standardized against values obtained for freshly isolated chondrocytes. Values for cell volume, depth, length, and sphericity were obtained using Imaris (Bitplane). RVI = regulatory volume increase; IF = inhibition factor.
Footnotes
Acknowledgments and Funding
The authors acknowledge Professor Tajalli Keshavarz at the University of Westminster for his general administrative support. This work was conducted upon a generous fee waiver awarded by the Cavendish Campus at the University of Westminster. Additional funding was kindly donated by Mr. Andrew Harcourt and Dr. Ziad T. Qusous. This work was conducted at the University of Westminster.
Declaration of Conflicting Interests
The author(s) declared the following potential conflicts of interest with respect to the research, authorship, and/or publication of this article: Ala Qusous contributed to the conception and design of the study, acquisition of data and analysis, interpretation of data presented in this work, personally drafted the article, and revised it critically for important intellectual content. Mark J.P. Kerrigan was involved in the conception of design of research, the interpretation of the data, and revision of the article. Neither the University of Westminster, Mr. Harcourt, nor Dr. Z. Qusous were involved in study design, collection, and analysis; interpretation of data; in the writing of the article; or in the decision to submit the article for publication. The authors hereby declare that they have no current financial and personal relationships or affiliations with other people or organizations that could have potentially and inappropriately influenced this work and conclusions.
Ethical Approval
This study was approved by our institutional review board.
References
Supplementary Material
Please find the following supplemental material available below.
For Open Access articles published under a Creative Commons License, all supplemental material carries the same license as the article it is associated with.
For non-Open Access articles published, all supplemental material carries a non-exclusive license, and permission requests for re-use of supplemental material or any part of supplemental material shall be sent directly to the copyright owner as specified in the copyright notice associated with the article.