
Abstract
AMP-activated kinase (AMPK) is a key metabolic sensor and stress signaling kinase. AMPK activity is known to suppress anabolic processes such as protein and lipid biosynthesis and promote energy-producing pathways including fatty acid oxidation, resulting in increased cellular energy. In addition, AMPK localizes to centrosomes during cell division, plays a role in cellular polarization, and directly targets p53, affecting apoptosis. Two distinct catalytic AMPKα isoforms exist: α1 and α2. Multiple reports indicate that both common and distinct functions exist for each of the 2 α isoforms. AMPK activation has been shown to repress tumor growth, and it has been suggested that AMPK may function as a metabolic tumor suppressor. To evaluate the potential role of each of the AMPKα isoforms in modulating cellular transformation, susceptibility to Ras-induced transformation was evaluated in normal murine embryonic fibroblasts (MEFs) obtained from genetically deleted AMPKα1- or AMPKα2-null mice. This study demonstrated that while AMPKα1 is the dominant AMPK isoform expressed in MEFs, only the AMPKα2-null MEFs displayed increased susceptibility to H-RasV12 transformation in vitro and tumorigenesis in vivo. Conversely, AMPKα1-null MEFs, which demonstrated compensation with increased expression of AMPKα2, displayed minimal transformation susceptibility, decreased cell survival, decreased cell proliferation, and increased apoptosis. Finally, this study demonstrates that AMPKα2 was selectively responsible for targeting p53, thus contributing to the suppression of transformation and tumorigenic mechanisms.
Keywords
Introduction
AMP-activated kinase (AMPK) is a heterotrimeric protein composed of a catalytic α subunit and 2 regulatory subunits, β and γ. The α subunit contains a serine/threonine protein kinase catalytic domain. 1 AMPK has been identified as a primary sensor of cellular energy change by responding to increases in AMP:ATP ratios resulting from exposure to cellular stresses such as hypoxia, nutrient deprivation, and heat shock. Activation of AMPK results in conservation of cellular energy by decreasing energy consumption through inhibition of cell growth, proliferation, and protein synthesis and, instead, increases energy production through catabolic pathways such as fatty acid oxidation. 2 There are 2 AMPKα isoforms: AMPKα1 and AMPKα2. Although highly homologous, it is becoming increasingly clear that AMPKα1 and AMPKα2 have mutual and exclusive functions. AMPKα1 and AMPKα2 are encoded by 2 distinct genes, and it has been shown that the tissue distribution and cellular localization of AMPKα1 and AMPKα2 proteins are different.3-5 Furthermore, mouse genetic deletion studies have shown that when fed a high-fat diet, AMPKα2-null mice demonstrate glucose intolerance, reduced insulin sensitivity, increased cholesterol levels, weight gain, and adiposity, while AMPKα1-null mice do not show any appreciable alterations when fed a similar diet.6-9 Conversely, AMPKα1-null mice display changes in eNOS activation and relaxation of blood vessels in response to the AMPK activator, AICAR, while these changes were not observed in AMPKα2-null mice.10,11
Many studies have shown that AMPK plays a significant role in cancer cell metabolism and growth.12-14 Specifically, activation of the AMPK pathway, by pharmacological agents such as AICAR and metformin, has been shown to reduce tumor growth in a number of experimental tumor models including breast, acute myeloid leukemia, renal, glioma/neuroblastoma, ovarian, and intestinal cancer.15-23 In addition, 2 retrospective clinical studies have shown that diabetic patients being treated with metformin had a lower incidence of cancer when compared to patients on other treatments.24,25 Additionally, LKB1/STK11, an AMPK upstream kinase, is a known tumor suppressor that is mutated in the inherited autosomal-dominant Peutz-Jeghers syndrome.26,27 These patients display loss of heterozygosity in the LKB1 gene and present with multiple benign lesions in the intestine and have increased risk of malignancies at other sites. 28 Frequent mutations in LKB1 are also observed in lung, endometrial, and cervical cancers, and LKB1 deficiency sensitizes mice to carcinogen-induced skin and lung tumorigenesis. 29 Finally, it was recently shown that 90% of primary breast cancer samples in a test cohort displayed decreased levels of active AMPK, as determined by immunohistochemistry for phosphorylated AMPK and acetyl CoA carboxylase. 30
These data suggest that AMPK may function as a tumor suppressor and that suppression of AMPK activity is required for cancer cell transformation and/or cancer progression. However, the potential contribution or requirement for either AMPKα isoform during tumorigenesis and/or cellular transformation still remains unclear. This study utilized genetic knockout of the AMPKα1 or the AMPKα2 isoforms in murine embryonic fibroblasts (MEFs) to clearly evaluate the potential for AMPKα isoforms to independently modulate cellular transformation by H-RasV12.
Results
AMPKα isoform expression in primary and H-RasV12–transformed wild-type (WT) and AMPKα1- and AMPKα2-null MEFs
In order to evaluate the contribution of each AMPKα isoform to cellular transformation, MEFs were isolated from C57Bl/6 WT, AMPKα1-null, and AMPKα2-null embryos. Genotypes of the primary MEF cells were confirmed using standard genotyping PCR (data not shown). Additionally, RNA was isolated from first-passage MEFs, and expression of AMPKα1 and AMPKα2 were evaluated by quantitative real-time PCR (qRT-PCR) (Fig. 1A). WT cells from either AMPKα1+/− × AMPKα1+/− or AMPKα2+/− × AMPKα2+/− crosses displayed AMPKα1 mRNA as the dominant AMPKα isoform, with AMPKα2 mRNA expressed at approximately 25% of the level of AMPKα1. As expected, no detectable AMPKα1 or AMPKα2 mRNA was found in their respective null MEFs. Interestingly, there was a significant 4-fold increase in the expression of AMPKα2 mRNA in the AMPKα1-null MEFs; however, there was no change in AMPKα1 mRNA in the AMPKα2-null MEFs.

Expression of AMPKα isoforms in nontransformed and H-RasV12–transformed WT and AMPKα-null MEFs. MEFs were isolated from WT (α1-WT/α2-WT), AMPKα1-null (α1-KO), and AMPKα2-null (α2-KO) mice. (
To address the potential contribution of AMPKα1 and/or AMPKα2 towards cellular transformation susceptibility, MEFs were transduced with a H-RasV12–Flag retrovirus. Cells were selected for resistance, and protein extracts were isolated to confirm equal expression of the active H-RasV12–Flag (Fig. 1B). Ras-Flag protein expression in stably transfected MEFs was shown to be relatively equal in all cell lines, suggesting the presence of equal amounts of H-RasV12. To confirm that H-RasV12 expression in the MEFs did not change the expression of the AMPKα isoforms, RNA was isolated from Ras-Flag–expressing MEFs and evaluated by qRT-PCR (data not shown). AMPKα1 mRNA expression remained the dominant isoform, and AMPKα2 mRNA expression was increased in AMPKα1-null cells, indicating maintenance of the AMPKα isoform expression phenotype observed in nontransformed MEFs, as shown in Figure 1A. To assure commensurate protein expression, AMPKα isoforms were directly assessed by immunoblot (Fig. 1C) and normalized to β-actin loading control (Fig. 1D). AMPKα1 protein was the major isoform expressed, while the AMPKα2 protein was present at a minimal level in WT H-RasV12 cells. AMPKα1 and AMPKα2 expression was not detected in H-RasV12–transformed AMPKα1- and AMPKα2-null cells, respectively. AMPKα2 protein was increased in AMPKα1-null cells, consistent with mRNA expression data, while no change was observed in the AMPKα1 protein in the AMPKα2-null cells when compared to WT control cells. Taken together, these data demonstrate that AMPKα1 is the major AMPKα isoform in WT MEFs, and the ratio of AMPKα1 to AMPKα2 in each of the cell lines was not affected by H-RasV12–Flag expression. Interestingly, while AMPKα2-null MEFs did not display any significant change in AMPKα1 protein expression, AMPKα1-null MEFs appeared to activate a compensatory mechanism for the loss of AMPKα1 with increased expression of the AMPKα2 protein.
Analysis of H-RasV12 transformation capacity of AMPKα1-null MEFs
In order to evaluate the effect of H-RasV12 expression in AMPKα1-null MEFs, cells were assayed for cell growth over time and downstream signaling events resulting from expression of the active Ras mutant, H-RasV12. Cell growth was determined by MTT assay over 4 days (Fig. 2A). Only a moderate increase in MTT signal was observed over 4 days, with no significant differences between the WT control and AMPKα1-null H-RasV12–transformed MEFs. Since these cells express a similar amount of H-RasV12–Flag, the downstream targets of Ras were assessed for total amount and activation by immunoblot (Fig. 2B). Protein-specific immunoblot signals were then normalized to total target expression and β-actin loading control (Fig. 2C). The activation level of C-Raf was established by detection of phosphorylation at serine 338 compared to the total amount of C-Raf. C-Raf activation was found to be similar between the WT H-RasV12 and AMPKα1-null H-RasV12 cell lines. However, downstream MAPK activation, as measured by phosphorylation at Thr202/Tyr204, was twice the level in AMPKα1-null MEFs compared to WT H-RasV12–transformed cells. Since there was no significant difference in cell proliferation in the AMPKα1-null H-RasV12 cells despite having more active p-MAPK1/2, apoptotic events were evaluated by immunoblot for cleaved caspase-3. Increased cleaved caspase-3 was observed in the AMPKα1-null H-RasV12 cells when compared to the WT H-RasV12 cells (Fig. 2B). These data suggest that while WT H-RasV12 and AMPKα1-null H-RasV12 cells demonstrate significant activation of the Ras/MAPK pathway, the high levels of p-MAPK in AMPKα1-null cells did not translate into increased cell growth since there was a concomitant increase in apoptosis.
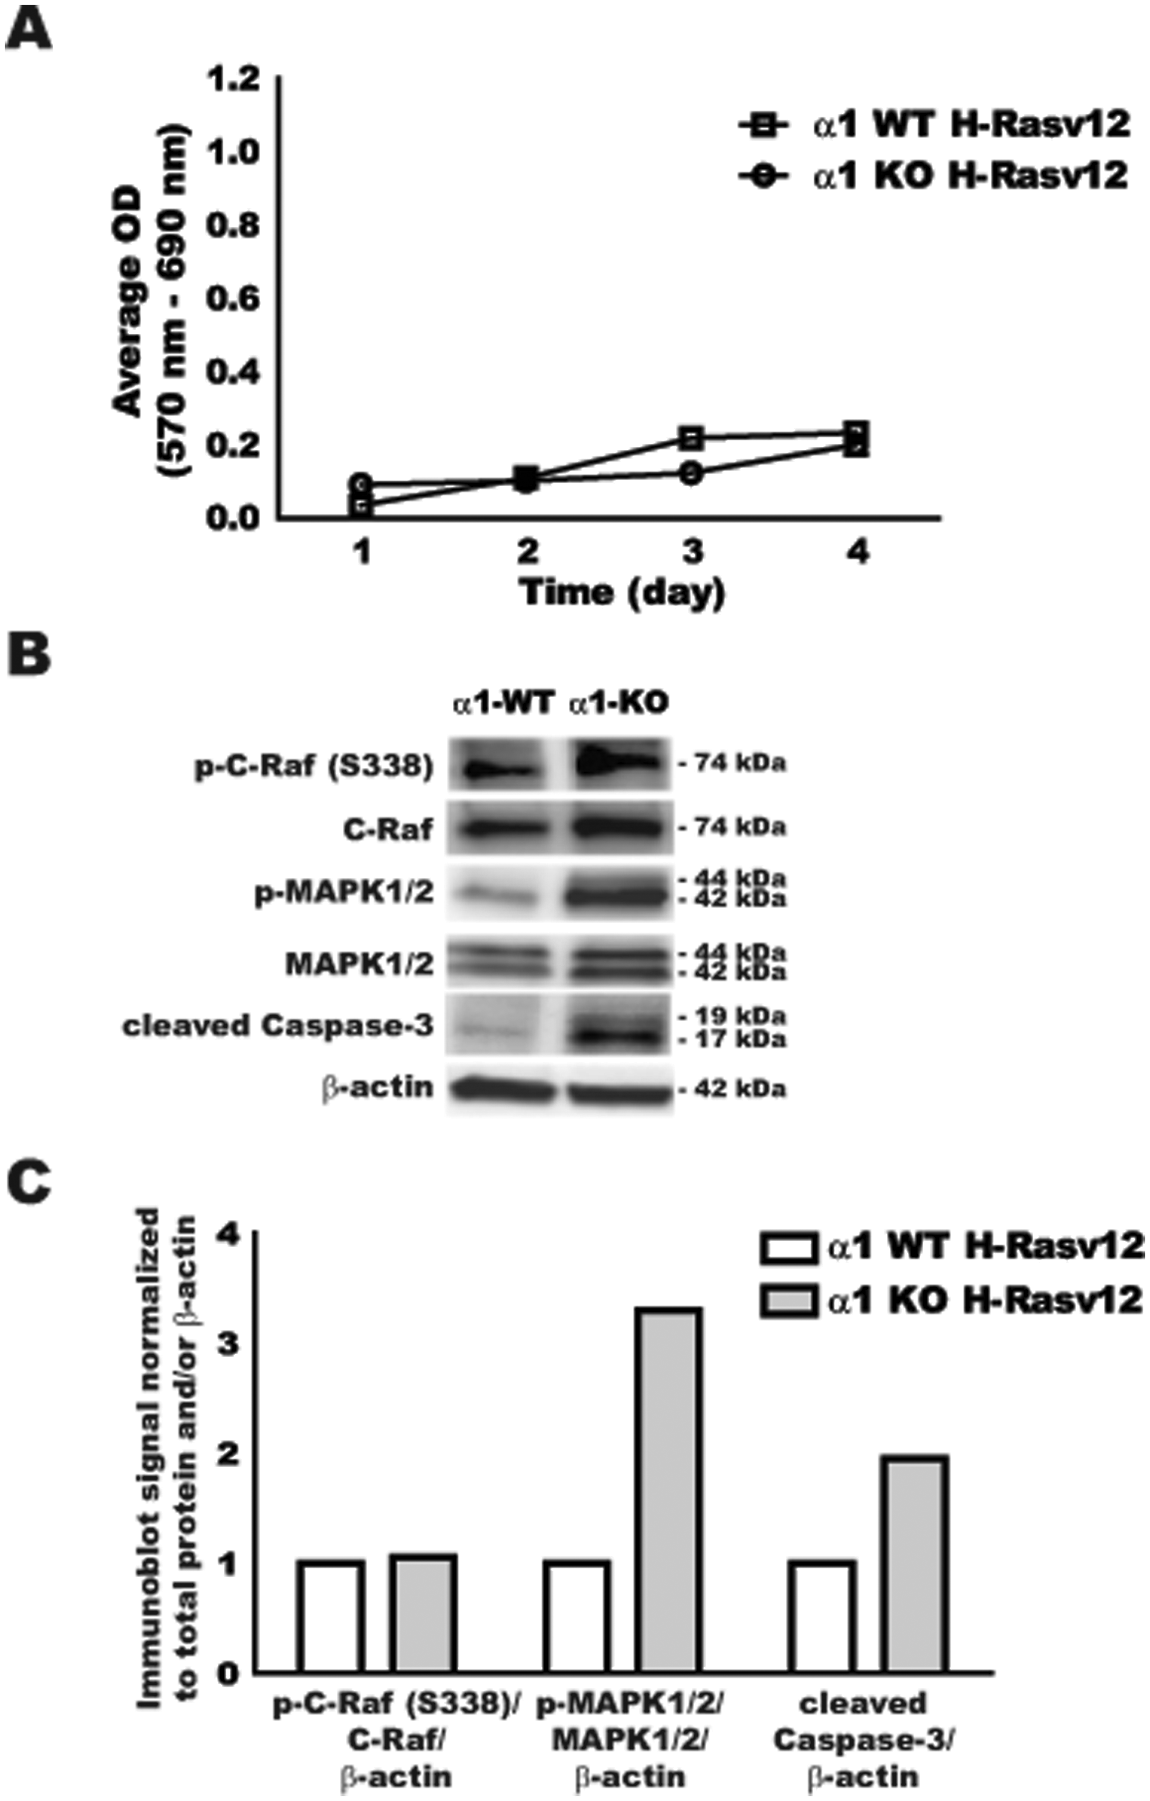
Analysis of H-RasV12 transformation capacity of AMPKα1-null MEFs. Litter-matched H-RasV12–transfected AMPKα1 WT (α1-WT) and AMPKα1-null (α1-KO) MEFs were evaluated for cell growth and basal signaling. (
Analysis of H-RasV12 transformation capacity of AMPKα2-null MEFs
In order to evaluate the effect of H-RasV12 expression in AMPKα2-null MEFs, cell growth and signaling were evaluated similarly to the AMPKα1 MEFs. As an additional control for cell transformation selective to H-RasV12, litter-matched WT and AMPKα2-null MEFs were also transduced with a GFP-expressing retrovirus. Cell growth for the selected transformed cells was evaluated by MTT assay over 4 days (Fig. 3A). The WT GFP cells displayed only minimal growth over 4 days, while the WT H-RasV12 cells demonstrated a significant increase in growth over time. Interestingly, both AMPKα2-null GFP and AMPKα2-null H-RasV12 cell lines displayed significant increases in growth at 3 and 4 days compared to their respective WT cell lines. To begin to define why the AMPKα2-null GFP and AMPKα2-null H-RasV12 cells displayed increased cellular growth, Ras pathway targets were evaluated by immunoblot (Fig. 3B) and quantified by normalization to total protein and the β-actin loading control (Fig. 3C). In AMPKα2-null cells transfected with the control GFP vector, there was an increase in p-C-Raf and p-MAPK1/2 levels when compared to WT GFP control cells in addition to an apparent increase in total C-Raf. H-RasV12 transformation activated C-Raf in both WT and AMPKα2-null lines; however, the activation of MAPK1/2 was even more prominent in the AMPKα2-null line when compared to the WT H-RasV12 cells, consistent with growth patterns observed in the MTT assay. Control GFP and H-RasV12–Flag expression was confirmed by immunoblot for GFP and Flag protein, respectively (Fig. 3B). These data suggest that H-RasV12 expression in AMPKα2-null MEFs results in increased cell growth likely mediated through changes in the Ras-Raf-MAPK signaling pathway without the excess apoptosis that was observed in AMPKα1-null cells (data not shown). Interestingly, in AMPKα2-null cells, promotion of active MAPK does not require H-RasV12 expression since the loss of AMPKα2 alone is permissive for higher baseline Ras-Raf-MAPK signaling and a correlative in vitro growth advantage even in the AMPKα2-null GFP cells.
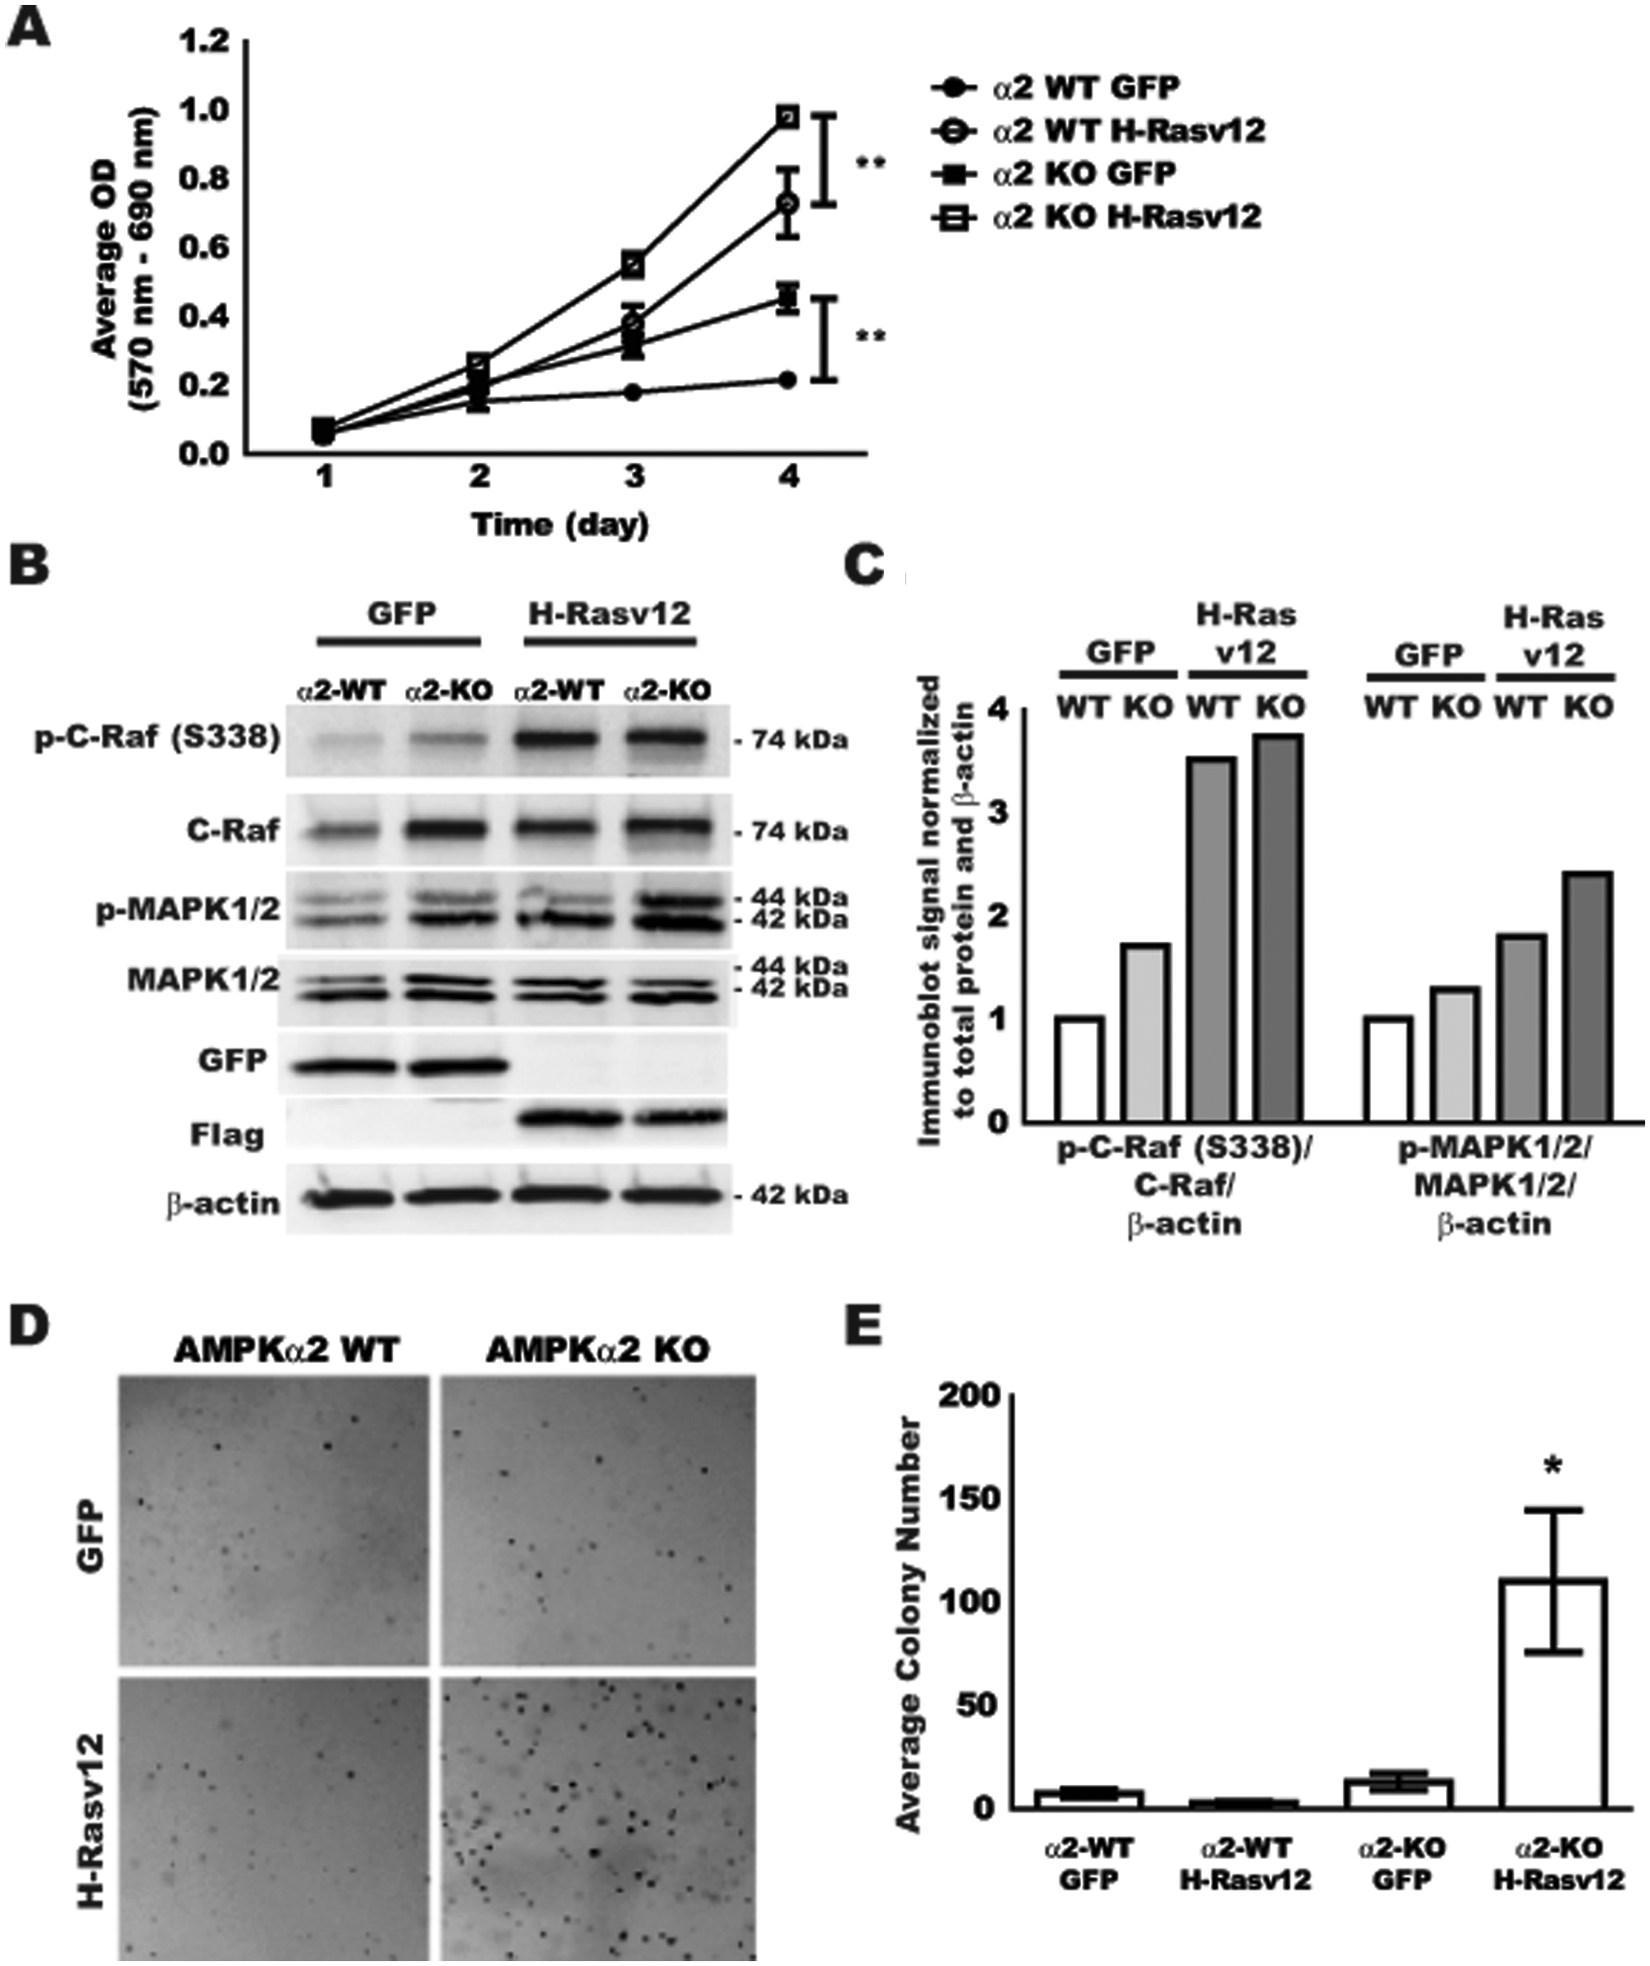
Analysis of H-RasV12 transformation capacity of AMPKα2-null MEFs. Litter-matched GFP and H-RasV12–transfected AMPKα2 WT and AMPKα2-null MEFs were evaluated for cell growth, basal signaling, and anchorage-independent growth. (
In order to assess whether the growth advantage displayed in 2-dimensional cultures might predict anchorage-independent growth potential, transformed MEF lines were evaluated in a soft agar assay. GFP and H-RasV12–transduced MEFs were seeded into 0.3% agarose, fed twice a week for 3 weeks, and expanded colonies were imaged for quantification (Fig. 3D and 3E, respectively). Surprisingly, only the AMPKα2-null H-RasV12–transformed MEFs displayed significant colony formation in soft agar. There was no difference observed between AMPKα2 WT cells transduced with GFP or H-RasV12. These data suggest that while WT H-RasV12 and AMPKα2-null GFP MEFs have a growth advantage in 2-dimensional cultures over several days, this does not translate into a growth advantage in anchorage-independent growth for several weeks, where only the AMPKα2-null H-RasV12 MEFs were able to expand in this assay.
Tumorigenic potential of H-RasV12–transformed WT, AMPKα1-null, and AMPKα2-null MEFs
To determine if the cell proliferation and colony formation assays predict the tumorigenic potential of H-RasV12–transformed AMPKα2-null cells in vivo, a xenograft model of tumor initiation and expansion was implemented. Since there were no significant differences in growth potential for AMPKα1 WT H-RasV12 or AMPKα2 WT H-RasV12 MEFs (Figs. 2A and 3A), nor significant differences between these cells in tumorigenic assays, WT H-RasV12 tumor data were combined for comprehensive tumor growth analyses. AMPKα WT H-RasV12, AMPKα1-null H-RasV12, and AMPKα2-null H-RasV12 cells were injected into the flanks of athymic nude mice, and tumor growth was evaluated over 3 weeks (Fig. 4A). Interestingly, only the AMPKα2-null H-RasV12 cells resulted in significant tumors with a short lag time of only 13 days prior to transition into exponential growth. The WT H-RasV12 cells did expand minimally after a significant lag time of approximately 20 days, while the AMPKα1-null H-RasV12 cells did not expand at all. Tumor weights at harvest corresponded well with the external caliper measurements (Fig. 4B). AMPKα2-null H-RasV12 tumors were 4 times larger than the AMPKα WT H-RasV12 tumors, and the AMPKα1-null H-RasV12 tumors were the smallest of the groups. Representative histology images of 2 tumors from each group are shown in Figure 4C. The overall impression of staining, particularly the nuclear hematoxylin staining, indicates dense fibroblastic tumors in the AMPKα2-null H-RasV12 group, while the WT H-RasV12 tumors were similar but displayed more of an eosinophilic matrix or stromal pattern. The AMPKα1-null H-RasV12 tumors were minimally cellular with very few tumor cells present, thus not providing enough tumor area for quantitative histological analysis. In summary, the tumorigenic analysis of the MEF cell lines suggests that the AMPKα2-null H-RasV12 cells not only gained a growth advantage in 2- and 3-dimensional in vitro cultures but also were able to be transformed by H-RasV12 expression into highly tumorigenic cells.
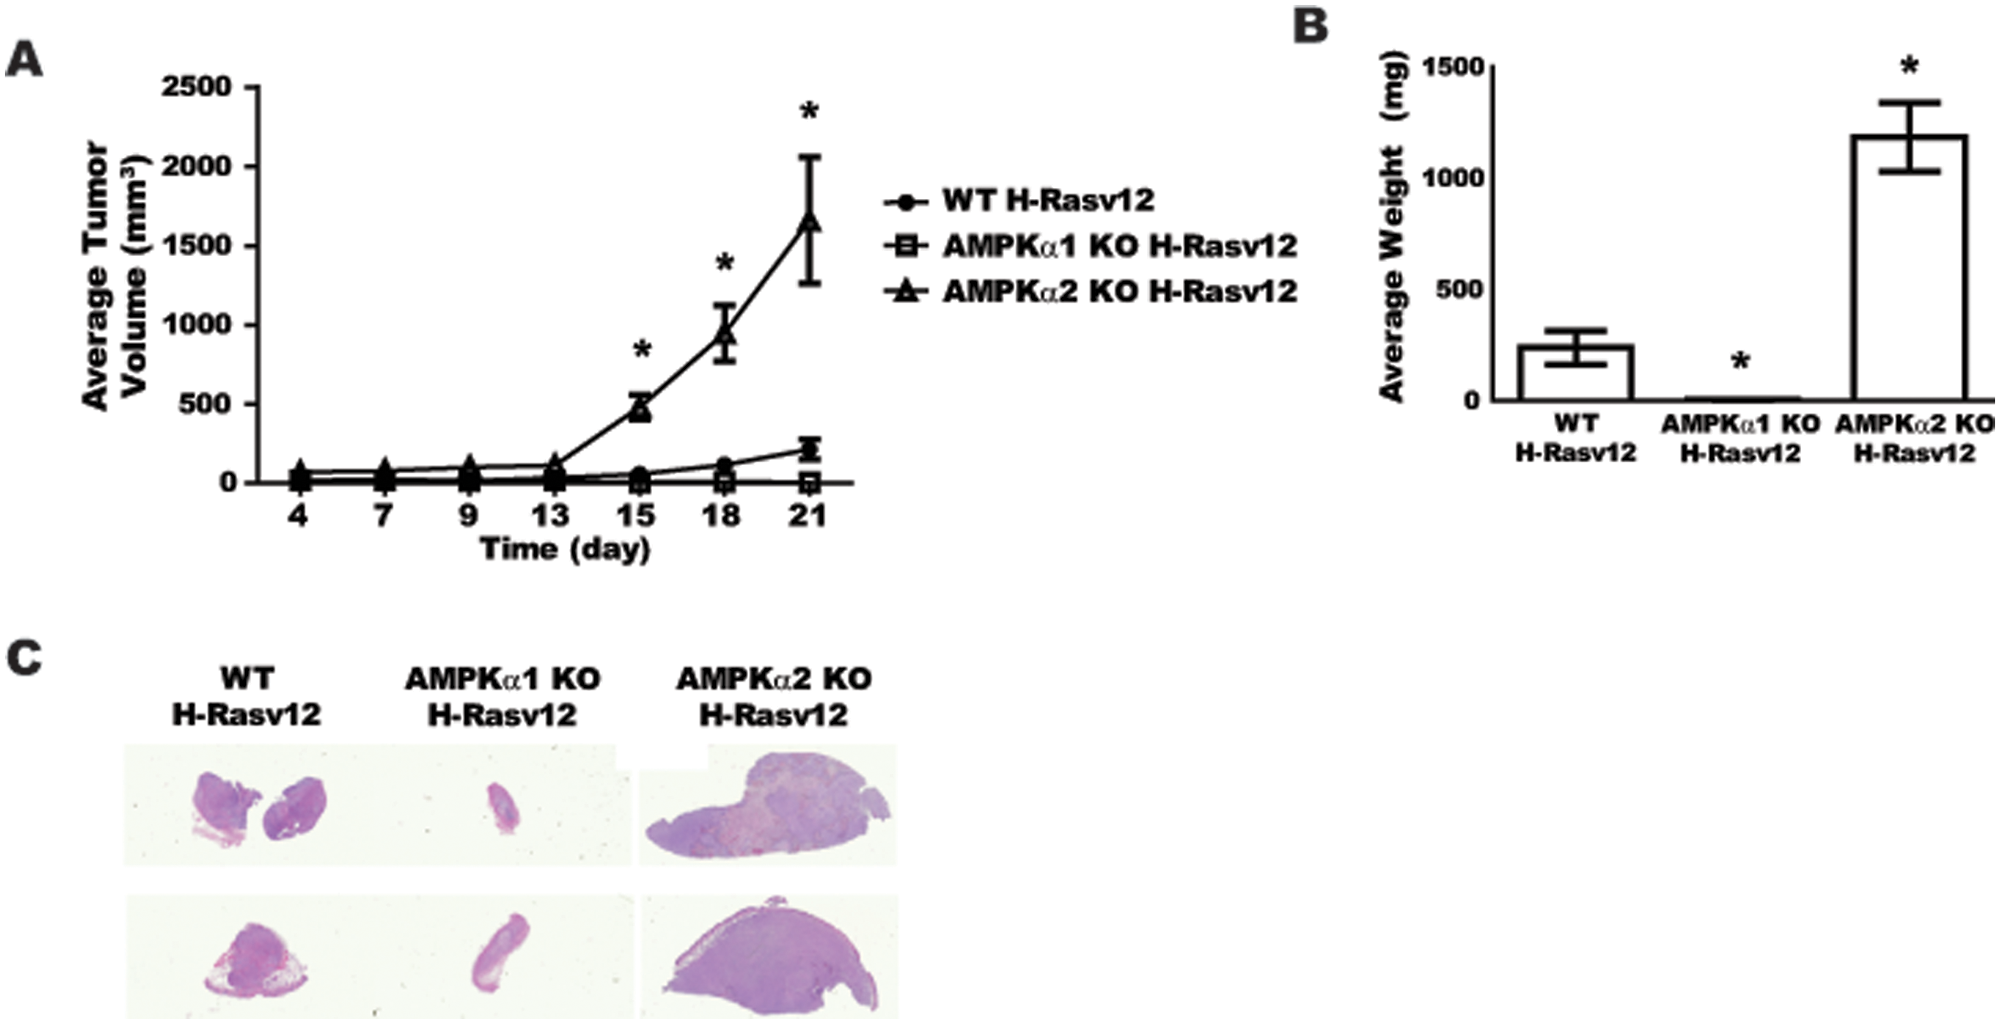
In vivo analysis of H-RasV12–transformed WT, AMPKα1-null, and AMPKα2-null MEFs. WT H-RasV12 (●), AMPKα1 KO H-RasV12 (□), and AMPKα2 KO H-RasV12 (△) MEFs (2 × 10⁶) were injected into the flank of athymic nude mice, and growth was monitored for 3 weeks (n = 10 animals/group). (
Comprehensive histological analyses of MEF tumors
In an effort to elucidate the mechanisms that resulted in increased tumor growth for the AMPKα2-null H-RasV12 cells when compared to the WT H-RasV12–transformed cells, histological analyses were performed for tumor cell density as well as immunohistochemistry for tumor cell proliferation and apoptosis (Fig. 5). H&E staining of tumors revealed that cellular density based on nuclear staining was similar between WT and AMPKα2-null H-RasV12 tumors (Fig. 5A). However, there were significant differences between these groups at the level of proliferation and apoptosis. Ki67 staining was increased by approximately 40% in the AMPKα2-null H-RasV12 tumors when compared to the WT controls (Fig. 5B). Conversely, cleaved caspase-3 staining was decreased by approximately 35% in the AMPKα2-null H-RasV12 tumors when compared to the WT H-RasV12 tumors (Fig. 5C). These data demonstrate that AMPKα2-null H-RasV12 tumors displayed increased tumor cell proliferation as well as decreased apoptosis, which likely contributed to the increased tumor growth and cell survival. Since there was a significant difference in the level of apoptosis in the tumors and since it has recently been shown that p53 (TP53) is a direct substrate for AMPK,31-34 the level of p53 protein expression was evaluated in these tumors (Fig. 5D). The expression of p53 was significantly decreased in the AMPKα2-null H-RasV12 tumors when compared to WT H-RasV12 tumors. These data suggest that the AMPKα2-null H-RasV12 cells achieve a growth advantage over the WT H-RasV12 cells through increased levels of proliferation and decreased apoptosis at least partially through a p53-dependent pathway.
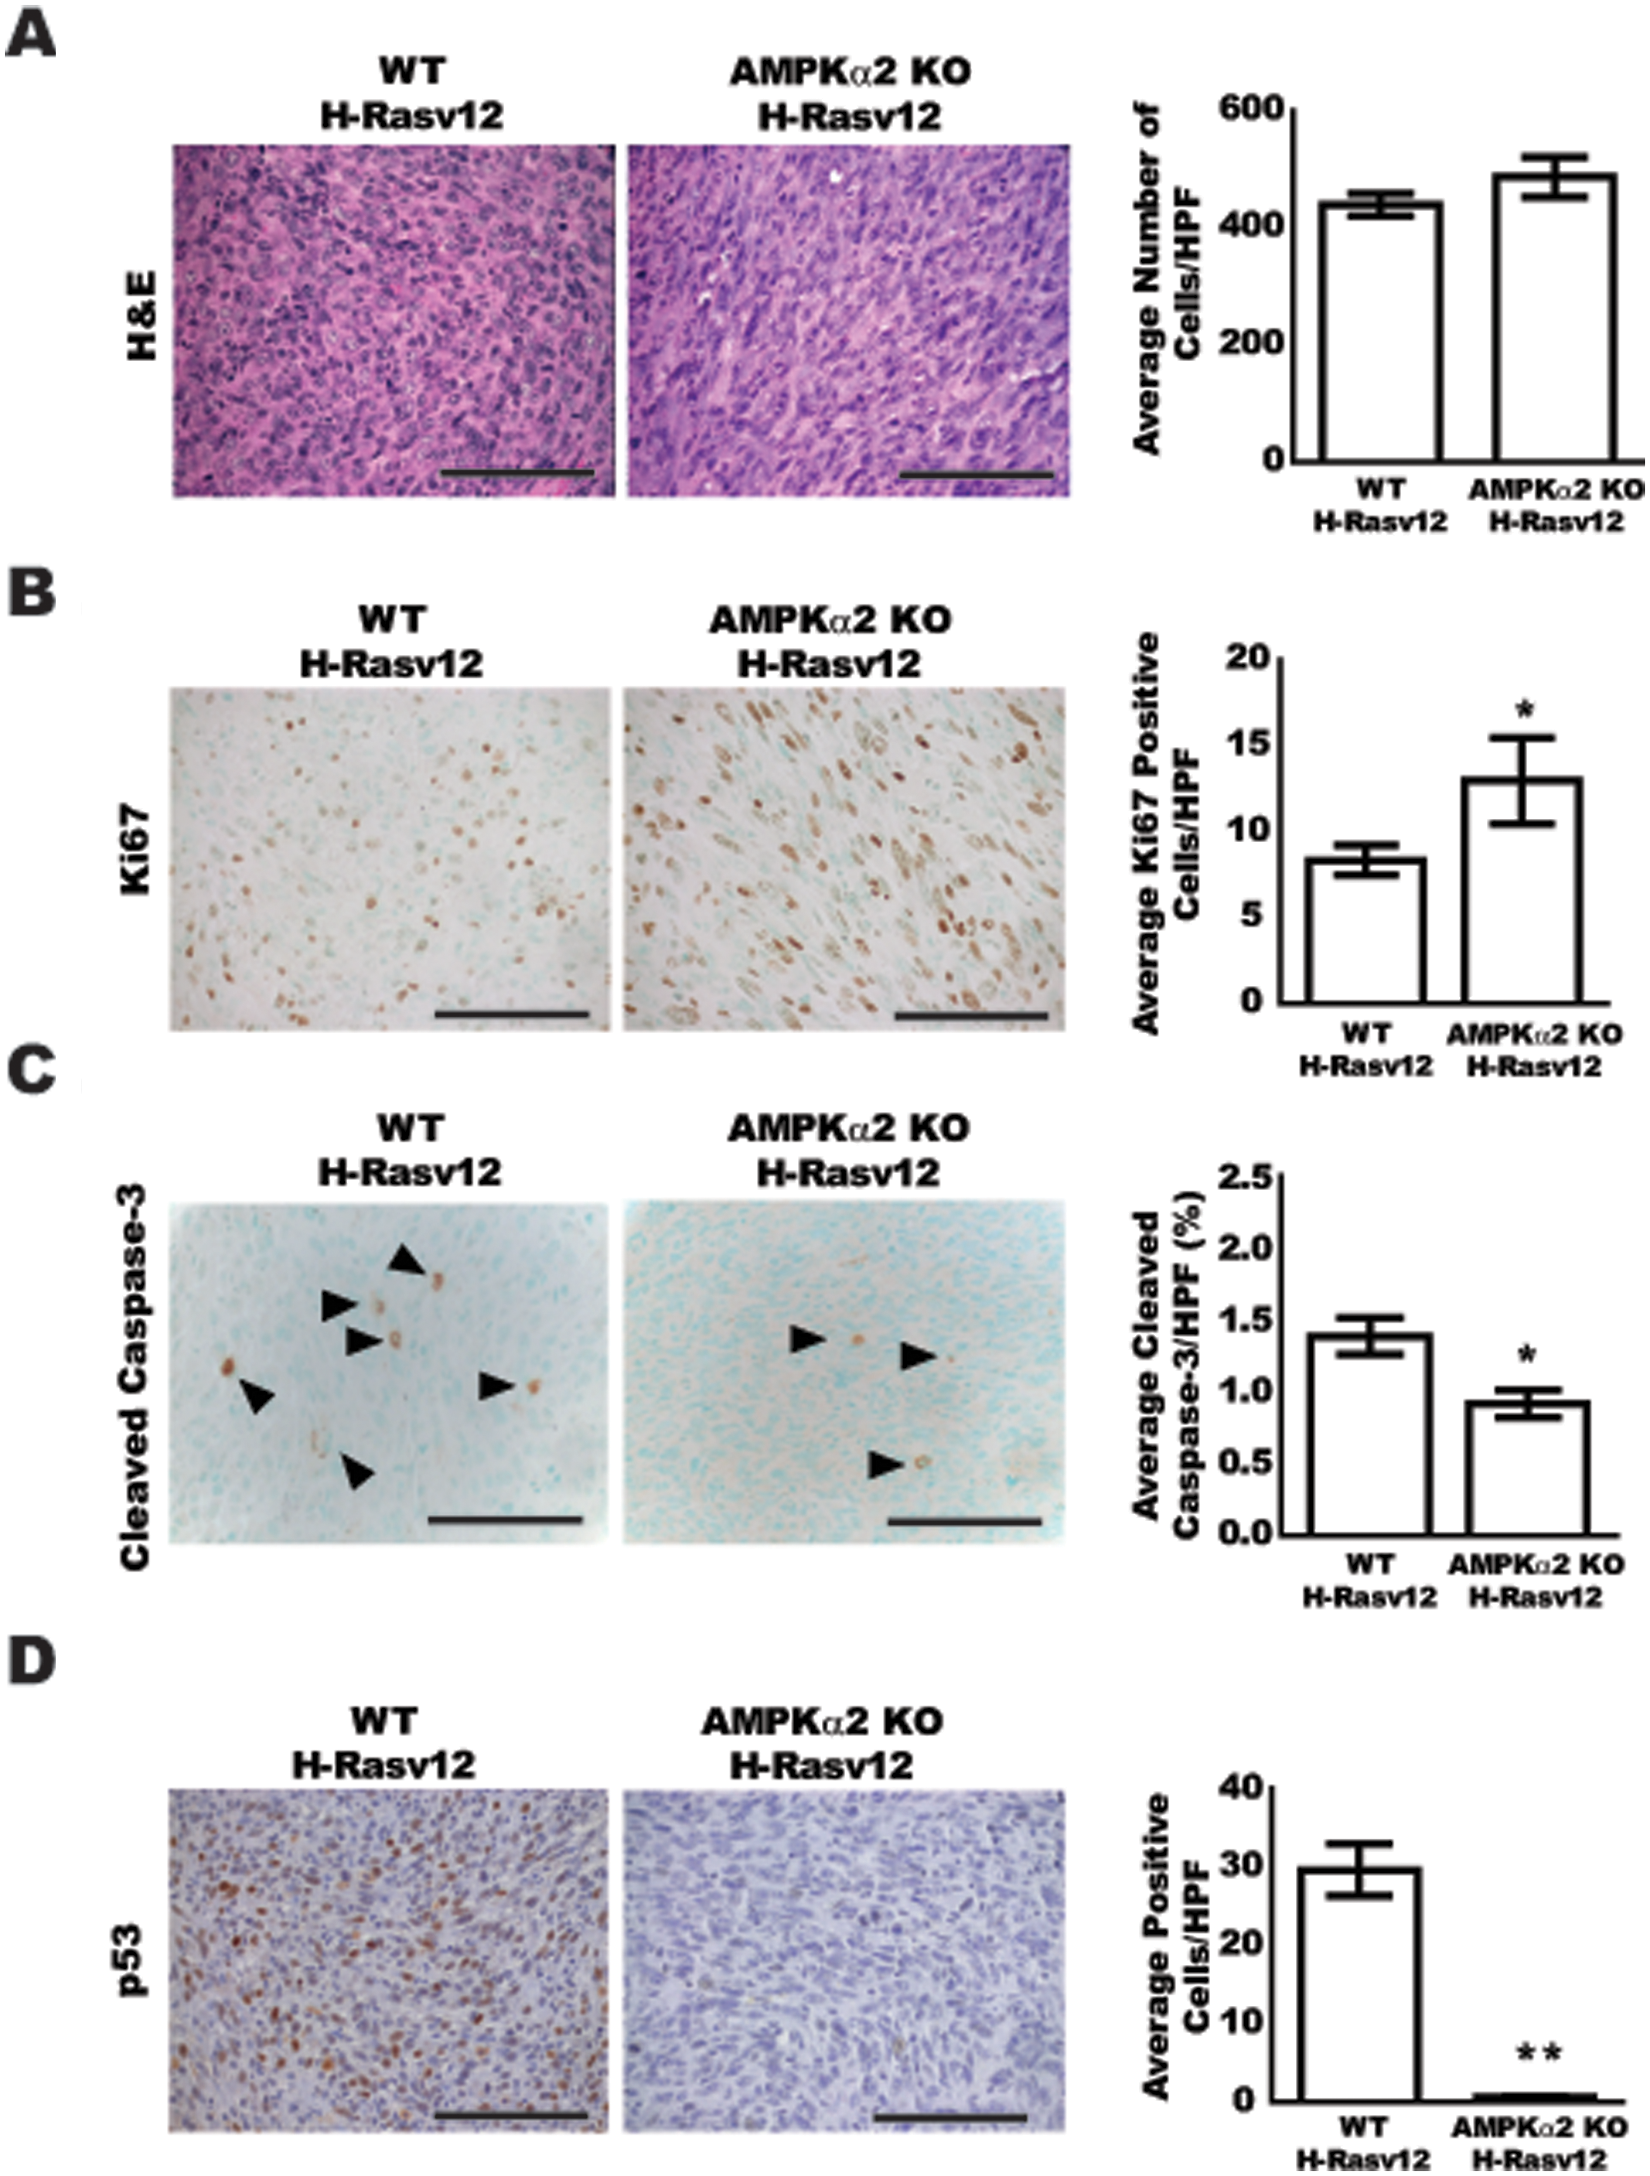
Comprehensive histological analysis of MEF tumors. Tumor sections from WT H-RasV12 and AMPKα2 KO H-RasV12 were stained with H&E, Ki67, cleaved caspase-3, and p53 (n = 5 animals/group). Five high-power (40×) fields were imaged for each slide and quantified using Image Pro Plus software (H&E, Ki67) or direct cell counts (cleaved caspase-3). (
Effect of H-RasV12 transformation of AMPKα1-null and AMPKα2-null MEFs on p53 protein expression
In order to assess whether the decrease in p53 protein expression was an AMPKα isoform–specific event, transformed cell lysates from WT H-RasV12, AMPKα1-null H-RasV12, and AMPKα2-null H-RasV12 cells were evaluated for p53 protein levels by immunoblot (Fig. 6A). Consistent with the observation that p53 was decreased in the AMPKα2-null H-RasV12 tumors, p53 expression was significantly decreased in the AMPKα2-null cell lysates when compared to WT H-RasV12 samples. Interestingly, p53 levels were actually increased in the AMPKα1-null cell lysates when compared to WT H-RasV12 cell samples. In order to assess the inducibility of p53 protein expressed in these cell lines, cells were exposed to ultraviolet (UV) light in order to induce p53 expression (Fig. 6B). WT H-RasV12 and AMPKα1-null H-RasV12 cells significantly induced p53 protein expression 24 hours after exposure to UV light, while the AMPKα2-null H-RasV12 cells displayed only a minimal induction in p53 protein expression after UV treatment performed at the same time. In addition to expressing increased basal levels of the p53 protein, the AMPKα1-null H-RasV12 cells expressed over 2-fold more p53 protein when compared to the WT H-RasV12 cells after exposure to UV light. Taken together, these data support clearly differential functions for the AMPKα isoforms relative to maintaining and/or induction of p53 levels, indicating that AMPKα2 likely contributes to maintaining p53 expression levels, whereas AMPKα1 does not.
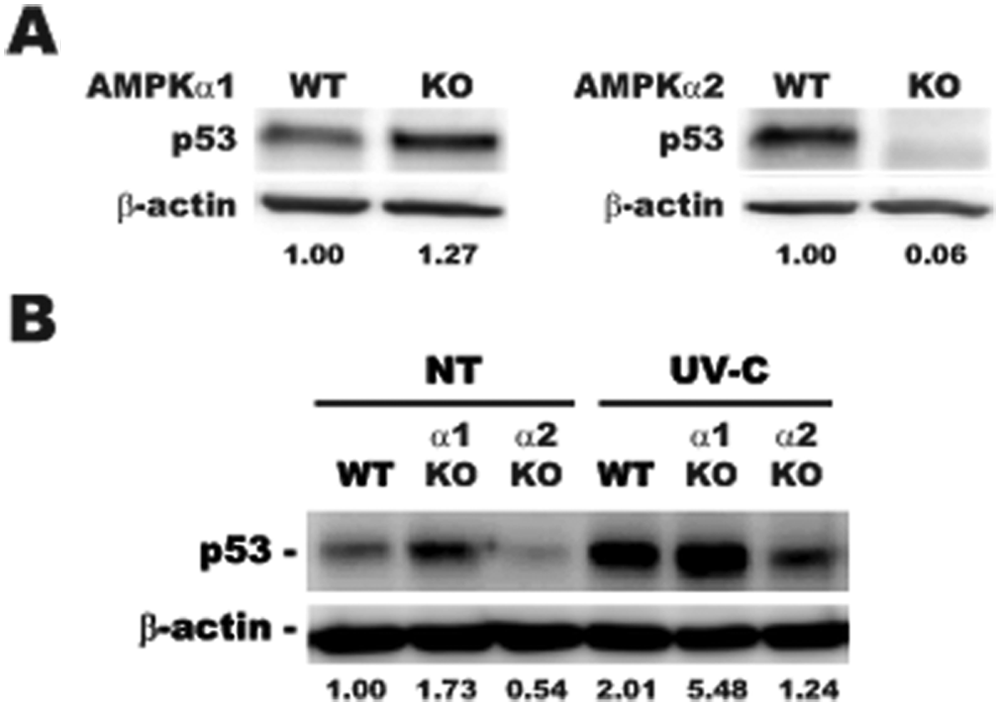
Effect of AMPKα1 and AMPKα2 knockout on basal and UV-induced p53 protein expression. Cell lysates from H-RasV12–transfected MEFs were evaluated by immunoblot for p53 protein expression under basal and UV-C–treated conditions. (
Discussion
Malignant transformation of normal cells into cancer cells is generally considered a multistep process that is characterized by a number of cellular and genetic changes. One of the hallmarks of transformation is that more than one genetic alteration is often required to turn a normal cell into a malignant cell.35,36 Early experiments with Ras-induced transformation models clearly demonstrated that Ras activation alone was not sufficient to transform normal primary cells.37-39 In fact, expression of mutant Ras in primary cells results in an oncogene-induced cellular senescence phenotype thought to be mediated through p53 and p16 accumulation. 40 Additional cellular changes are required for cells to evade oncogene-induced cellular senescence and promote early tumorigenesis and tumor progression. Previous reports have identified AMPK as a potential metabolic tumor suppressor that regulates numerous cellular functions under nutrient stress conditions and prevents tumorigenesis and/or tumor expansion.13,14,23,41,42 Loss of AMPK protein or activity in tumor cells would allow for uncontrolled growth under physiological stresses, such as nutrient or oxygen deprivation, which are often associated with tumor microenvironments and may support a permissive environment for secondary transformation events. The goal of this study was to evaluate the potential contribution of the 2 distinct AMPKα isoforms to cellular transformation and whether the AMPKα isoforms have specific signaling pathways. This study utilized forced expression of the active H-RasV12 mutant to evaluate the susceptibility of AMPKα1-null and AMPKα2-null MEFs to transformation and tumorigenesis.
In order to assess the individual contribution of the AMPKα isoforms towards susceptibility to transformation with active Ras (H-RasV12), AMPKα1-null and AMPKα2-null MEFs were used as a genetic model of isoform deletion, where matched littermate WT MEFs were used as controls. AMPKα1 was found to be the dominant isoform expressed in WT MEFs and was expressed at approximately a 4:1 ratio compared to AMPKα2 at the mRNA level. Interestingly, the AMPKα1-null MEFs were found to exhibit a significant compensation mechanism through increased expression of AMPKα2, an observation that requires additional investigation to delineate the mechanism and sensing pathways promoting such compensation. AMPKα1- or AMPKα2-null MEFs transfected with the H-RasV12 retroviral vector or control GFP-expressing vector demonstrated no significant changes in AMPKα isoform expression compared to primary MEFs, indicating that Ras activation did not affect AMPK isoform levels independent of the deletion or compensation mechanisms observed in the nontransduced primary MEFs. These cells were then used to evaluate the contribution of each of the AMPKα isoforms to H-RasV12 transformation.
There were no significant differences observed between WT or AMPKα1-null H-RasV12–transformed cells with respect to in vitro cell growth despite transduced AMPKα1-null cells demonstrating increased signaling through MAPK. Interestingly, it appears that the expected increase in growth due to stronger MAPK signaling was diminished by the activation of apoptosis, as evidenced by caspase-3 cleavage. In effect, AMPKα1-null cells, which display AMPKα2 compensation, were highly effective at promoting the apoptotic pathway, even in nonstressed culture conditions.
Contrary to results obtained for the AMPKα1 isoform, transformation of AMPKα2-null MEFs with H-RasV12 resulted in a significant growth advantage in vitro compared to WT H-RasV12 littermates. Interestingly, AMPKα2-null GFP control cells also displayed a growth advantage over WT GFP cells in vitro, which was apparently driven by increased MAPK activation. The increased MAPK signaling observed in AMPKα1-null and AMPKα2-null cells was expected since other investigations have pinpointed that AMPK likely modulates MAPK pathways through the targeting of C-Raf directly or indirectly through KSR2, which would be reduced by loss of AMPKα1 or AMPKα2.43,44
Finally, only the AMPKα2-null H-RasV12–transformed cells demonstrated a significant anchorage-independent growth advantage that would be predictive of their tumorigenic potential in vivo. The AMPKα2-null H-RasV12 cells were able to efficiently develop tumors in 100% of the mice inoculated and produced highly dense fibrotic tumors. The phenotype of the tumors suggested that the AMPKα2-null transformed cells have increased proliferation and low levels of apoptosis, all of which appeared to significantly contribute to their tumorigenicity and survival in vivo. It has been shown previously that AMPKα-null MEFs, lacking both AMPKα1 and AMPKα2, completely inhibit the development of tumors in H-RasV12–transformed xenografts. 45 This observation was similar to the AMPKα1-null H-RasV12 MEFs in this study, suggesting that if all AMPK activity or the predominant AMPKα1 activity is eliminated, then cells are driven into proliferation with an apparent oncogene-induced apoptosis. Conversely, it is possible that the compensatory increase in expression of AMPKα2 could also be driving these cells into apoptosis and preventing cellular transformation altogether. Taken together, the data demonstrate that loss of AMPKα1 or AMPKα2 promotes cell growth via increases in MAPK pathway signaling but that only the loss of AMPKα2 is permissive for normal MEFs to obtain an overall growth and survival advantage with Ras transformation alone. These data also suggest, for the first time, that the presence of AMPKα2 in normal cells, even in minority amounts relative to AMPKα1, may function to either prevent the transformation of cells into the malignant state or significantly contribute to the resistance of normal cells to transformational events.
AMPK has been implicated in a number of pathways that are important in cancer. Specifically, AMPK has been shown to regulate known tumor suppressors, such as tuberous sclerosis complex protein 2 (TSC2) and p53 (TP53), as well as fatty acid synthase (FASN), a metabolic oncogene.32,46 It has been well documented that AMPK can target p5331-33; however, the data in this study specifically suggest that the AMPKα isoforms have opposite effects on p53 regulation. Immunoblot analysis revealed that AMPKα2-null H-RasV12 MEFs displayed a significant repression of p53 protein levels compared to WT H-RasV12 MEFs and, conversely, AMPKα1-null H-RasV12–transformed MEFs demonstrated increased amounts of the p53 protein both under basal conditions and after exposure to UV light, a p53-inducing treatment. Thus, in effect, AMPKα1 suppresses p53 and AMPKα2 promotes p53 levels likely via transcription and/or protein stability, both mechanisms requiring additional investigation. Consistent with the in vitro data, immunohistochemistry on tumor samples confirmed that p53 levels were repressed in AMPKa2-null H-RasV12 tumors when compared to WT H-RasV12. Similarly and concordant with immunoblot data that demonstrated increased p53 levels in the AMPKa1-null H-RasV12 cell, the few tumor cells that were observed the AMPKa1-null H-RasV12 residual lesions were positive for p53 staining (data not shown). Importantly, these findings are consistent with data from Okoshi et al., which showed that AMPKα2, but not AMPKα1, was found in a complex with p53 using immuno-pulldown assays. 33 Additionally, increased p53 levels were also observed in immortalized AMPKα1-null MEFs by Wang et al., which also resulted in increased levels of apoptosis. 34
Cells transformed with Ras alone are known to enter a cellular senescence phenotype via p53 and Rb pathways.40,47 In order to transition into malignant transformation, a cell must find a way to evade this oncogene-induced senescence. 48 This study demonstrates that cells lacking AMPKα2 are able to evade this senescence pathway and become highly tumorigenic by bypassing p53 function. These data suggest that antitransformation mechanisms in normal cells would benefit from the presence of AMPKα2 expression and that AMPKα2 suppression may be permissive for early cancer transformation and/or progression. In fact, re-expression of AMPKα2 in the H-RasV12 AMPKα2-null cells did not result in any reversion in the transformed phenotype (data not shown), supporting the likelihood that selective pressure for loss of p53 function occurs early in the transformation process. In fact, one study has shown that AMPKα2 mRNA was down-regulated in a set of primary breast and ovarian cancer microarrays. 49 Additionally, transcriptome analysis of Asian gastric cancer demonstrated that AMPKα2 mRNA is suppressed in early-stage disease compared to normal tissue and advanced-stage disease. 50 The mechanism of the down-regulation of AMPKα2 in primary and early-stage cancers is unknown, and further investigation is warranted. Overall, this study highlights the importance of AMPKα isoform–specific activities, and additional studies are necessary to completely elucidate the complex contributions of the AMPK pathway to normal cellular homeostasis and its role in suppressing cancer initiation and progression.
Materials and Methods
MEF isolation and maintenance
Primary WT C57Bl/6 and AMPKα1- and AMPKα2-null MEFs were isolated from embryonic 14- to 16-day-old mouse embryos. Embryos were harvested from heterozygous × heterozygous breedings, and WT litter-matched controls were isolated for each genotype at the same time and used as matched controls. Heads and internal organs were removed and the remaining tissue finely minced. Minced tissue was washed and then digested with 0.1% collagenase A (Roche, Indianapolis, IN) and 10 µg/mL DNase I (Invitrogen, Grand Island, NY). After washing and red blood cell lysis, the final single-cell suspension was washed and plated in complete DMEM (Invitrogen) with 10% fetal bovine serum (FBS) (Atlanta Biologicals, Lawrenceville, GA) and penicillin/streptomycin (Invitrogen). Primary MEFs were used up until passage 6, and transfected MEFs were used between 3 and 12 passages after transfection. UV treatments were performed in a Stratalinker UV Crosslinker (Stratagene, La Jolla, CA). Cells were washed with PBS twice, PBS removed, and exposed to 60 J/m2 UV-C. After treatment, cells were fed with complete media and harvested 24 hours after exposure to UV.
Cell transformation
Litter-matched WT and null MEFs were transformed using MSCV–FLAG–H-RasV12 or MIGR-1 GFP control viral particles. Particles at an multiplicity of infection (MOI) of 1 were added to complete DMEM with 4 ug/mL polybrene and incubated with cells for 6 hours. Cells were selected for resistance to puromycin for 10 days. Immunoblots for GFP and Ras-Flag were used to confirm equal expression across cell types. Three individual rounds of transformation were performed on separately isolated MEFs. MSCV–FLAG–H-RasV12 and MIGR-1 GFP plasmids were generously provided by Dr. Bruce Mayer (University of Connecticut Health Center), and the retroviral particles were produced in collaboration with the University of Connecticut Health Center Viral Vector Core.
Cell growth and soft agar assays
Cell growth was determined as previously described using MTT assay (Sigma, St. Louis, MO) according to the manufacturer’s protocol. 51 In anchorage-independent growth assays, MEFs were seeded at a density of 1 × 10⁴ cells per well in triplicate in 35-mm dishes (0.6% and 0.3%, bottom and top agar, respectively). The cells were fed fresh media (DMEM with 10% FBS and penicillin/streptomycin) every 3 days until foci were imaged and counted 21 days later. Colonies that were larger than 50 µm were counted as positive.
SDS-PAGE and immunoblots
Whole cell extracts were obtained using RIPA lysis buffer (1× PBS, 1% NP40, 0.1% SDS, 1.0% deoxycholate) as described previously. 51 Blots were developed using ECL reagents (Millipore, Billerica, MA) on a Kodak Multimodel Imager (2000MM) (Kodak/Carestream Health Inc., Rochester, NY). Protein expression was quantified with ImageJ software (http://rsbweb.nih.gov/ij) (NIH, Bethesda, MD). Immunoblots were evaluated with antibodies against phosphorylated AMPK (Thr172), total AMPKα, phosphorylated MAPK1/2 (Thr202/Tyr204), total MAPK1/2, cleaved caspase-3 (Asp175) and GFP from Cell Signaling Technologies (Danvers, MA), AMPKα1 and AMPKα2 from US Biologicals (Swampscott, MA), phosphorylated C-Raf (S388) from Novus Biologicals (Littleton, CO), C-Raf from BD Biosciences (San Jose, CA), p53 from Leica Microsystems (Buffalo Grove, IL), Flag from Sigma, and β-actin from Abcam (Cambridge, MA).
RNA isolation and qRT-PCR
Total cell RNA was isolated using the RNeasy Kit (Qiagen, Valencia, CA) according to the manufacturer’s protocol. One microgram of RNA was used to produce cDNA using the iScript cDNA Synthesis Kit (Bio-Rad Laboratories, Hercules, CA). Quantitative PCR primers were designed using ABI Primer Express software (Applied Biosystems, Life Technologies, Carlsbad, CA) for use with the iQ Syber Green Supermix and the MyIQ qPCR system (Bio-Rad Laboratories). The following primers were used for quantitative PCR: AMPKα1 forward (5′-AAGCTGTTCAGGCACCCTCACA-3′), AMPKα1 reverse (5′-CGGCTTTCCTTTTCGTCCAACCTTC-3′), AMPKα2 forward (5′-CGCCACTCTGCTGATGCA-3′), AMPKα2 reverse (5′-AAATAGGTAGCTGGGCAAATC CT-3′), 18S forward (5′-aactttcgatggtagtcgccg-3′), and 18S reverse (5′-ccttggatgtggtagccgttt-3′).
In vivo tumor growth
Transformed MEFs (2 × 10⁶) were injected subcutaneously into the flank of athymic nude mice (n = 10/group) and tumor growth determined by external caliper measurements of each tumor for 4 weeks. The estimated volume for each tumor was calculated as width2 × length × 0.52 to approximate ellipsoid volume. Two individual rounds of tumor growth were completed with similar results. All animal experiments were approved by the University of Connecticut Health Center’s Institutional Animal Care and Use Committee.
Immunohistochemistry
Paraffin sections were used for immunohistochemical analyses with H&E stain and with antibodies to a proliferation marker, Ki67 (Dako North America Inc., Carpinteria, CA), apoptosis marker with cleaved caspase-3 (Cell Signaling Technologies), and p53 (Leica Microsystems). Secondary detection was performed with appropriate biotinylated secondary antibodies and VectaStain Elite kit (Vector Inc., Burlingame, CA) with diaminobenzidine substrate. Counterstain was performed with 1% methyl green. Negative control slides were obtained by omitting the primary antibody. The images were quantified by positive stain density using image analysis and recognition software Image Pro Plus (Media Cybernetics, Silver Spring, MD) and averaged for 5 high-power fields/section/animal for 5 animals/group for each group.
Statistical analysis
Data from individual experiments were represented as mean ± standard error unless otherwise stated. Statistical comparison of groups was performed using a 2-tailed Student t test or ANOVA test with appropriate tests for equal variances. Statistical significance was defined and indicated as P ≤ 0.05 (*) or P ≤ 0.01 (**).
Footnotes
Acknowledgements
The authors thank Roderick Franczak for technical assistance.
Declaration of Conflicting Interests
The authors declared no potential conflicts of interest with respect to the research, authorship, and/or publication of this article.
Funding
The authors disclosed receipt of the following financial support for the research, authorship, and/or publication of this article: This work was supported by NIH/NCI R01 CA064436 (KPC).