
Abstract
Activating mutants of Shp2 protein tyrosine phosphatase, encoded by the PTPN11 gene, are linked to leukemia. In solid tumors, however, PTPN11 mutations occur at low frequencies, while the wild-type Shp2 is activated by protein tyrosine kinases (PTKs) in cancer cells and mediates PTK signaling. Therefore, it is important to address whether the wild-type Shp2 plays a functional role critical for tumor growth. Using shRNAs and a PTP-inactive mutant to inhibit Shp2, we find here that tumor growth of DU145 prostate cancer and H292 lung cancer cells depends on Shp2. Suppression of Shp2 inhibited cell proliferation, decreased c-Myc, and increased p27 expression in cell cultures. In H292 tumor tissues, c-Myc–positive cells coincided with Ki67-positive cells, and smaller tumors from Shp2 knockdown cells had less c-Myc–positive cells and more nuclear p27. Shp2-regulated c-Myc expression was mediated by Src and Erk1/2. Down-regulation of c-Myc reduced cell proliferation, while up-regulation of c-Myc in Shp2 knockdown H292 cells partially rescued the inhibitory effect of Shp2 suppression on cell proliferation. Tyrosine phosphoproteomic analysis of H292 tumor tissues showed that Shp2 could both up-regulate and down-regulate tyrosine phosphorylation on cellular proteins. Among other changes, Shp2 inhibition increased phosphorylation of Src Tyr-530 and Cdk1 Thr-14/Tyr-15 and decreased phosphorylation of Erk1- and Erk2-activating sites in the tumors. Significantly, we found that Shp2 positively regulated Gab1 Tyr-627/Tyr-659 phosphorylation. This finding reveals that Shp2 can autoregulate its own activating signal. Shp2 Tyr-62/Tyr-63 phosphorylation was observed in tumor tissues, indicating that Shp2 is activated in the tumors.
Introduction
Protein tyrosine phosphorylation is an important signaling mechanism critical to tumorigenesis. Protein tyrosine phosphorylation is controlled by protein tyrosine kinases (PTKs) and protein tyrosine phosphatases (PTPs). 1 While many studies over the last 3 decades have provided a myriad of information on the roles of PTKs in the development of human cancer, 2 less is known about the contribution of PTPs to cancer pathogenesis. 3 In addition to suppressing PTK action, increasing evidence suggests that PTPs may cooperate with PTKs to propagate the activation signal or prolong the duration of the activation signal. 4 This is because tyrosine phosphorylation on certain residues may exert an inhibitory effect or induce feedback inhibition. For instance, Src Tyr(Y)-530 and Cdk1 Y15 phosphorylation inhibits the Src and Cdk1 kinase activity, respectively. The E3 ubiquitin ligase c-Cbl and p120RasGAP are recruited to specific tyrosine-phosphorylated sites to terminate PTK signaling. Suppression of phosphorylation of Src Y530, Cdk1 Y15, or the docking sites of c-Cbl and p120RasGAP by PTPs, therefore, would have positive effects on cell signaling and proliferation.
Consistent with this notion, the dual specificity PTP Cdc25 that dephosphorylates Cdk1 Thr(T)-14/Y15 is frequently overexpressed in human cancer. 5 Heterozygous Cdc25A knockout substantially delays MMTV-neu–evoked mammary tumors in transgenic mice. 6 PTP1B is best known for its negative role in insulin signaling. Nevertheless, in transgenic mouse models of mammary tumor, PTP1B deficiency significantly delays the onset of Neu-induced mammary tumor and inhibits lung metastasis. 7,8 These examples illustrate that certain PTPs could promote tumorigenesis in cooperation with PTKs rather than simply serve as suppressors of PTK function as previously perceived. 9
Shp2 is a nonreceptor PTP encoded by the PTPN11 gene. 10 It contains 2 SH2 domains, a PTP domain, and a C-terminal region. The N-SH2 domain in the wild-type Shp2 interacts with the PTP domain, resulting in autoinhibition of the Shp2 PTP activity. 11 In response to growth factor stimulation, Shp2 binds to specific tyrosine-phosphorylated sites on docking proteins such as Gab1 and Gab2 via its SH2 domains. This induces a conformational change that results in Shp2 activation. 12 It has been reported that the activated Shp2 mediates growth factor–stimulated Src and Ras-Erk1/2 activation. 10,13 We showed previously that Shp2 mediates Src activation by dephosphorylating paxillin in epidermal growth factor (EGF)–stimulated MDA-MB-468 cells, while others have reported that Shp2 mediates Src activation by dephosphorylating another Csk-docking protein CBP/PAG to regulate Src Tyr-530 phosphorylation. 13,14 The mechanisms by which Shp2 mediates Ras-Erk1/2 activation are not entirely clear, but several mechanisms are possible, including regulation of Src 13,15 and p120RasGAP. 16 Importantly, little is known about Shp2-regulated molecules downstream of Erk1/2 and Src that mediate cell proliferation.
Shp2 mutations that disrupt the autoinhibition have been identified in various types of human cancer. These include 35% of juvenile myelomonocytic leukemia (JMML), 5% to 10% of childhood myelodysplastic syndrome, 7% of B-cell precursor acute lymphoblastic leukemia, and some cases of pediatric and adult acute myelogenous leukemia and solid tumors. 17 Several laboratory studies have established leukemia-associated PTPN11 mutants as leukemic oncogenes. 18 While the oncogenic function of mutant Shp2 has been established in hematological malignancies, the role of Shp2 in solid tumors requires further study. Although PTPN11 mutations have been reported in solid tumors such as lung and colon cancer 19 because these mutations do not occur in most tumors, a broader issue that needs to be addressed is whether the wild-type Shp2 plays a significant role in tumorigenesis.
Since Src and Ras-Erk1/2 are involved in tumorigenesis and Shp2 controls Src and Ras-Erk1/2 activation, we postulated that Shp2 is required for tumor growth. This hypothesis was evaluated in this study. Because the Ras-Erk1/2 pathway is a major Shp2-regulated signaling pathway, DU145 prostate cancer and H292 lung cancer cells that express the wild-type Ras were chosen for this study. Our data show that tumor growth of these cancer cells depends on Shp2. Shp2-regulated cell proliferation in cell culture and in tumor xenografts correlates with c-Myc expression. Tyrosine phosphoproteomic analysis of H292 tumor xenograft tissues suggests that Shp2 is active in the tumor tissues, cooperates with PTKs to positively regulate certain tyrosine phosphorylation sites, and regulates Src, Erk1/2, and several previously unrecognized proteins in the tumors.
Results
Inhibition of Shp2 prevents tumor growth of DU145 prostate cancer cells
We prepared a retroviral Shp2 shRNA and obtained 2 stable DU145 cell lines (KD6 and KD16) in which Shp2 had been effectively silenced by the shRNA (Fig. 1A). Knockdown of Shp2 in these cells impaired EGF-stimulated Erk1 and Erk2 (Erk1/2) activation. Both Shp2 knockdown cells had an approximately 50% to 54% reduced growth rate in cell culture (Fig. 1B). To determine if Shp2 knockdown affects tumor growth, the parental DU145 cells, DU145/V cells, and the pool of KD6/KD16 cells were mixed with Matrigel and implanted subcutaneously (s.c.) into both flanks of each group of 8 athymic nude mice. Six of the 8 mice inoculated with the parental DU145 cells developed a total of 9 tumors of various sizes at the end point (6 weeks) (Fig. 1C). Similarly, DU145/V control cells formed 9 tumors in 6 mice. No statistical difference was observed between the parental DU145 cells and DU145/V cells in the average tumor volume (P = 0.37). In contrast, KD6/DK16 cells failed to develop any tumor in 8 mice among the total of 16 inoculates by 6 weeks (Fig. 1C and Suppl. Fig. S1A). These data suggest that Shp2 is critically involved in the regulation of tumor growth.
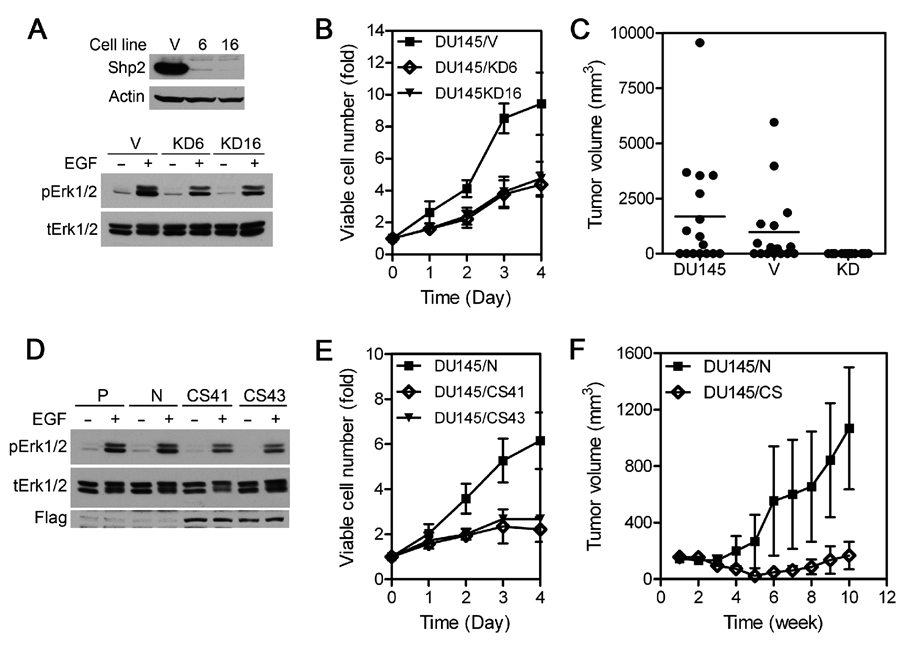
Shp2 is involved in tumorigenesis of DU145 cells. (
To verify that Shp2 is involved in DU145 tumor growth and to determine if the Shp2 PTP activity is required, we expressed a PTP-inactive Shp2 mutant (Shp2CS) that had the catalytic Cys-459 replaced with Ser in DU145 cells. Two cell lines (CS41 and CS43) expressing Shp2CS were obtained and characterized (Fig. 1D). Similar to KD6 and KD16 cells, CS41 and CS43 cells had reduced Erk1/2 activation and cell proliferation (Fig. 1D and 1E). In a tumor xenograft growth assay similar to that described above, control DU145/N cells formed a total of 7 tumors in 5 of 8 mice with 16 inoculates (Fig. 1F). The average tumor volume was 1068 ± 432 mm3 (mean ± SEM) at the end point (10 weeks). In contrast, the mixture of CS41 and CS43 cells (DU145/CS) formed only a total of 5 small tumors in 3 of 8 mice by week 10. The average tumor volume was 167 ± 97 mm3. Thus, expression of the PTP-inactive Shp2CS mutant significantly (P = 0.0261) inhibited DU145 tumor growth. Since DU145/KD cells did not develop tumors and tumors developed from the control cells in the presence of Matrigel are highly variable and highly vascular, preventing the analysis of tumor tissues, we turned to the H292 tumor model in the subsequent experiments.
Shp2 knockdown with inducible shRNAs arrests G1 phase progression, modulates c-Myc and p27 levels, and inhibits tumor growth of H292 lung cancer cells
We found that H292 human lung cancer cells readily formed tumors without the need of Matrigel and tumors developed had more similar sizes within each experiment. These make the cell line more suitable for detailed study of the role of Shp2 in tumor growth. Using lentiviruses containing doxycycline (dox)–inducible Shp2 shRNAs, we established H292 cells containing dox-inducible Shp2 shRNAs R0946 and R1049 (Fig. 2A). Cells containing a nonsilencing shRNA (H292/NS; see Materials and Methods) were also generated as the additional control. Knockdown of Shp2 by dox-induced shRNAs in H292/R0946 and H292/R1049 cells reduced cell proliferation by 40% and 39%, respectively (Fig. 2B). Cell cycle analysis showed significantly increased G1 phase and reduced S phase fractions when Shp2 was knocked down in these cells (Fig. 2C). Induction of the NS shRNA with dox in the control H292/NS cells had no effect on cell proliferation and cell cycle phase distribution in parallel experiments. Biochemical analysis showed that Shp2 knockdown resulted in down-regulation of c-Myc and up-regulation of the Cdk inhibitor p27 (also called Kip or p27Kip, encoded by the CDKN1B gene) (Fig. 2A). In support of the role of c-Myc in Shp2-regulated cell proliferation, we found that Shp2 knockdown in HEK293 cells did not affect cell proliferation and c-Myc or p27 level (Suppl. Fig. S2A). Treatment of HEK293 cells with the c-Myc inhibitor 10074-G5 20-23 or knockdown of c-Myc with shRNA reduced cell proliferation (Suppl. Fig. S2D and S2E). On the other hand, proliferation of DU145 and HCC827 cells was inhibited by Shp2 knockdown, and c-Myc was down-regulated and p27 was up-regulated in these cells when Shp2 was knocked down (Suppl. Fig. S2B and S2C).
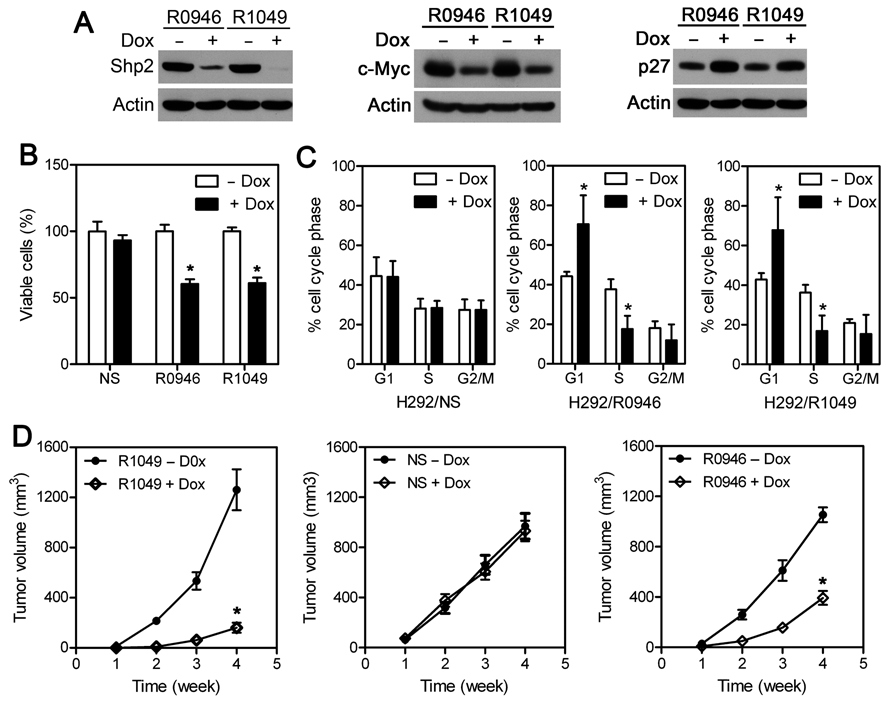
Inducible Shp2 knockdown in H292 cells reduces c-Myc expression, causes G1 arrest, and inhibits tumor growth. (
To determine if Shp2 is involved in H292 tumor growth, we tested tumor growth of H292/R1049, H292/NS, and H292/R0946 cells in nude mice receiving unmodified feed (regular diet) or dox-containing feed (dox diet). These cells grew into large tumors in mice fed with a regular diet (Fig. 2D). At the end point, the average tumor sizes were 1,261 ± 163, 968 ± 102, and 1,054 ± 59 mm3 for H292/R1049, H292/NS, and H292/R0946 cells, respectively. Significantly (P < 0.0001) smaller tumors grew from H292/R1049 and H292/R0946 cells in mice fed with the dox diet (Fig. 2D and Suppl. Fig. S1B and S1C), with average sizes of 160 ± 40 and 393 ± 55 mm3. Tumor development of H292/NS cells in mice fed with the dox diet (average tumor volume: 930 ± 81 mm3 at the end point) was similar to that in mice fed with a regular diet (Fig. 2D, middle panel), indicating that the dox diet as well as the shRNA construct did not nonspecifically affect tumor growth. Thus, knockdown of Shp2 with both specific shRNAs significantly inhibited H292 tumor growth.
Immunohistochemical (IHC) analysis showed that proliferative Ki67-positive cells were more numerous and widely distributed in tumors without Shp2 knockdown (Fig. 3A). In contrast, tumors from Shp2 knockdown cells had less Ki67-positive cells, and furthermore, the Ki67-positive cells were mainly located near stroma and blood vessels in these tumors (Fig. 3A). Interestingly, c-Myc–positive cells were colocalized with Ki67-positive cells in these tumors. Although c-Myc- and Ki67-positive cells were not identical in these slides because different tissue slides were stained for Ki67 and c-Myc, it is likely that c-Myc–positive cells will superimpose with Ki67-positive cells if the same tissue slide was stained with both c-Myc and Ki67. These data revealed the correlation between c-Myc and the proliferating cells in these tumor tissues. IHC analysis indicated that p27 was located mostly in the nuclei in these tumors. The difference in p27 staining intensity between tumors with and without Shp2 knockdown was not as visually apparent as that of Ki67 and c-Myc staining. Nevertheless, quantification of p27 intensity using the Image Scope program indicated that tumors initiated by Shp2 knockdown cells had a significantly higher number of intense (3+) nuclear staining cells as well as lower numbers of moderate (2+) and weaker (1+) nuclear staining cells when compared with tumors formed from cells with normal Shp2 expression (Fig. 3B).
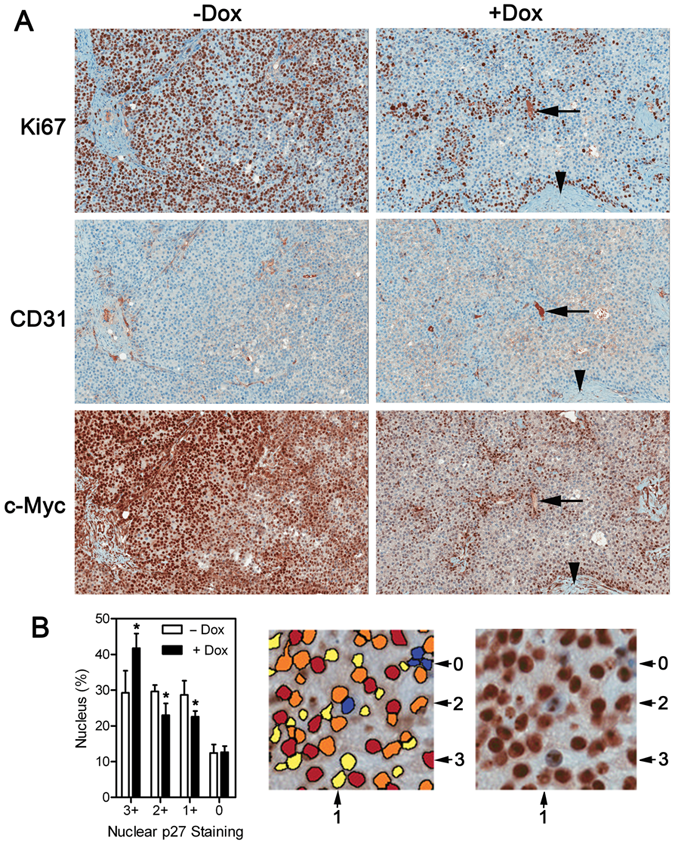
IHC analysis of Ki67, CD31, c-Myc, and p27 in H292 tumor xenograft tissues. (
Src and Erk1/2 are involved in the regulation of c-Myc by Shp2
Shp2 knockdown in H292/R0946 and H292/R1049 cells decreased the amounts of active Src and Erk1/2 (Fig. 4A). In contrast, Shp2 knockdown did not reduce pAkt. While GSK3α and GSK3β were expressed in H292 cells at a similar level, GSK3α pS21 was not detectable, whereas GSK3β pS9 was readily detectable. Shp2 knockdown affected neither GSK3α S21 and GSK3β S9 phosphorylation nor the β-catenin level. Thus, although Src, Erk1/2, Akt, and GSK3 might regulate c-Myc in the cells, only active Src and Erk1/2 were reduced by Shp2 inhibition in H292 cells. To determine if Src and/or Erk1/2 mediate regulation of c-Myc by Shp2, we analyzed effects of a Src tyrosine kinase inhibitor (dasatinib) and 2 Mek inhibitors (U0126 and PD0325901). Dasatinib, U0126, and PD0325901 caused concentration-dependent decreases of the c-Myc level and increases of the p27 level in H292 cells (Fig. 4B). These results indicate that Src and Erk1/2 activities are necessary to maintain c-Myc expression and suppress p27 expression in H292 cells.
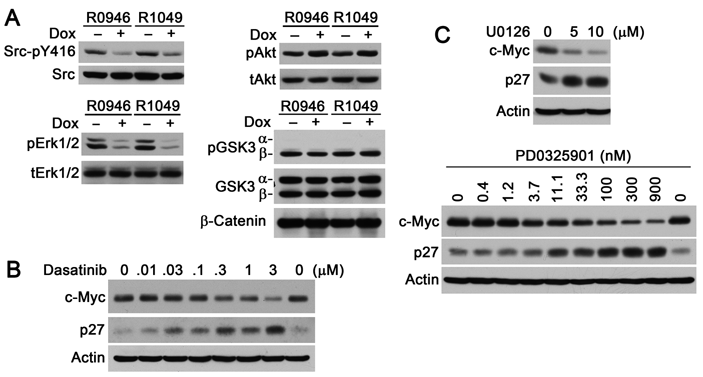
Shp2 knockdown reduces active Src and Erk1/2 that are involved in the regulation of c-Myc and p27. (
The c-Myc protein may be regulated at the level of transcription, protein stability, or both. We compared the c-Myc protein stability in H292/R0946 cells and observed no difference in c-Myc stability between Shp2 expressing and Shp2 knockdown cells (Suppl. Fig. S3A and S3B). The same result was obtained in H292/R1049 cells (data not shown). On the other hand, transcription activity of the c-Myc promoter was lost when Shp2 was knocked down in H292/R0949 and H292/R1049 cells (Suppl. Fig. S3C). These data indicate that Shp2 regulates c-Myc primarily by controlling c-Myc transcription.
To determine if the change in c-Myc level is causally related to cell proliferation, we reduced c-Myc level in H292 cells with a dox-inducible c-Myc shRNA. As shown in Figure 5A, inducible knockdown of c-Myc in 2 H292 cell lines reduced cell proliferation by 37.5% ± 6.0% and 48.8% ± 3.3%, respectively. Although Shp2 does not appear to affect GSK3 activity in H292 cells, GSK3 is expressed in these cells (Fig. 4). Inhibition of the GSK3 activity with the GSK3 inhibitor SB216763 elevated the c-Myc level in both H292/R0946 and H292/R1049 cells and partially rescued the Shp2 knockdown–induced growth inhibition (Fig. 5B and data not shown). These results suggest that c-Myc is involved in the regulation of H292 cell proliferation.
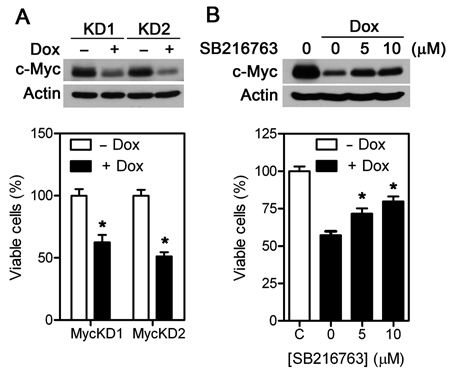
c-Myc expression correlates with H292 cell proliferation. (
Proteomic analysis of protein tyrosine phosphorylation sites in H292 tumors
To reveal tyrosine-phosphorylated proteins and to identify Shp2-regulated phosphotyrosine residues in H292 tumor xenograft tissues, we isolated phosphotyrosine-containing peptides from 4 samples of H292/R0946 tumors obtained from mice fed with and without the dox diet using the antiphosphotyrosine antibody (P-Tyr-100). The SIEVE program was used to perform global quantitative comparison of phosphotyrosine-containing peptides between tumor samples. Furthermore, selected phosphopeptides of interest were individually analyzed using extracted ion chromatograms (EIC) to evaluate changes not identified by the SIEVE program as well as to verify the changes identified by the SIEVE program.
Consistent with reduced cell proliferation, increased Cdk1 T14/Y15 phosphopeptide was detected in Shp2 knockdown tumors (Table 1 and Suppl. Table S1). Phosphopeptides from several proteins related to cell adhesion and cytoskeleton were also increased in Shp2 knockdown tumors. Among the decreased phosphopeptides in Shp2 knockdown tumors are those of Erk1 (T202/Y204), Erk2 (T185/Y187), p38δ (T180/Y182), Gab1 (Y627, Y659), and integrin β4 (Y1199/Y1207) (Table 2 and Suppl. Table S2). The decreases in Erk1- and Erk2-activating phosphorylation sites in the tumor samples when Shp2 was knocked down indicated that Shp2 not only regulates Erk1/2 activation in cell culture in vitro but is also critical for Erk1/2 activation in the tumors in vivo.
Proteins with the Most Increased Phosphotyrosine-Containing Peptides in Shp2 Knockdown Tumors
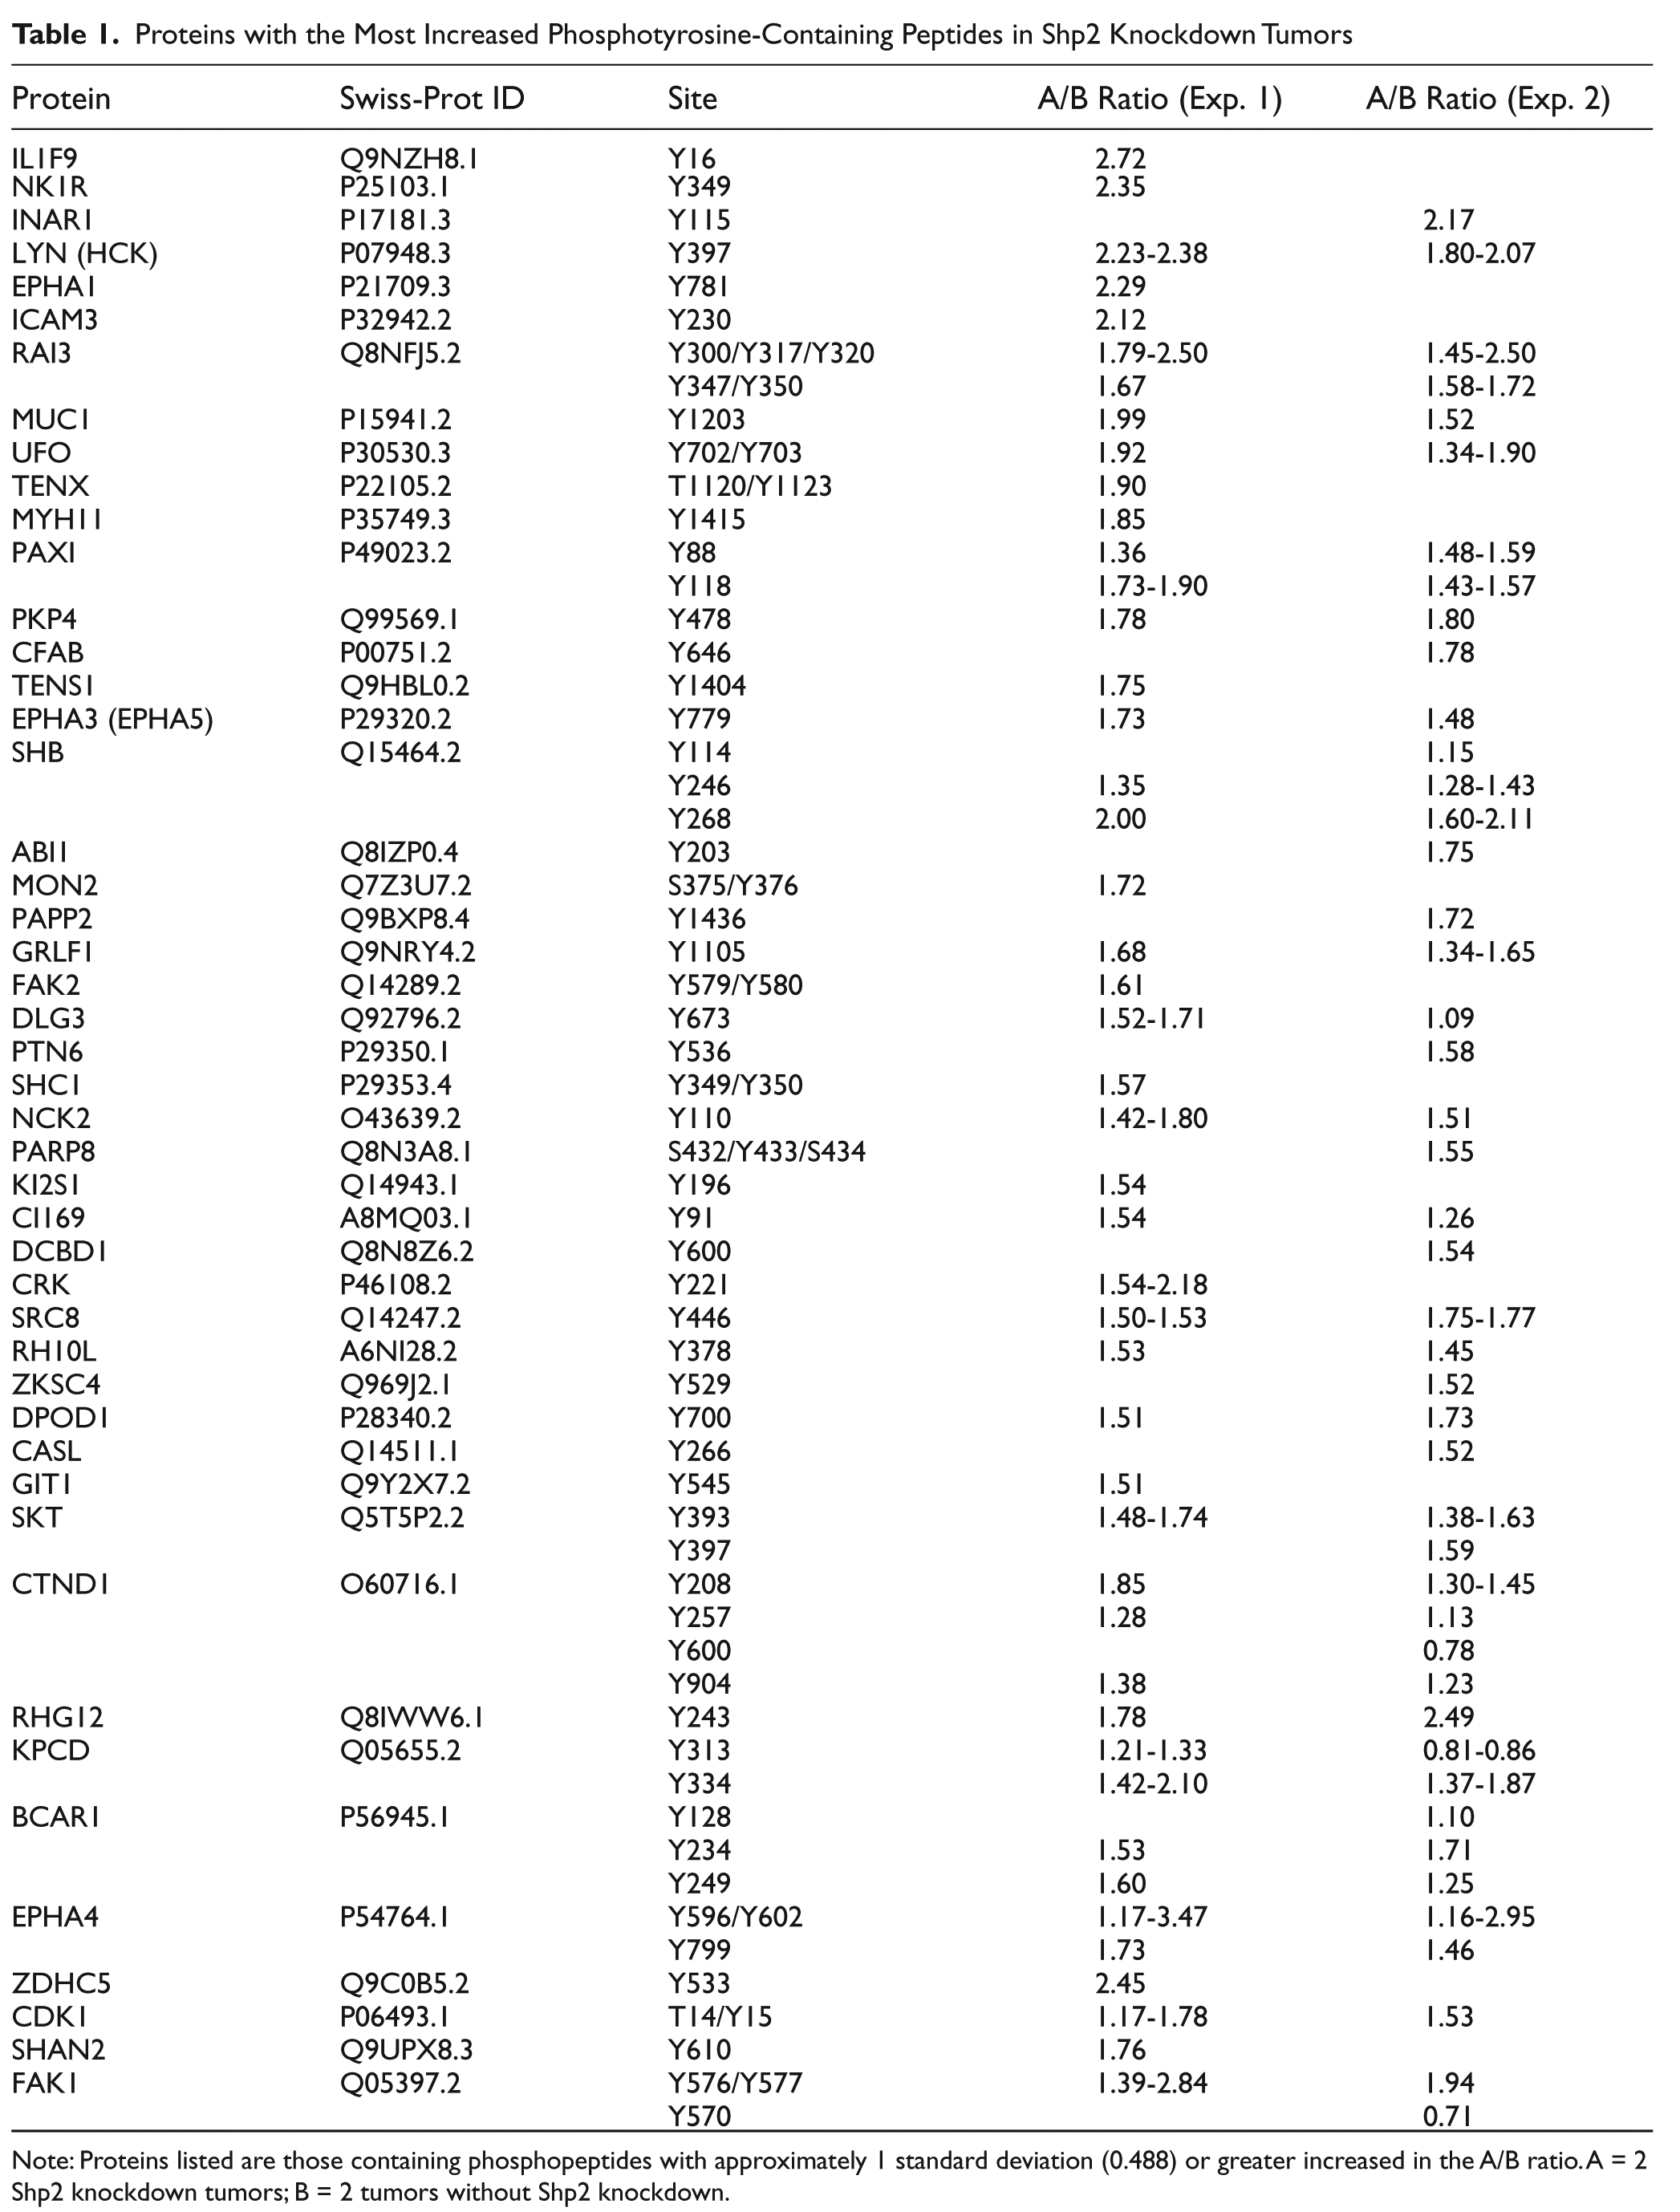
Note: Proteins listed are those containing phosphopeptides with approximately 1 standard deviation (0.488) or greater increased in the A/B ratio. A = 2 Shp2 knockdown tumors; B = 2 tumors without Shp2 knockdown.
Proteins with the Most Reduced Phosphotyrosine-Containing Peptides in Shp2 Knockdown Tumors
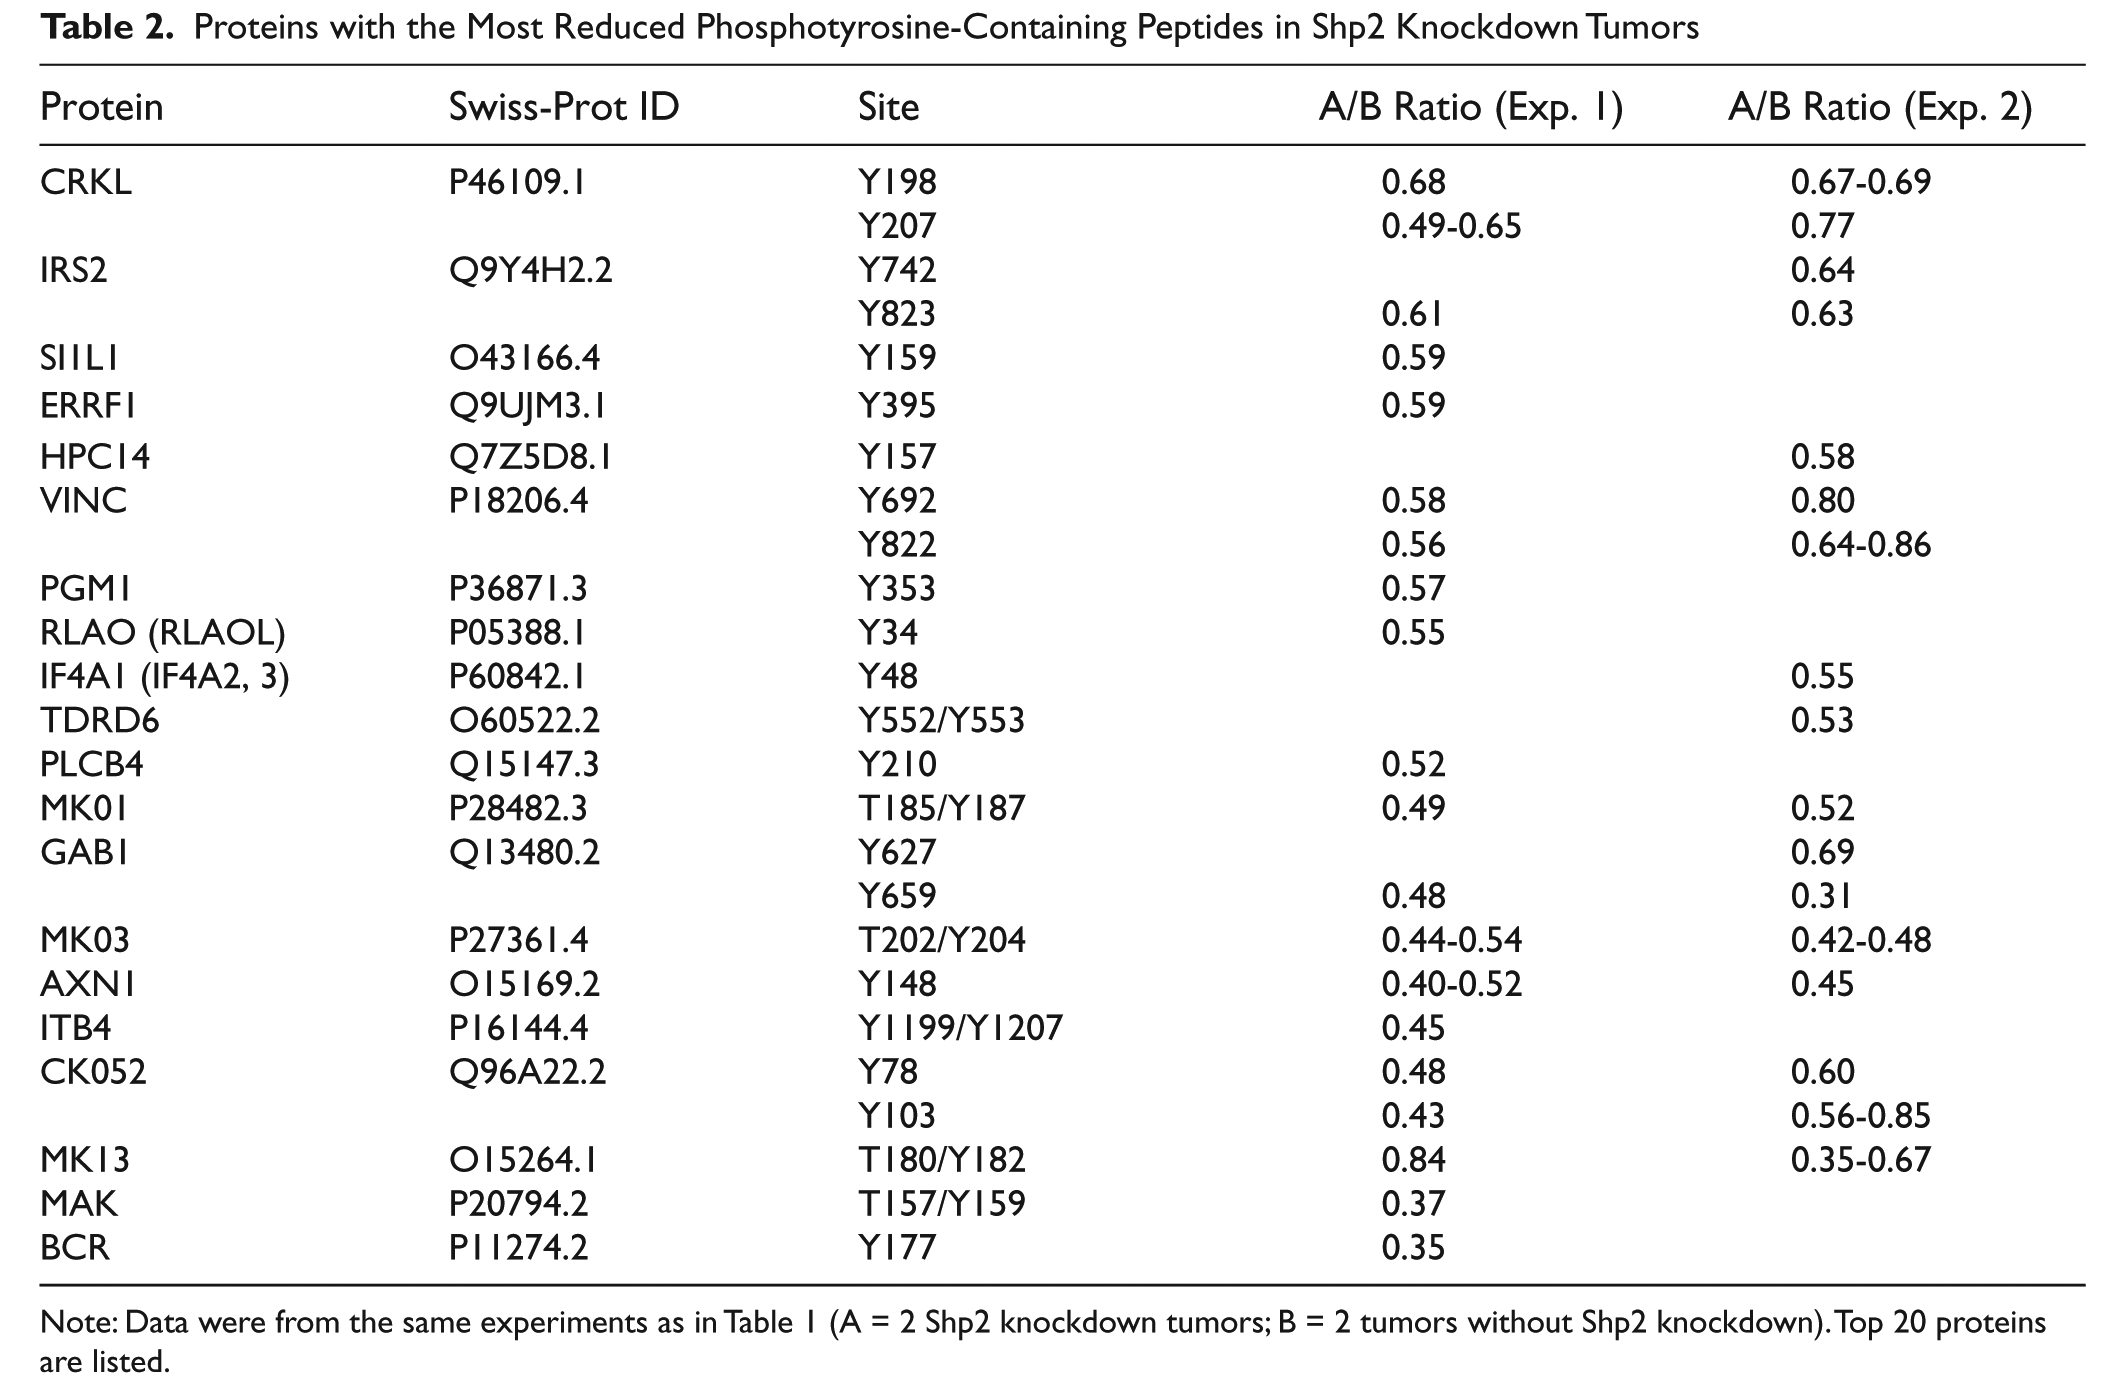
Note: Data were from the same experiments as in Table 1 (A = 2 Shp2 knockdown tumors; B = 2 tumors without Shp2 knockdown). Top 20 proteins are listed.
The phosphopeptide (LIEDNEYTAR) containing the Src-activating phosphotyrosine site Y416 was detected in tumor samples. However, because Src, Fyn, Yes, and Lck share the same tryptic peptide, we could not assign the phosphopeptide to a particular kinase. Because the mouse and human sequence are homologous, we also could not identify its cell of origin. On the other hand, the C-terminal peptide containing the negative regulatory residue Y530 is unique to Src. The Src phosphotyrosine (pY)–530 peptide was increased in Shp2 knockdown tumors (Fig. 6A), suggesting that Src is less active in Shp2 knockdown tumors.
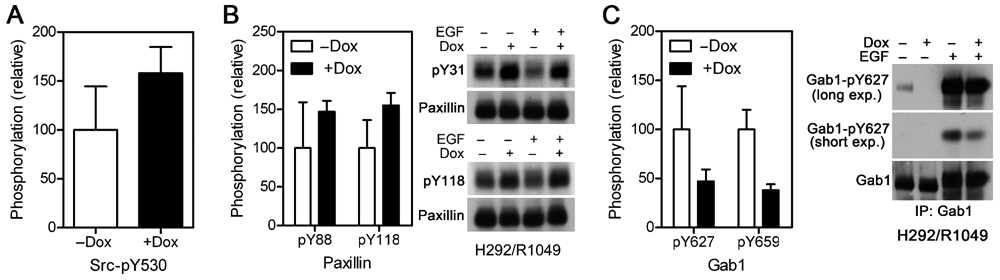
Shp2 regulates tyrosine phosphorylation of Src, paxillin, and Gab1. The abundance of peptides containing phosphorylated human Src Y530, paxillin Y88, paxillin Y118, Gab1 Y627, and Gab1 Y659 from H292/R0946 tumor tissues were analyzed quantitatively using ion chromatograms extracted from LC-MS/MS data (graphs in
We reported previously that paxillin is a Shp2 substrate in EGF-stimulated breast cancer cells in cell culture. 13 Increased phosphopeptides containing paxillin Y88 and Y118 were detected in Shp2 knockdown tumors (Fig. 6B). While Y31 is a known tyrosine phosphorylation site on paxillin, the Y31 phosphopeptide was not detected by the proteomic analysis because the 66-residue tryptic peptide is outside the range of the liquid chromatography mass spectrometry analysis (best results are obtained for peptides below 4,500 Da). To test if paxillin Y31 is regulated by Shp2 in H292 cells and if Shp2 knockdown with the Shp2 shRNA R1049 also increases paxillin tyrosine phosphorylation, H292/R1049 cells were cultured in medium with or without dox and analyzed for paxillin Y31 and Y118 phosphorylation with phosphospecific antibodies. As shown in Figure 6B, dox-induced Shp2 knockdown increased the basal levels of paxillin pY31 and pY118. EGF induced paxillin dephosphorylation, and this effect was blocked by Shp2 knockdown. These data confirm paxillin as a Shp2 substrate and show that Shp2 regulates paxillin tyrosine phosphorylation not only in cell cultures but also in tumors.
Docking of Shp2 to the bisphosphoryl tyrosine-based activation motif (BTAM) of Gab1 (Y627/Y659) is a mechanism of regulating Shp2 activation. 12 Unexpectedly, reduced Gab1 Y627/Y659 phosphorylation was observed in Shp2 knockdown tumors (Fig. 6C). To determine if the change occurred in H292 cells and if it is attributed to Shp2 knockdown, we examined Gab1 Y627 phosphorylation in H292/R1049 cells using a phosphospecific antibody to Gab1 pY627. As shown in Figure 6C, Shp2 knockdown reduced the basal and EGF-stimulated Gab1 pY627 level. These results show that Shp2 can regulate Gab1 BTAM phosphorylation.
Shp2 Y62 and Y63 phosphorylation was observed previously in H292 and other cancer cell lines in cell culture. 24,25 However, the role of Y62 and Y63 phosphorylation has not been investigated. Shp2 Y62 and Y63 phosphorylation was detected in our H292 tumor xenograft tissues (Fig. 7A and 7B). Since Y62 and Y63 are hidden in the N-SH2 and PTP domain interface in the unliganded Shp2 (Fig. 7C), Shp2 must adapt an open, active conformation in order for these 2 residues to be accessible for phosphorylation, suggesting that Shp2 was activated in the tumors. Furthermore, Y62 and Y63 phosphorylation may disrupt the N-SH2 domain–PTP domain interaction and thus help to stabilize the active conformation. To test this possibility, we compared the PTP activity of the wild-type Shp2, Shp2 Y62D mutant, and Shp2 Y62F mutant. As shown in Figure 7D, the phosphorylation-mimicking Y62D mutant was 2.4 times more active than the wild-type Shp2, while the nonphosphorylation-mimicking Y62F mutant was slightly less active than the wild-type Shp2.
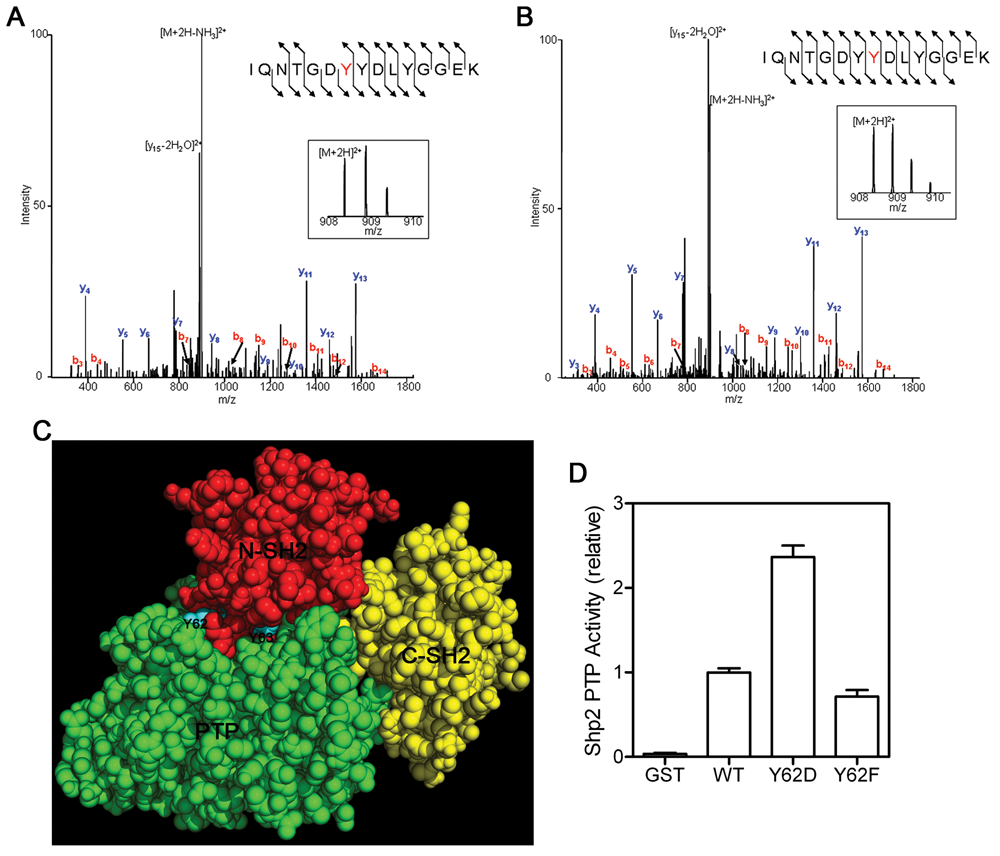
Shp2 Y62/Y63 phosphorylation in tumor samples and evidence that Shp2 Y62 phosphorylation correlates with an activated state of the PTP. (
Discussion
Previous studies in cell culture have shown that Shp2 positively regulates Ras-Erk1/2 and Src activation in growth factor–stimulated cells. However, whether Shp2 plays a significant role in the growth of solid tumors in vivo has not been tested. We found here that inhibition of Shp2 by shRNAs or a dominant-negative Shp2 mutant prevented tumor growth of DU145 and H292 cancer cells. These results show that tumor growth of these cancer cells depends on Shp2 and thus established an important function of Shp2 in tumorigenesis in vivo. Several Shp2 mutants have been identified in solid tumors. 19 Although all cancer-associated Shp2 mutants are predicted or have been demonstrated to be gain-of-function mutations, the frequencies of Shp2 mutations in solid tumors are low. 19 Our finding that the wild-type Shp2 is required for effective tumor growth reveals a broader role of Shp2 in tumorigenesis of solid tumors.
The c-Myc oncogene is frequently overexpressed in many types of cancer. 26-29 We found that Shp2 knockdown reduced c-Myc expression in DU145, H292, and HCC827 cells but not in the nontumorigenic HEK293 cells. The inhibitory effect of Shp2 knockdown on cell proliferation correlates with reduced c-Myc level. Significantly, Ki67-positive proliferating cells coincide with c-Myc–positive cells in an IHC analysis of H292 tumor tissues. c-Myc expression is regulated by multiple mechanisms. 30-32 Among several upstream c-Myc regulators that we have examined, only Src and Erk1/2 were inhibited by Shp2 knockdown. Furthermore, inhibition of Src or Erk1/2 by chemical inhibitors suppressed c-Myc expression. These results demonstrate that Shp2 can regulate c-Myc expression in certain tumor cells and that controlling c-Myc expression is an important mechanism by which Shp2 regulates cell proliferation and tumor growth of these cancer cells.
Both up-regulated and down-regulated tyrosine-phosphorylated sites in Shp2 knockdown tumor tissues were observed in our phosphotyrosine proteomic analysis. Given that Shp2 is a PTP, if the PTP only has a negative effect on tyrosine phosphorylation, only increases in the abundance of phosphotyrosine peptides would be detected when Shp2 is knocked down. Our observation of decreases in tyrosine phosphorylation in some proteins when Shp2 was inhibited lends another support to the notion that a PTP can cooperate with PTKs to positively regulate cell signaling via increased tyrosine phosphorylation.
Our observations that Shp2 regulates tyrosine phosphorylation of Src, paxillin, Erk1, Erk2, and integrin β4 in H292 tumor tissues expand the previous knowledge about Shp2-regulated phosphorylation sites in cell culture in vitro to tumor xenografts in vivo. 13,14,33 Moreover, besides Erk1 and Erk2, our data suggest that p38δ is another MAP kinase regulated by Shp2 in these tumors.
Binding to the Gab1 pY627/pY659 BTAM via the tandem SH2 domains activates the Shp2 PTP. As such, detection of Gab1 Y627 and Y659 phosphopeptides in the tumor samples is an indicator of Shp2 activation in the tumors. Surprisingly, reduced Y627/Y659 phosphorylation was observed in Shp2 knockdown tumors and in cell culture, suggesting that Shp2 could regulate its own activating signal. In a previous study, it was reported that Shp2 binding to integrin β4 in hepatocyte growth factor–stimulated cells activates Src, which then phosphorylates Gab1 predominantly on Grb2-binding sites. 33 Gab1 Y627/Y659 residues are readily phosphorylated by Src. In fact, a recombinant Gab1 fragment containing Y627 and Y659 was used for assaying Src tyrosine kinase activity in vitro. 13,34 Since Shp2 regulates Src activation in H292 cells, Shp2-regulated Src is likely to constitute at least one of the mechanisms by which Shp2 controls Gab1 Y627/Y659 phosphorylation.
We, and others, have reported previously that Gab1 is a Shp2 PTP substrate and inhibition of Shp2 led to increased Gab1 tyrosine phosphorylation. 12,35,36 These experiments differed from the current study in that PTP-inactive Shp2 mutants were used in these previous studies. The PTP-inactive Shp2 mutants are able to trap/protect its substrates, leading to accumulation of phosphorylated Gab1. In our current study of H292 tumor tissues and cells, the Shp2 protein was depleted, which allowed the dual roles of Shp2 on Gab1 phosphorylation to reveal. Nevertheless, we do not exclude the possibility that the difference in cell contexts may also contribute to the extent of the positive effect of Shp2 on Gab1 tyrosine phosphorylation.
An activated Shp2 mutant is functionless unless it binds to its docking proteins. 15,37 While human disease–associated Shp2 mutations in the N-SH2–PTP domain interface have elevated constitutive Shp2 activity, an unresolved issue is how these mutations result in increased Shp2 binding to its docking proteins necessary for its function. Our finding that Shp2 can autoregulate its activating BTAM on Gab1 provides a potential answer to this question. In support of this notion, a previous study found that Noonan syndrome–associated, activated Shp2 mutants had prolonged binding to Gab1. 38
Phosphorylation of Y62 or Y63 residues of the Shp2 N-SH2 domain was observed previously in cultured cancer cell lines in vitro. 24,25,39 We detected both Y62 and Y63 phosphopeptides in H292 tumor samples. In the crystal structure of the unliganded Shp2, Y62 and Y63 are buried in the N-SH2 domain and PTP domain interface and are not accessible to PTKs. One would envision that Y62 and Y63 phosphorylation occurs subsequent to a conformational change induced by binding of the SH2 domains to BTAMs. Thus, Y62 or Y63 phosphorylation may be used as a marker for Shp2 activation in the cells. Further, it is predicted that Y62 and Y63 phosphorylation would interfere with autoinhibition of Shp2 by the N-SH2 domain and thus help to stabilize the active conformation. This is supported by our data showing that the phosphorylation-mimicking Y62D mutant has elevated PTP activity. Therefore, we propose here a 2-step activation model of the wild-type Shp2. In the first step, Shp2 binds to specific BTAMs that induce Shp2 to adapt an open, active conformation. This is an essential step for Shp2 activation. In the second step, Shp2 may be further phosphorylated on Y62 or Y63 by yet to be identified PTKs. Y62 and/or Y63 phosphorylation helps to stabilize the active conformation, but it is not a necessary step.
Materials and Methods
Cells and reagents
Retroviruses containing tandem shRNAs targeting Shp2 coding sequences starting at nucleotide 499 (GTGACCCATGTTATGATTCGC) and nucleotide 866 (GGGTTGTCCTACACGATGGTG) in the pSM2c vector (Open Biosystems, Huntsville, AL) were prepared and used to infect DU145 cells. Puromycin-resistant DU145 cell colonies were selected and screened by immunoblotting analysis with an anti-Shp2 antibody (Santa Cruz Biotechnology, Santa Cruz, CA). Two cell clones KD6 and KD16 were identified and maintained in PRMI-1640/10% fetal bovine serum (FBS)/0.5 µg/mL puromycin. Control DU145 cells were prepared by selecting a pool of puromycin-resistant DU145 cells infected with the pSM2c virus.
DU145 cells containing a PTP-inactive Shp2 mutant (Shp2CS) were made by transfecting DU145 cells with a plasmid encoding a Flag-tagged Shp2CS. Transfected cells were selected by G418. Two stable cell lines CS41 and CS43 were established by screening cell lysates with an anti-Flag antibody (Sigma, St. Louis, MO). DU145/N cells were established as a pool of G418-resistant DU145 cells transfected with pcDNA3.1.
Dox-inducible TRIPZ lentiviral Shp2 shRNA clones V2THS_170946, V2THS_221049, V2THS_223469 (designated R0946, R1049, R3469), c-Myc shRNA clone V2THS_152051, and the nonsilencing (NS)–verified negative TRIPZ clone RHS4743 were obtained from Open Biosystems. Lentiviruses were prepared by transfecting 293T cells with 6 µg TRIPZ plasmid, 4 µg psPAX2, and 2 µg pMD2G using the Lipofectamine 2000 reagent (Invitrogen, Carlsbad, CA). Virus-containing supernatants were harvested 48 hours after transfection and used to infect H292, HEK293, or HCC827 cells. Infected cells were selected with 1 µg/mL puromycin. The appropriate concentrations of puromycin were established through pilot experiments. Individual puromycin-resistant cell lines were selected, expanded, and cultured in RPMI-1640/10% tet-free FBS with and without 1 µg/mL dox for 3 days. Cell lysates were analyzed by immunoblotting with antibodies to Shp2 or c-Myc to select for dox-inducible knockdown cell lines. Four independent cell lines containing the same dox-inducible Shp2 shRNA were pooled and used in the subsequent experiments. The H292/NS control cell lines are a pool of puromycin-resistant cells.
Dasatinib was from LC Laboratories (Woburn, MA). PD0325901 was from Selleck (Houston, TX). U0126 and SB216763 were from Enzo (Plymouth Meeting, PA). 10074-G5 was from Sigma.
Cell proliferation assay
Cells were plated onto clear-bottom, black 96-well plates in 100 µL medium. For dox or drug treatment, dox (1 µg/mL) or drugs were added 24 hours after cell plating. At the time indicated in the figure legends, 50 µL Celltiter-Glo reagent (Promega, Madison, WI) was added, and the luminescent signal was determined according to the supplier’s instruction.
For cell cycle analysis, cells cultured in 10-cm plates were harvested by trypsin digestion, washed, resuspended in 1 mL phosphate-buffered saline (PBS), and fixed with 10 mL 70% ethanol on ice for 1 hour. After being washed with PBS, fixed cells were stained in the dark for 30 minutes with 1 µg/mL DAPI in PBS containing 0.1% Triton X-100 and then analyzed by flow cytometry.
Immunoblotting and immunoprecipitation
Cells were lysed on ice for 30 minutes with lysis buffer A (50 mM Tris-HCl, pH 7.5, 150 mM NaCl, 1 mM EDTA, 1 mM EGTA, 25 mM NaF, 5 mM sodium pyrophosphate, 1 mM Na3VO4, 2 µg/mL aprotinin, 2 µg/mL leupeptin, 100 µg/mL phenylmethylsulfonyl fluoride, 1 mM dithiothreitol, 20 mM p-nitrophenyl phosphate, 1% Triton X-100). Cell lysates were centrifuged twice at 4°C for 15 minutes with a microfuge. Protein concentrations of cell lysate supernatants were measured. Cell lysate supernatants of equal-amount proteins were used for immunoblotting or immunoprecipitation analysis similar to that described previously. 13,40
Tumor xenograft growth
Experiments involving animals were approved by the Institutional Animal Care and Use Committee of the University of South Florida. DU145 cells were harvested by trypsin digestion and resuspended in PBS. For experiments involving DU145/KD6 and DU145/KD16 cells, an equal amount of DU145/KD6 and DU145/KD16 cells were pooled and designated DU145/KD. Similarly, DU145/CS41 and DU145/CS43 cells were pooled and designated DU145/CS in the tumor growth assay. The parental DU145, DU145/V, DU145/N, DU145/KD, and DU145/CS cells were mixed with an equal volume of Matrigel (BD Biosciences, San Jose, CA). Cell/Matrigel mixture (5 × 10⁶ cells in 200 µL) was inoculated subcutaneously (s.c.) into both flanks of male, 5-week-old NCr nu/nu mice (Charles River, Wilmington, MA). Each group has 8 mice containing 16 inoculates. Tumor size was measured weekly with a caliper. Tumor size was calculated using the following formula: 0.5 × length × width2.
H292 cells were cultured in medium with or without 1 µg/mL dox for 3 days. After being harvested by trypsin digestion, cells responded in Hank’s solution. The host Ncr nu/nu mice (5-week-old female, Taconic or Charles River) were fed with a regular diet (irradiated Teklad global rodent diet #2918, Harlan, Tampa, FL) or the dox diet (200 mg/kg doxycycline, Bio-Serv, Frenchtown, NJ) starting 3 days prior to cell injection. H292 cells were injected s.c. into both flanks of mice (5 × 10⁶ cells in 200 µL Hank’s solution/site). H292/R1049 and H292/R0946 tumor growth assays were performed in 2 experiments. The first experiment had 8 mice with 16 inoculates in each group, while the second experiment had 3 mice with 6 inoculates in each group. H292/NS tumor growth was assayed once that had 8 mice with 16 inoculates in each group. Tumor size was measured weekly with a caliper. At the end point, mice were euthanized by carbon dioxide inhalation. Tumors were excised post mortem from some mice and frozen in liquid nitrogen or fixed with 10% neutral buffered formalin.
Immunohistochemistry (IHC)
Tumor xenografts were excised from the hosts after euthanasia. A portion of tumors was fixed in neutral buffered formalin (EMD, Gibbstown, NJ), and paraffin-embedded tissue blocks were made. Formalin-fixed, paraffin-embedded (FFPE) tissue slides were stained with antibodies to Ki67 (NB110-57147, Novus Biologicals, Littleton, CO), CD31 (ab28364, Abcam, Cambridge, MA), c-Myc (ab32072, Abcam), and p27 (E2604, Spring Bioscience, Pleasanton, CA) using a Ventana Discovery XT automated slide staining instrument (Ventana, Tucson, AZ). The antigen retrieval method was Ventana Cell Conditioning-1. Specific IHC conditions were Ki67: 1:200 dilution (60 minutes), Ventana universal secondary antibody (8 minutes); CD31: 1:200 dilution (60 minutes), Ventana universal secondary antibody (8 minutes); c-Myc: 1:25 dilution (60 minutes), Ventana UltraMAP anti-rabbit (20 minutes); and p27: 1:100 dilution (60 minutes), Ventana OmmiMap anti-rabbit (20 minutes).
The slides were scanned at 20x magnification using the Aperio ScanScope XT digital slide scanner (Vista, CA). Analysis of p27 staining intensities was performed with the Aperio Image Scope program using the IHC nuclear image analysis algorithm. A nucleus is classified at 3+ when it has an intense nuclear staining, 2+ for a moderate nuclear stain, 1+ for weak nuclear stain, and 0 when there is no nuclear staining. The weak, moderate, and strong threshold parameters were adjusted specific to this application to specify the staining intensity that determines the individual nuclear classification.
PTP activity assay of recombinant Shp2 constructs
Shp2 Y62D and Y62F mutations were generated by PCR-based mutagenesis, verified by DNA sequencing, and subcloned into the pGEX2T vector. GST fusion proteins of the wild-type Shp2, 41 Shp2Y62D, and Shp2Y62F were expressed in E. coli BL21 (DE3) and affinity purified by glutathione agarose similar to that described previously. 41 PTP activity of recombinant Shp2 constructs was assayed using 6,8-difluoro-4-methylumbelliferyl phosphate (DiFMUP, Invitrogen) as the substrate. Reaction was carried out in quadruplicate at room temperature in black, half-area 96-well plates. Each reaction well contained 25 mM Hepes, pH 7.3, 50 mM NaCl, 1 mM dithiothreitol (DTT), 0.05% Triton-X100, 50 µM DiFMUP, and 200-ng purified recombinant protein in a total volume of 75 µL. Reaction was initiated by the addition of the enzyme. Fluorescent signal was measured at 20 minutes with a Wallac 1420 Victor2 Multilabel Plate Reader (Perkin Elmer, Waltham, MA) at excitation/emission wavelengths of 355 nm/460 nm.
Phosphoproteomic analysis
Approximately 300 mg each of frozen tumor tissues were smashed with a Bio-Pulverzier (Research Products International, Mount Prospect, IL) and then homogenized with a polytron in 5 mL lysis buffer B (20 mM Hepes, pH 8.0, 9 M urea, 1 mM sodium orthovanadate, 2.5 mM sodium pyrophosphate, 1 mM β-glycerophosphate). The homogenates were sonicated and centrifuged twice at 10,000g for 30 minutes at 4°C. The supernatants were processed for isolation of phosphotyrosine-containing peptides using the PhosphoScan kit (P-Tyr-100) reagents (Cell Signaling, Danvers, MA) according to the supplier’s instructions. Briefly, the extracted proteins were reduced by dithiothreitol, alkylated by iodoacetamide, and then digested by trypsin. The tryptic peptides were acidified and desalted using Sep-Pak C18 columns. The phosphotyrosine-containing peptides were purified using antiphosphotyrosine antibody beads (P-Tyr-100). Following immunoprecipitation, peptides were eluted with 0.15% trifluoroacetic acid and concentrated to 20 µL using vacuum centrifugation. Each sample was analyzed in duplicate. A nanoflow liquid chromatograph (U3000, Dionex, Sunnyvale, CA) coupled to an electrospray hybrid ion trap mass spectrometer (LTQ-Orbitrap, Thermo Fisher, San Jose, CA) was used for tandem mass spectrometry peptide sequencing experiments and relative quantification. The sample was first loaded onto a precolumn (5 mm × 300 µm ID packed with C18 reversed-phase resin, 5 µm, 100Å) and washed for 8 minutes with aqueous 2% acetonitrile and 0.04% trifluoroacetic acid. The trapped peptides were eluted onto the analytical column (C18, 75 µm ID × 15 cm, Pepmap 100, Dionex). The 120-minute gradient was programmed as 95% solvent A (2% acetonitrile + 0.1% formic acid) for 8 minutes, solvent B (90% acetonitrile + 0.1% formic acid) from 5% to 50% in 90 minutes, and then solvent B from 50% to 90% B in 7 minutes and held at 90% for 5 minutes, followed by solvent B from 90% to 5% in 1 minute and re-equilibrated for 10 minutes. The flow rate on the analytical column was 300 nL/min. Five tandem mass spectra were collected in a data-dependent manner following each survey scan. The MS survey scans were performed in Orbitrap (Thermo Fisher) to obtain accurate peptide mass measurement, and the MS/MS scans were performed in a linear ion trap using 60-second exclusion for previously sampled peptide peaks.
Sequest and Mascot searches were performed against the Swiss-Prot human database downloaded on September 14, 2009. Two missed cleavages were allowed; the precursor mass tolerance was 1.08 Da. MS/MS mass tolerance was 0.8 Da. Dynamic modifications included carbamidomethylation (Cys), oxidation (Met), and phosphorylation (Ser, Thr, Tyr). Both MASCOT and SEQUEST search results were summarized in Scaffold 2.0. The integrated peak areas for phosphotyrosine peptide quantification were calculated from extracted ion chromatograms (EIC) 42 using QuanBrowser from Xcalibur 2.0 (Thermo Fisher). These values were restricted by m/z (±0.02) and retention time (120 seconds). The mass accuracy, isotopic peak patterns, and fragment ion spectra of the target peptides were manually inspected to ensure proper sequence assignment and verify peak quality. Run-to-run variations were corrected using ion signal from spiked myoglobin tryptic peptides (25 fmol/injection) as internal standards for the intensity.
Global label-free quantification was performed using the SIEVE program (version 1.2, Thermo Fisher). The alignment and framing parameter settings are m/z range: 450 to 1,600; m/z width: 1.08; and retention time width: 2 minutes. The maximum frame number was restricted to 60,000. Up to 5,000 frames were analyzed by Sequest as described above.
Statistical analysis
Statistical analyses were performed using the t test with 95% confidence intervals. A difference in means with P ≤ 0.05 was considered statistically significant.
Footnotes
Acknowledgements
The authors thank Jodi Kroeger, Noel Clark, Alex Lopez, and Nancy Burke at the Moffitt Cancer Center core facilities for assistance and Rosalie Sears and Sarah Byers at Oregon Health and Science University for advice on c-Myc antibody.
The author(s) declared no potential conflicts of interest with respect to the authorship and/or publication of this article.
The author(s) disclosed receipt of the following financial support for the research and/or authorship of this article: This work was supported by the National Institutes of Health (NIH) [grant numbers R01CA077467, R56CA077467], Development Research Program of the NIH [grant number P50CA119997], and the Dr. Tsai-fan Yu Research Endowment Fund. Moffitt Cancer Center core facilities were supported by NIH cancer center support [grant number P30CA076292]. The Moffitt Proteomics Facility was additionally supported by the National Functional Genomics Center [grant number DAMD17-02-2-0051 from the US Army Medical Research and Materiel Command] and by the Moffitt Foundation.
References
Supplementary Material
Please find the following supplemental material available below.
For Open Access articles published under a Creative Commons License, all supplemental material carries the same license as the article it is associated with.
For non-Open Access articles published, all supplemental material carries a non-exclusive license, and permission requests for re-use of supplemental material or any part of supplemental material shall be sent directly to the copyright owner as specified in the copyright notice associated with the article.