
Abstract
Growth factor signaling drives increased glucose uptake and glycolysis—the Warburg effect—that supports macromolecular synthesis necessary for cell growth and proliferation. Thioredoxin interacting protein (TXNIP), a direct and glucose-induced transcriptional target of MondoA, is a potent negative regulator of glucose uptake and utilization. Thus, TXNIP may inhibit cell growth by restricting substrate availability for macromolecular synthesis. To determine TXNIP’s contribution to metabolic reprogramming, we examined MondoA and TXNIP as cells exit quiescence and enter G1. Serum stimulation of quiescent immortal diploid fibroblasts resulted in an acute upregulation of glucose uptake and glycolysis coinciding with downregulation of TXNIP expression. Ectopic expression of either MondoA or TXNIP restricted cell growth by blocking glucose uptake. Mechanistically, Ras-MAPK and PI3K/Akt signaling inhibit TXNIP translation and MondoA-dependent TXNIP transcription, respectively. We propose that the coordinated downregulation of MondoA transcriptional activity at the TXNIP promoter and inhibition of TXNIP translation are key components of metabolic reprogramming required for cells to exit quiescence.
Introduction
In metazoans, cell proliferation is required for normal organismal function as well as tumorigenesis. Cell proliferation requires increased aerobic glycolysis—the Warburg effect—for de novo synthesis of fatty acids, nucleic acids, proteins, and energy required to increase biomass during the growth phase (G1) of the cell cycle. 1-4 Consistent with an increase in anabolic metabolism, extracellular nutrients such as glucose and amino acids are taken up at higher rates by growing cells to support the increased flux through the biosynthetic pathways that utilize them. 5-7 Certain cell populations exist in a relatively metabolically inactive or quiescent state. Quiescent cells exhibit low flux of glucose through glycolysis and primarily utilize β-oxidation of fatty acids and the tricarboxylic acid cycle (TCA) for survival. 8,9 However, when quiescent cells are stimulated to proliferate, they increase flux through glycolysis while maintaining TCA activity through anapleurosis. 2,10 This reorganization of cellular metabolic programs is required to support biosynthetic processes necessary for cell growth and proliferation. Similarly, transformed cells also reprogram their metabolism to aerobic glycolysis to support their increased proliferation. 11,12 While signals that stimulate cell proliferation have been shown to orchestrate this metabolic reprogramming, little is known about the downstream effectors involved in this process. 4
Originally identified as a transcript induced by vitamin D3, thioredoxin interacting protein (TXNIP) has been subsequently implicated in myriad cellular processes including proliferation and differentiation as well as disease. 13-16 Also known as the vitamin D3 upregulated protein (VDUP1) and thioredoxin-binding protein-2 (TBP-2), TXNIP is considered a tumor suppressor. TXNIP levels are reduced in tumors, and its overexpression causes cell cycle arrest. 13,17,18 Consistent with these findings, high TXNIP expression portends a positive outcome in breast and gastric cancers. 19-21 Some clues to how TXNIP might function to arrest cell growth come from studies in stem cells and those involving p27Kip1; TXNIP expression is essential for maintaining hematopoietic stem cell (HSC) quiescence, 22 and TXNIP stabilizes p27Kip1, which is necessary for quiescence. 23 Thus, TXNIP’s function as a tumor suppressor may be linked to its role in maintaining quiescence.
TXNIP negatively regulates glucose uptake and glycolysis; thus, one way TXNIP may regulate cell growth is by restricting nutrient availability and utilization. 24,25 TXNIP may affect cell nutrient utilization in several ways. For example, murine embryonic fibroblasts (MEFs) from TXNIP−/− mice have increased glucose uptake and lactate production compared to their wild-type counterparts. Thus, deletion of TXNIP alone is sufficient to drive metabolic reprogramming toward aerobic glycolysis. 24 Furthermore, TXNIP destabilizes the hypoxia-induced transcription factor, HIF1α, under normoxic growth conditions. 21 HIF1α activates the transcription of most glycolytic target genes; thus, TXNIP may downregulate a transcriptional program that drives glycolysis. 26-28 Finally, TXNIP loss inactivates the PTEN lipid phosphatase by a REDOX-sensitive mechanism. 29 PTEN negatively regulates glucose transporters and uptake by indirectly regulating the kinase activity of phosphoinositide 3-kinase (PI3K). 30,31 Thus, TXNIP may negatively regulate cell proliferation by controlling several of the core metabolic pathways required for cell proliferation.
Our laboratory is interested in how cells sense and respond transcriptionally to nutrients through the MondoA transcription factor. MondoA is a member of the basic helix-loop-helix leucine zipper (bHLHZIP) family of transcription factors. MondoA heterodimerizes with another bHLHZIP family member, Mlx, and MondoA:Mlx complexes are required for >75% of glucose-induced transcription in an epithelial cancer cell line model. 32 Uniquely, MondoA:Mlx complexes reside at the outer mitochondrial membrane and translocate to the nucleus in response to elevated intracellular glucose-6-phosphate (G6P) concentrations, where they activate transcription of targets including TXNIP. 32 Such a mechanism facilitates exchange of information about the bioenergetic state of the cell between the mitochondria and the nucleus. Thus, MondoA is a glucose sensor, and its nuclear accumulation, promoter binding, and transcriptional activity at glucose-regulated targets reflect cellular nutrient status. 33 MondoA binds directly to carbohydrate response elements (ChoRE) in the TXNIP promoter following elevations in G6P, and MondoA knockout MEFs have no detectable TXNIP mRNA or protein expression. 32,33 Thus, TXNIP expression is entirely dependent on MondoA, suggesting a similarly pleiotropic role for MondoA in nutrient sensing and utilization.
Our current understanding of MondoA function suggests a key role in integrating and in coordinating signals from the 2 major circulating nutrients, glucose and glutamine. For glucose, we have established that MondoA transcriptional activity restricts glucose uptake in several cell lines, in part, through its transcriptional upregulation of TXNIP. Knockdown or knockout of MondoA increases glucose uptake in epithelial cells, and ectopic TXNIP expression partially reverses this upregulation. 32 Consistent with MondoA’s negative regulation of glucose uptake, MondoA knockdown cells exhibit increased growth on plastic and in soft agar. 34 Remarkably, glutamine converts MondoA from a glucose-dependent transcriptional activator of TXNIP to a potent histone deacetylase–dependent transcriptional repressor of TXNIP. Consistent with this molecular mechanism, glutamine-dependent repression of TXNIP by MondoA increases glucose uptake and proliferation. 34-36 The glutamine effect on TXNIP expression requires glutamine metabolism per se and can be mimicked by TCA anapleurosis, suggesting that MondoA monitors glucose and glutamine-dependent signals that converge at the mitochondria.
MondoA has a paralog called the carbohydrate response element binding protein (ChREBP), also known as MondoB. MondoA and ChREBP are most highly expressed in the postmitotic tissues skeletal muscle and liver, respectively, suggesting they primarily regulate energy homeostasis in somatic tissues. 37,38 However, our studies and a recent report implicating ChREBP in anabolic synthesis and cell proliferation suggest an important additional role for the Mondo family in regulating proliferative growth. 39 Here, we investigate how TXNIP translation and MondoA- dependent TXNIP transcription are coordinately regulated to drive metabolic reprogramming as cells transition from quiescence into the growth phase of the cell cycle.
Results
TXNIP downregulation correlates with metabolic reprogramming and cell growth
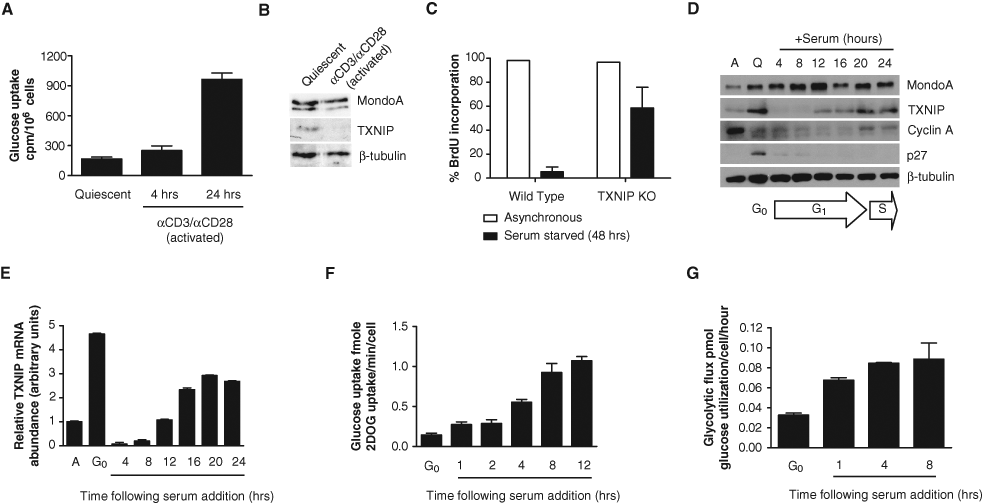
Initially, to investigate whether TXNIP might be involved in metabolic reprogramming, we determined its levels in quiescent and activated T-lymphocytes. T-lymphocytes undergo a well-characterized metabolic reprogramming following activation. 4,5,7 Specifically, quiescent T-lymphocytes rely primarily on mitochondrial respiration for energy production, but following stimulation, they dramatically increase glucose uptake and aerobic glycolysis. 4,7 As expected from these previous reports, glucose uptake was modestly increased in primary murine T-lymphocytes stimulated with α-CD3/α-CD28 for 4 hours; however, after 24 hours of activation, glucose uptake increased >5-fold over quiescent cells (Fig. 1A). Consistent with TXNIP’s negative regulation of glucose uptake, its levels decreased following 4 hours of activation and were undetectable after 24 hours (Fig. 1B and data not shown). Thus, TXNIP downregulation correlates with metabolic reprogramming in activated T-lymphocytes.
TXNIP downregulation correlates with metabolic reprogramming and cell growth. (
To determine the necessity of TXNIP expression for cellular quiescence in other cell contexts, we utilized TXNIP-null murine embryonic fibroblasts (MEFs) 25,40 and assessed growth arrest in the absence of serum. Compared to wild-type MEFs, TXNIP-null MEFs failed to arrest in response to 48 hours of serum deprivation, indicating that TXNIP is required for growth arrest in the absence of proliferative signals (Fig. 1C). Taken together, our data from T-lymphocytes and TXNIP-null MEFs suggest that TXNIP downregulation may drive glucose repartitioning from oxidative metabolism to aerobic glycolysis as cells exit quiescence.
Since TXNIP is required for cellular quiescence, we determined whether TXNIP was downregulated in early G1. For this study, we sought a tractable and well-characterized system: normal diploid human BJ fibroblasts immortalized with human telomerase reverse transcriptase (BJ hTERT). 41 These cells can be synchronized in G0 by serum withdrawal and stimulated by serum readdition to enter the cell cycle. Following 72 hours of serum starvation, quiescence in the BJ hTERTs was validated by stabilization of p27Kip1 and accumulation of cells with 2N DNA content. 42,43 Following the readdition of serum, G1/S progression was validated by p27Kip1 loss by 4 hours, stabilization of cyclin A by 20 hours, and DNA synthesis at 22 hours (Fig. 1D and data not shown). TXNIP was upregulated in quiescent BJ hTERTs (Fig. 1D), consistent with a role for TXNIP in β-oxidation of fatty acids. 29 Within 4 hours of serum addition to quiescent BJ hTERTs, TXNIP loss was observed, suggesting that TXNIP downregulation was necessary for G0 exit and G1 entry. TXNIP protein returned by 12 hours postserum readdition, prior to the stabilization of cyclin A. TXNIP mRNA was also examined, and like TXNIP protein downregulation, its mRNA was reduced >10-fold by 4 hours postserum addition (Fig. 1E). Message increased by 12 hours and subsequently reached stable levels by 20 hours following serum addition. From these data, we conclude that TXNIP message and protein are coordinately downregulated as cells transition from G0 into early G1.
To determine whether metabolic reprogramming occurred in BJ hTERTs and correlated with TXNIP downregulation, glucose uptake and glycolytic flux were assayed. Glucose uptake nearly doubled within the first hour of serum readdition and reached maximal levels by 8 to 12 hours of G1 progression (Fig. 1F). As with glucose uptake, BJ hTERTs exhibited a >2-fold increase in glycolytic flux within 1 hour of serum readdition, which increased to >3-fold by 4 hours and subsequently plateaued by 8 hours (Fig. 1G). Taken together, TXNIP downregulation in early G1 mirrors the increase in glucose uptake and aerobic glycolysis.
Ectopic TXNIP expression restricts glucose uptake and glycolysis and blocks G1 progression
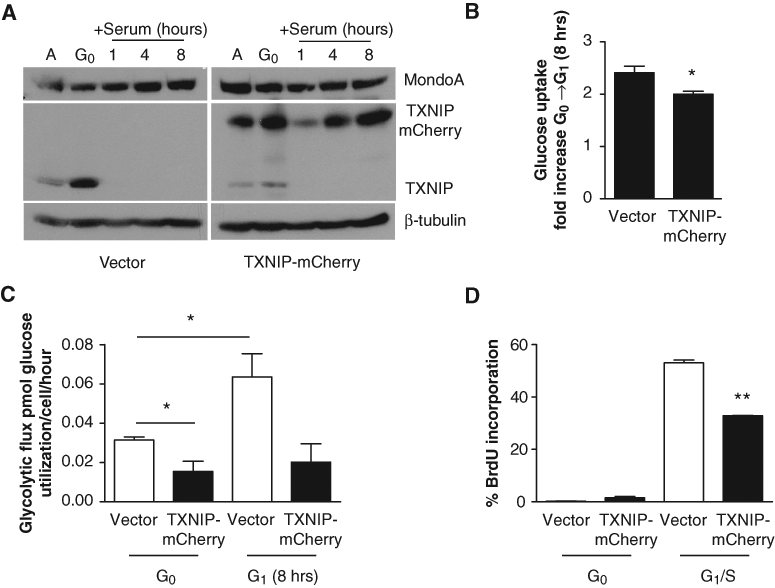
To assess whether TXNIP downregulation in early G1 was necessary for increased glucose uptake and utilization, and consequently cell growth, TXNIP was ectopically expressed in BJ hTERTs (Fig. 2A). It was not possible to generate stable cell lines expressing TXNIP-mCherry; therefore, we used transient overexpression. Following serum addition, ectopic TXNIP-mCherry expression blocked the elevated glucose uptake and glycolytic flux observed in control cells (Fig. 2B and 2C). We presume that partial effect of TXNIP-mCherry (cf. Fig. 1) reflects an incomplete infection of the target cell population, which based on mCherry fluorescence, we estimated to be approximately 20% (data not shown). Ultimately, failure to completely downregulate TXNIP in early G1 resulted in a decrease in the number of cells that progressed to S-phase (Fig. 2D). Unlike endogenous TXNIP, TXNIP-mCherry persisted in early G1, which demonstrated that ectopic TXNIP protein levels could be maintained even though there was downregulation. Because the TXNIP-mCherry fusion only encodes the TXNIP open reading frame, it is likely that the stability of endogenous TXNIP is regulated by its coding sequence rather than by noncoding regions in its mRNA (Fig. 2A) (see below). Interestingly, TXNIP-mCherry reduced endogenous TXNIP protein, indicating that cells must tightly regulate TXNIP levels. From these data, we conclude that TXNIP overexpression can block metabolic reprogramming in early G1, suggesting that TXNIP downregulation is necessary for cell growth.
Ectopic TXNIP expression restricts glucose uptake and glycolysis and blocks G1 progression. (
Dominant-active MondoA blocks G1 progression
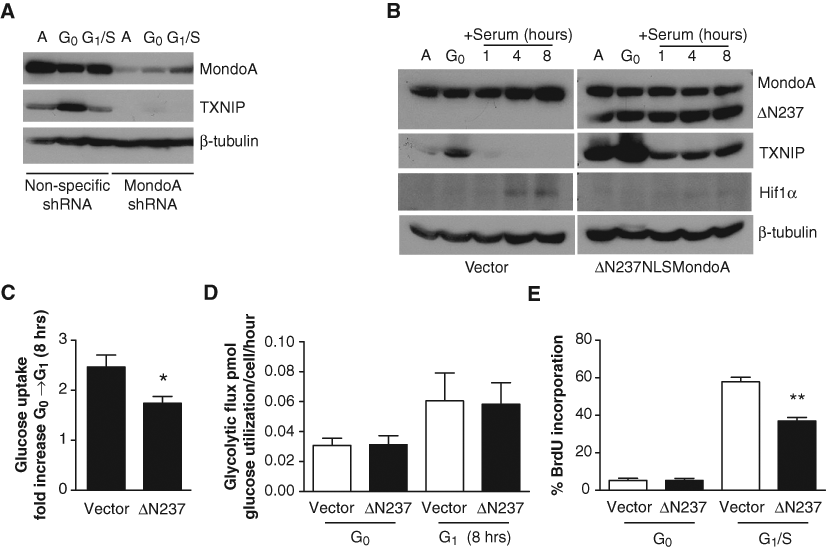
We have previously demonstrated that TXNIP expression is strictly dependent on MondoA and glucose in a number of different cell types 32-34 ; paradoxically, both glucose and MondoA are replete in early G1, but TXNIP protein and message are completely absent (Figs. 1D and 1E and 2A). To further understand the regulation of TXNIP expression by serum, we first established that its expression was MondoA dependent in BJ hTERTs. Consistent with our published data, TXNIP levels were dramatically reduced in MondoA knockdown BJ hTERTs compared to control cells (Fig. 3A), confirming that TXNIP expression is MondoA dependent in this cell system.
Dominant-active MondoA blocks G1 progression. (
To determine whether MondoA played a role in metabolic reprogramming in early G1 and consequently G1 progression, we ectopically expressed a constitutively active allele of MondoA, ΔN237NLSMondoA in BJ hTERTs. 44 ΔN237NLSMondoA drove high TXNIP expression in both asynchronous and quiescent cells and, importantly, partially blocked downregulation of TXNIP in early G1 (Fig. 3B). Additionally, ΔN237NLSMondoA expression in early G1 resulted in a significant decrease in glucose uptake (Fig. 3C). Most importantly, ΔN237NLSMondoA drove a significant decrease in the number of cells that reached S-phase (Fig. 3E). Furthermore, HIF1α stabilization drives aerobic glycolysis, 45 and consistent with metabolic reprogramming, HIF1α was stabilized in early G1 of control BJ hTERTs. Notably, ΔN237NLSMondoA expression resulted in loss of normoxic HIF1α expression in early G1 (Fig. 3B). Surprisingly, ΔN237NLSMondoA did not decrease glycolytic flux like TXNIP-mCherry, and we attribute this disparity to constitutive activation or repression of other MondoA transcriptional targets (Fig. 3D). We conclude that constitutive ectopic MondoA activity is sufficient to block cell growth, presumably by preventing TXNIP downregulation. These data suggest an important role for MondoA in regulating metabolic reprogramming in early G1.
MondoA-dependent TXNIP transcription is acutely inhibited by serum
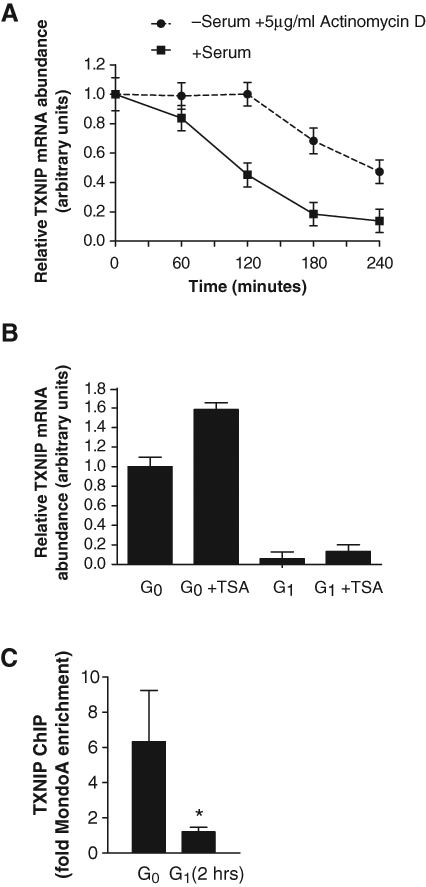
TXNIP expression was downregulated in early G1 (Fig. 1D and 1E), and ΔN237NLSMondoA partially blocked TXNIP downregulation in response to serum (Fig. 3B). To determine whether TXNIP transcription was shut off by serum addition, we determined the half-life of TXNIP mRNA. We treated quiescent BJ hTERTs with the transcription inhibitor actinomycin D (Fig. 4A). In G0 cells, actinomycin D treatment revealed the intrinsic stability of TXNIP mRNA. We compared this to TXNIP mRNA stability following serum addition. The slopes of the exponential portions of each decay curve were similar, indicating that the decay of TXNIP mRNA in early G1 following serum addition was comparable to its decay following transcriptional inhibition in G0. These data support a model where TXNIP transcription is acutely inhibited by serum addition.
MondoA-dependent TXNIP transcription is acutely inhibited by serum. (
TXNIP mRNA can be upregulated by the histone deacetylase (HDAC) inhibitors TSA and SAHA. 34,46,47 To determine whether TXNIP transcriptional downregulation in response to serum was a function of transcriptional repression, we treated quiescent and early G1 cells with TSA. Consistent with published reports, TXNIP mRNA increased by approximately 50% in quiescent BJ hTERTs, suggesting that TXNIP message levels here were modulated by an HDAC-dependent mechanism. However, in early G1, TSA did not increase TXNIP message, indicating that TXNIP transcriptional downregulation by serum did not occur by an active HDAC-dependent repression mechanism (Fig. 4B).
Given that MondoA is absolutely required for TXNIP transcription (Fig. 3A), 32,33 one mechanism of TXNIP mRNA downregulation may be that MondoA leaves the TXNIP promoter in response to serum. To investigate this, we determined MondoA occupancy on the TXNIP promoter using chromatin immunoprecipitation (ChIP). In quiescent BJ hTERTs, MondoA occupied the carbohydrate response element (ChoRE) upstream of the TXNIP transcriptional start site. 32,48 Within 2 hours after serum addition, a time point where TXNIP transcription had ceased but mRNA persisted, MondoA occupancy was reduced at the ChoRE (Fig. 4C). From these data, we conclude that MondoA leaves the TXNIP promoter as a rapid response to serum addition, resulting in a shutdown of TXNIP transcription and decay of existing message. Bulk MondoA levels do not decrease 4 hours after serum addition (Fig. 1), suggesting that the lack of MondoA occupancy at the TXNIP promoter results from a direct serum-dependent modulation of its DNA binding activity rather than protein turnover.
MondoA-dependent TXNIP transcription can be upregulated by 2-deoxy-β-D-glucose (2DOG). 32 Given that TXNIP expression was absent in early G1, we sought to determine whether this was reversible and establish the duration of transcriptional inhibition by serum. Quiescent and early G1 BJ hTERTs were treated with 2DOG for 3 hours prior to the time points indicated in Figure 5. 2DOG increased both TXNIP protein and mRNA in quiescent cells; however, in serum-treated cells, neither TXNIP protein nor mRNA could be upregulated by 2DOG until 8 hours following serum addition (Fig. 5A and 5B). Together, these data indicate that during this window in early G1, MondoA, while expressed, is refractory to stimuli—TSA and 2DOG—known to increase its activity at the TXNIP promoter during other phases of the cell cycle.
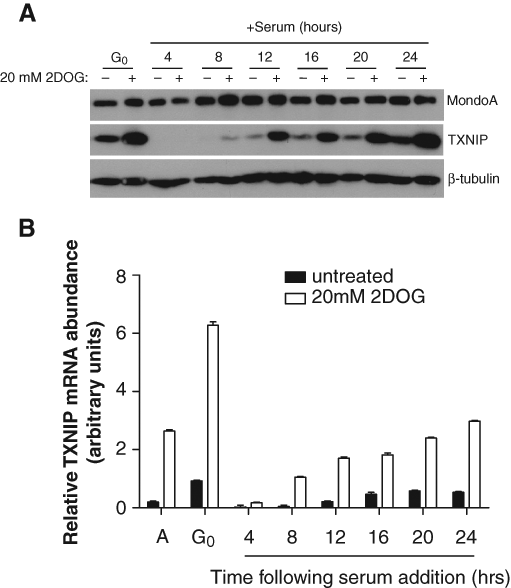
TXNIP expression is refractory to upregulation in early G1. TXNIP, MondoA, and β-tubulin expression was determined by Western blotting (
TXNIP translation is acutely inhibited by serum in early G1
Following serum readdition, TXNIP protein was downregulated prior to its mRNA. TXNIP protein decreased to undetectable levels within 1 hour of serum readdition (Figs. 2A and 3B), whereas TXNIP message persisted for >2 hours (Fig. 4A), suggesting that in addition to downregulation of TXNIP transcription, serum must also downregulate TXNIP protein more directly. To address this possibility, we examined the kinetics of TXNIP downregulation in response to serum. TXNIP protein was acutely downregulated in early G1 BJ hTERTs, and its levels were undetectable within approximately 10 to 15 minutes (Figs. 6A and 7B). To assess whether the rapid decrease in TXNIP protein levels was due to inhibition of translation or increased degradation, we determined the apparent half-life of TXNIP in quiescent cells in the presence of the translation inhibitor cycloheximide. Strikingly, cycloheximide treatment revealed that TXNIP protein was labile, having an apparent half-life of approximately 10 to 15 minutes (Figs. 6B and 7B). Given that TXNIP has the same half-life in G0 and G1, we conclude that the primary effect of serum is a blockade of TXNIP synthesis. Consistent with this, the proteasome inhibitors MG132 and lactacystin, which have been shown to stabilize TXNIP in other cell contexts, 49,50 did not increase TXNIP protein in early G1 (data not shown). Our data demonstrate that both TXNIP transcription and translation are immediately shut off by the addition of serum. Given the stability of TXNIP mRNA in the absence of active transcription (Fig. 4A), inhibition of translation is sufficient to eliminate TXNIP in the earliest stages of G1.
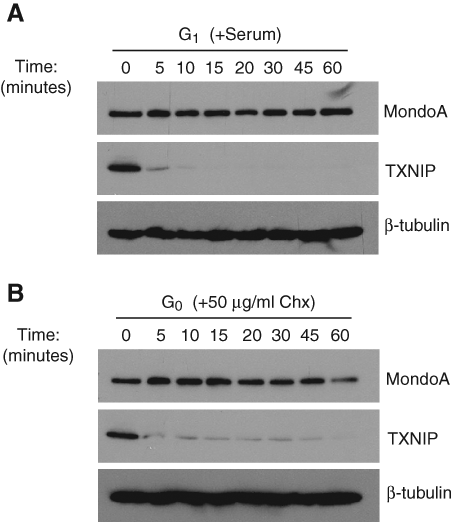
TXNIP translation is acutely inhibited by serum in early G1. TXNIP, MondoA, and β-tubulin levels in BJ hTERTs were determined following treatment of quiescent cells with 10% serum (
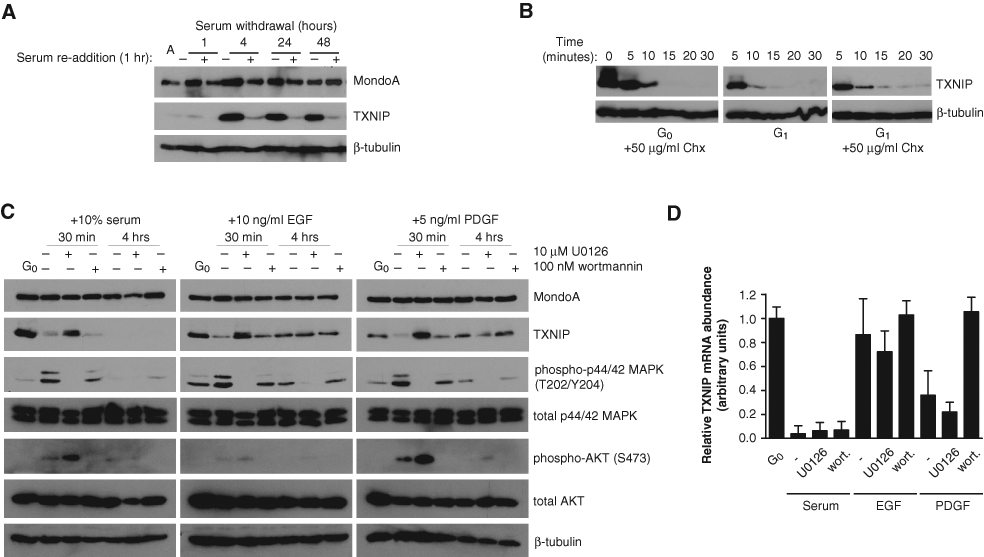
Acute growth factor signaling downregulates TXNIP expression. (
Acute growth factor signaling downregulates TXNIP expression
The immediate nature of TXNIP downregulation suggested a role for active signaling by serum components. We examined the kinetics of TXNIP regulation in response to serum withdrawal and addition to determine whether the state of quiescence per se or dynamic signaling by serum withdrawal and subsequent readdition regulated TXNIP expression. TXNIP protein increased within 1 hour of serum removal and reached maximal levels by 4 hours postserum withdrawal, and these elevated levels persisted out to 48 hours (Fig. 7A). At all time points following serum removal, TXNIP protein levels dramatically decreased following 1 hour of serum readdition. The rapid regulation of TXNIP protein levels by serum suggests that a growth factor–regulated mechanism acutely targets TXNIP translation. To confirm that TXNIP downregulation was an immediate-early response to serum, we treated quiescent BJ hTERTs with both serum and cycloheximide and found that TXNIP protein was still downregulated, indicating that new protein synthesis was not required for inhibition of TXNIP translation (Fig. 7B). This is consistent with downregulation of TXNIP being an immediate-early consequence of signaling activated by serum components.
To investigate which serum components contributed to TXNIP downregulation, we treated quiescent BJ hTERTs for 30 minutes or 4 hours with serum, epidermal growth factor (EGF), or platelet-derived growth factor (PDGF) (Fig. 7C). After 30 minutes, all treatments downregulated TXNIP protein, but not TXNIP mRNA, suggesting that signaling through the receptor tyrosine kinases (RTK) EGFR and PDGFR inhibited TXNIP protein expression. After 4 hours of treatment, TXNIP protein returned to steady-state levels in EGF-treated cells and was partially restored in PDGF-treated cells. As before (Fig. 1D), TXNIP protein levels were not detectable following a 4-hour serum treatment. After 4 hours, EGF or PDGF treatment had no effect or only modestly downregulated TXNIP message, respectively (Fig. 7D). By contrast, TXNIP message remained low following 4 hours of serum treatment. Taken together, these data suggest that serum contains components capable of downregulating both TXNIP transcription and translation, whereas isolated EGF- and PDGF-derived signals primarily inhibit TXNIP translation.
As both EGFR and PDGFR signal through PI3K and Ras, 51 we next determined which pathway was necessary for downregulation of TXNIP translation. Inhibition of PI3K with wortmannin did not fully restore TXNIP protein following 30-minute treatments with EGF, PDGF, or serum. By contrast, inhibition of MEK, a Ras effector upstream of MAPK, with U0126 restored TXNIP protein levels following 30-minute treatments with EGF, PDGF, or serum. Thus, the Ras-MAPK arm of the EGFR, PDGFR, and serum signaling pathways can drive inhibition of TXNIP translation (Fig. 7C). After 4 hours of serum treatment, when TXNIP message is absent, U0126 did not restore TXNIP mRNA or protein, suggesting that Ras-MAPK signaling activated by serum did not regulate TXNIP transcription. By contrast, wortmannin restored TXNIP message in PDGF-treated cells but had no effect on serum-treated BJ hTERTs. Thus, PI3K signaling downstream of PDGFR must partially block TXNIP transcription, which is consistent with one previous report. 52 Further, the lack of effect of wortmannin on serum-dependent downregulation of TXNIP transcription suggests that other signaling pathways must regulate TXNIP transcription downstream of PI3K or in parallel with PI3K signaling.
Acute Ras-MAPK activation downregulates TXNIP translation
We next wished to determine whether Ras-MAPK signaling was sufficient to inhibit TXNIP translation. To simplify these experiments, they were conducted in the absence of serum to eliminate other signaling inputs. Since constitutive Ras activity in BJ hTERTs causes senescence, 53,54 we expressed a regulatable allele of activated oncogenic Ras. This allele expresses RasG12V as a fusion to the estrogen receptor (ER) ligand-binding domain that is stabilized and therefore activated by binding 4-hydroxytamoxifen (4OHT). 55,56 ER:RasG12V stabilization with increasing concentrations of 4OHT resulted in dose-dependent MAPK phosphorylation, which coincided with TXNIP downregulation when compared to control cells (Fig. 8). ER:RasG12V failed to activate PI3K as measured by Akt S473 phosphorylation, further suggesting that MAPK activation downstream of Ras is critical for downregulation of TXNIP translation (data not shown). From these data, we conclude that Ras-MAPK signaling actively inhibits TXNIP translation, which is consistent with the immediate-early kinetics of TXNIP translational downregulation.
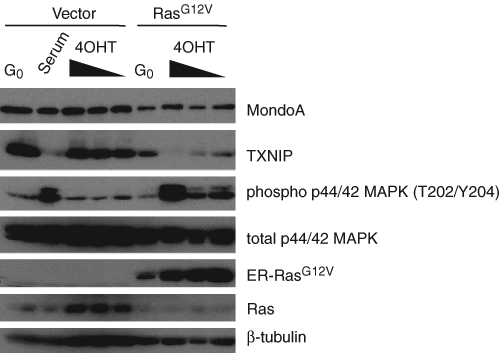
Acute Ras-MAPK activation downregulates TXNIP translation. TXNIP, MondoA, phospho-MAPK, and β-tubulin levels were determined in BJ hTERTs infected with pBABE-puro-ER (vector) and pBABE-puro-ER:RasG12V (RasG12V) by Western blotting. Quiescent cells (G0) were treated with 10% serum or increasing concentrations (64.5 nM, 645 nM, and 6.45 µM) of 4-hydroxytamoxifen (4OHT) as indicated for 4 hours.
Discussion
As cells exit quiescence and enter the cell cycle, metabolic reprogramming in early G1 drives biosynthesis of macromolecules necessary for cell growth prior to proliferation. Our data extend the current understanding of metabolic reprogramming by demonstrating the coordinated downregulation of TXNIP translation and MondoA-dependent TXNIP transcription as serum-starved cells exit quiescence and enter early G1. Further, we directly link TXNIP downregulation to the signaling pathways commonly associated with metabolic reprogramming and growth, Ras-MAPK and PI3K/Akt. 57-59 Because constitutive MondoA or TXNIP expression blocks metabolic reprogramming in early G1, we suggest that TXNIP downregulation not only correlates with metabolic reprogramming but is a required event for cells to enter a productive cell cycle from quiescence. Finally, given the prevalence of activating mutations in RTKs and their downstream effectors in cancer, 51,60,61 we suggest that dysregulated TXNIP expression may be a relatively common driver contributing to the Warburg effect in tumorigenesis.
TXNIP has emerged as an interesting candidate in the regulation of cell growth and metabolism. Currently, literature suggests that TXNIP loss in early G1 may drive metabolic reprogramming by one of several mechanisms or by a combination of these mechanisms. For example, T-lymphocytes upregulate GLUT-1 following stimulation in order to increase glucose consumption to support growth, 2,4 correlating with the downregulation of TXNIP we observed. Thus, it is possible that TXNIP regulates, directly or indirectly, the expression level of the glucose transporters. Supporting a direct regulatory mechanism are findings demonstrating that TXNIP localizes to the nucleus and can interact with transcriptional corepressors. 13,62 A second possibility is that TXNIP loss leads to the stabilization of the HIF1α transcription factor that regulates the expression of most glycolytic target genes. Finally, TXNIP loss leads to inactivation of PTEN 29 and the consequent activation of PI3K and its well-characterized functions in controlling both metabolic reprogramming and proliferation. 63 As cells exit quiescence, they must reorganize the machinery that directly regulates the transition into G1, for example, cyclins, cyclin-dependent kinases, and cyclin-dependent kinase inhibitors. Our data suggest that reprogramming cellular metabolism in early G1 is similarly complex and suggest a central role for TXNIP in orchestrating these growth-supporting metabolic changes. TXNIP also modulates levels of the cyclin-dependent kinase inhibitor p27Kip1, 23 implying a function for TXNIP in linking cell cycle regulation directly to cellular metabolism.
Activation of many oncogenes can drive aerobic glycolysis, and in many cases, their regulation of metabolic reprogramming appears direct, implying that the Warburg effect contributes functionally to cancer cell growth rather than merely correlating with cancer cell growth. 59,64,65 Interestingly, tumor cell models with activating Ras mutations have increased glucose uptake and glycolytic flux associated with the constitutive activation of Ras-MAPK signaling. 66,67 This effect of active Ras has been classically ascribed to its activation of cMyc and HIF1α. 57,68,69 However, we demonstrate here a direct contribution of Ras-MAPK signaling to metabolic reprogramming via its acute inhibition of TXNIP translation in early G1. This suggests that Ras-MAPK activation might regulate metabolic reprogramming by coordinating the activities of Myc/HIF1α and TXNIP. Myc and HIF1α regulate the transcription of genes encoding glycolytic and other biosynthetic targets. 70,71 Thus, one simple model for how Ras-MAPK may coordinate metabolic reprogramming is that TXNIP downregulation allows uptake of glucose and potentially other “building blocks” required for cell growth, and Myc/HIF1α upregulation controls flux of these nutrients into biosynthetic pathways. As Myc-overexpressing cells can be addicted to glucose and/or glutamine, 72-75 coordinating nutrient availability with nutrient utilization is clearly required for cellular homeostasis.
Recently, ChREBP (MondoB) was shown to be necessary for metabolic reprogramming in colorectal cancer cells and hepatoblastoma cells. 39 For example, ChREBP knockdown cells shut down aerobic glycolysis and anabolic pathways and have reduced proliferation rates. Previously, we have shown that MondoA restricts glucose uptake 32 ; thus, MondoA may act in opposition to ChREBP. In BJ hTERT cells, ΔN237NLSMondoA upregulates TXNIP transcription and reduces glucose uptake as expected; however, ΔN237NLSMondoA does not inhibit glycolysis. By contrast, TXNIP overexpression restricts both glucose uptake and glycolysis. Therefore, in addition to TXNIP, there must be other transcriptional targets of ΔN237NLSMondoA that oppose the negative activity of TXNIP on glycolysis. Identifying the direct MondoA-dependent transcriptome will likely provide insight into this important issue.
TXNIP expression is restored later in G1, coinciding with a plateau in glucose uptake and utilization at about 12 hours following serum addition presumably when the biosynthetic needs of the cell are met. There may be 2 functional consequences to TXNIP upregulation later in G1. First, TXNIP can bind to and inhibit thioredoxin, resulting in increased intracellular reactive oxygen species (ROS). 76 ROS are required for G1 progression and S-phase entry. 77 Thus, restoring TXNIP activity later in G1 may contribute to increased ROS and subsequently G1 progression and S-phase entry. Second, the restriction point (R) is defined as a point in G1 where the cell assesses nutrient availability and can either arrest in order to survive under suboptimal growth conditions or proliferate when conditions are favorable. 78 Thus, it is possible that TXNIP upregulation occurs at a point that defines R in later G1, after which the commitment to undergo DNA replication and cell division no longer falls under nutrient control.
We show that TXNIP transcription is downregulated in early G1 when MondoA leaves the TXNIP promoter. Additionally, wortmannin partially blocks TXNIP mRNA downregulation in early G1 following PDGF but not serum addition. Thus, there must be additional pathways within serum that bypass PI3K and regulate MondoA activation of the TXNIP promoter. It still remains to be determined how serum acutely and negatively regulates MondoA activity at the TXNIP promoter. ChREBP localization and activity are regulated by phosphorylation of key residues encompassing its DNA binding domain and nuclear localization sequence 79 ; however, these residues are not conserved in MondoA. We cannot formally rule out the possibility that MondoA’s activation of TXNIP transcription is directly modulated by posttranslational modification in response to serum, yet the opposing roles for MondoA and ChREBP discussed above do not favor a unifying mechanism. A second interesting mechanistic possibility involves our recent demonstration that MondoA occupancy and activity at the TXNIP promoter are increased as intracellular pH drops. 20 Previous studies have established that growth factor stimulation leads to a rapid—after approximately 2 minutes—increase in intracellular pH, and this pH increase is required for cell division. 80,81 These findings support a model where intracellular alkalinization following growth factor stimulation drives MondoA off the TXNIP promoter, accounting for the rapid transcriptional shutdown of MondoA-dependent transcription of TXNIP we observed in response to serum.
The mechanism by which acute Ras signaling inhibits TXNIP translation is not completely understood. TXNIP-mCherry is destabilized by serum yet only has the coding sequence of the TXNIP message, eliminating translational regulation via its 5′ or 3′ UTRs as a possibility. MicroRNAs (miRNAs) typically inhibit translation by interacting with the 3′ UTR, yet there are examples of miRNAs targeting coding sequences. 82,83 Thus, we cannot completely rule out the involvement of miRNAs in regulating TXNIP translation. Furthermore, the rapid kinetics of TXNIP downregulation suggests a more direct mechanism that does not involve de novo RNA synthesis. With these caveats, it seems most likely that Ras-MAPK signaling targets pre-existing components of the translational initiation machinery or, potentially, translating ribosomes. There are multiple examples of signaling cascades impinging directly on the translational initiation machinery, supporting the former mechanism. 84-86
Our results establish the necessity of TXNIP downregulation for cells to escape quiescence and enter G1. The fact that both TXNIP translation and TXNIP transcription are both inhibited by serum further underscores this point. Our data indicate that TXNIP transcription and translation are likely inhibited as acute immediate-early responses to serum addition. While activated simultaneously, each repression mechanism persists for a different length of time. EGF only effects translational inhibition of TXNIP. TXNIP protein returns to normal levels after 4 hours of EGF treatment, defining the window of translational inhibition. The transient nature of TXNIP translational inhibition likely reflects the well-characterized transient signaling through the Ras-MAPK pathway. 87,88 By contrast, TXNIP transcription is shut off for a much longer time, not being inducible until 8 to 12 hours following serum addition. Thus, inhibition of TXNIP transcription reinforces the inhibition of TXNIP translation early in G1. At 8 to 12 hours following serum addition, the translational inhibition mechanism is no longer in force, and TXNIP protein levels appear to be primarily under the control of MondoA-dependent activation of TXNIP transcription. We have examined TXNIP regulation in subsequent G1 phases of the cell cycle and find that TXNIP transcriptional and translational inhibition are restricted to the first G1 phase following the release from quiescence (data not shown). This finding is reminiscent of the peak of cMyc mRNA and protein observed only in the first G1 following serum stimulation of quiescent cells. 89,90 We speculate that the restricted regulation of TXNIP and cMyc to the first G1 after serum addition reflects increased metabolic requirements for cells to exit G0 and that these metabolic demands must be relaxed during ensuing G1 phases.
The switch to aerobic glycolysis supplies energy and biomolecules to support the high division rates of many cancer cells. Our work establishes an important role for TXNIP downregulation in metabolic reprogramming as cells exit quiescence and enter the first G1 phase of the cell cycle. While not studied here broadly, we show that TXNIP is rapidly upregulated by serum withdrawal, which may serve to downregulate nutrient uptake and utilization in response to reduced signaling from growth factors. Such a model implies that rapid metabolic reprogramming may also be an early event involved in establishing quiescence. Our work provides new insights into how growth factor signaling impacts transcriptional and translational regulation of TXNIP, and likely other targets, leading to cell growth, and yields insights into how TXNIP dysregulation may contribute to tumorigenesis. Reactivation of TXNIP is an attractive therapeutic strategy in cancer treatment. 91 Our work suggests that TXNIP upregulation through ectopic activation of MondoA may be one way to restrict nutrient uptake and cell growth.
Materials and Methods
Cell culture and conditions
BJ hTERTs 41 were maintained at 37°C in 5% CO2 in Dulbecco modified Eagle medium (DMEM) (HyClone Laboratories, Thermo Fisher Scientific, Logan, UT) supplemented with 10% bovine calf serum (BCS) (HyClone Laboratories) and penicillin/streptomycin (pen/strep). For serum starvation (quiescence), cells were washed with PBS and incubated in DMEM containing 0.1% bovine serum albumin (BSA) and pen/strep for 72 hours. Serum starvation media were replaced with growth media to release cells into the cell cycle for times indicated. For growth factor stimulation, 10 ng/mL EGF (Sigma-Aldrich, St. Louis, MO) or 5 ng/mL PDGF (Sigma-Aldrich) were added to serum starvation media for times indicated. For MEK and PI3K inhibition, serum-starved cells were pretreated for 30 minutes with 10 µM U0126 (Cell Signaling Technology, Danvers, MA) or 100 nM wortmannin (Cell Signaling Technology), respectively, and were then treated with serum or growth factors in the presence of the inhibitors for times indicated. For mRNA and protein stability studies, cells were treated with 5 µg/mL actinomycin D (Sigma-Aldrich) or 50 µg/mL cycloheximide (Sigma-Aldrich), respectively, under conditions and for times indicated. For HDAC studies, cells were treated with 100 ng/mL trichostatin A (TSA) (Biomol, Hamburg, Germany) for 5 hours prior to mRNA isolation. Primary quiescent T-lymphocytes were isolated from murine spleen and purified via negative selection using the EasySep Mouse T Cell Enrichment Kit (STEMCELL Technologies, Vancouver, BC, Canada) and cultured in RPMI 1640 (Cellgro, Mediatech Inc., Manassas, VA) supplemented with 10% fetal bovine serum (FBS) (HyClone Laboratories). Isolated T-lymphocytes were activated using Dynabeads Mouse T-Activator CD3/CD28 for cell expansion and activation (Invitrogen, Carlsbad, CA) for the indicated times. Wild-type and TXNIP-null MEFs 40 were immortalized by a 3T3 protocol 92 and maintained at 37°C in 5% CO2 in DMEM supplemented with 10% FBS and pen/strep. For serum starvation, cells were washed with PBS and incubated with DMEM supplemented with 0.5% FBS and pen/strep for 48 hours. Cells were stimulated to enter the cell cycle by replacing serum starvation media with growth media for times indicated.
Western blotting
Whole-cell lysates were prepared in ice-cold RIPA (150 mM NaCl, 10 mM Tris-Cl [pH 7.4], 0.1% SDS, 1.0% triton X100, 1.0% Na-deoxycholate, 5 mM EDTA) containing protease and phosphatase inhibitors. Protein concentrations were determined by Bradford Protein Assay (Bio-Rad Laboratories, Hercules, CA). Following SDS-PAGE, proteins were transferred to PVDF membranes (PerkinElmer Inc., Waltham, MA) and subsequently blocked in 5% nonfat dry milk-TBST (50 mM Tris-Cl [pH 8.0], 150 mM NaCl, 0.05% Tween 20) and probed with anti-MondoA (1:500), 32 anti-VDUP1(TXNIP) (1:1,000) (MBL International, Woburn, MA), anti-tubulin (1:10,000) (Sigma-Aldrich), anti-cyclin A, anti-p27, anti-H-Ras (Santa Cruz Biotechnology, Santa Cruz, CA), anti-Hif1α (1:1,000) (BD Biosciences, Franklin Lakes, NJ), anti-phospho-p44/42 MAPK (T202/Y204), anti-p44/42 MAPK, anti-phospho-Akt (S473), and anti-Akt (Cell Signaling Technology) at 1:500 or 1:1,000 or as otherwise indicated. The blots were developed using ECL Plus (Amersham, GE Healthcare, Little Chalfont, UK).
Glucose uptake assays
BJ hTERTs were plated at 50,000 cells/well in 6-well dishes and treated as indicated. There were 106 quiescent or activated T-lymphocytes used for assays at time points indicated. For all conditions, cells were washed with Krebs-Ringer-Phosphate-Hepes (KRPH, 5 mM Na-phosphate [pH 7.4], 20 mM Hepes [pH 7.4-7.9], 1 mM MgSO4, 1 mM CaCl2, 136 mM NaCl, 4.7 mM KCl) buffer and then incubated for 15 minutes in 1 mL KRPH containing 1 mM 2-deoxy-β-D-glucose (2DOG) (Sigma-Aldrich) and 1 µCi 2-deoxy-D-[1,2-3H(N)]-glucose (specific activity, 5-10 Ci/mmol) (PerkinElmer Inc.) at 37°C/5% CO2. Glucose uptake was terminated by removing the incubation solution and washing cells with ice-cold KRPH. Cells were solubilized with 0.1% SDS overnight at room temperature prior to scintillation counting to determine radiolabel incorporation. Assay results were normalized to cell number where indicated as described. 32 All experiments were represented by 3 biological replicates, and all data shown represent the results from at least 3 experiments.
Glycolytic flux assays
BJ hTERTs were plated at 50,000 cells/well in 6-well dishes and treated as indicated. For glycolysis assay, media were removed from cells and replaced with 0.5 mL media containing 10 µCi D-[5-3H(N)]-glucose (specific activity 10-20 Ci/mmol) (PerkinElmer Inc.) for 1 hour at 37°C/5% CO2. The assay was terminated by addition of 0.5 mL 2N HCl. Triplicate 100-µL aliquots were transferred to capless 0.2-mL tubes and placed in sealed scintillation vials containing 0.5 mL H2O for 48 hours at room temperature to allow for diffusion and equilibration of 3H2O. The 0.2-mL tubes were subsequently transferred to new scintillation vials, and both diffused (3H2O) and unutilized D-[5-3H(N)]-glucose were determined by scintillation counting. Controls for 3H2O diffusion included 3H2O standard and D-[5-3H(N)]-glucose only. Data were analyzed by comparing diffused samples (reduced to 3H2O by glycolysis) to undiffused samples and determining pmol glucose utilized per hour per cell as described. 7,32 Each experiment represents 2 biological replicates, and all data shown represent the results from at least 3 experiments.
Viruses and infections
Lentiviral pCDH-mCherry and pCDH-TXNIP-mCherry were gifts from W. Chutkow. 25 pEIZ-Green was a gift from B. Welm. pEIZ-Green- ΔN237-NLSMondoA was constructed by cloning ΔN237NLS-MondoA as an XhoI/end-filled fragment from LXSH-Δ N237NLS-MondoA 44 into the SmaI site of pEIZ-Green. Retroviral LMP vectors (Open Biosystems, Thermo Fisher Scientific, Huntsville, AL) containing nonsilencing (NS) and MondoA-specific shRNA (M2) sequences were as described. 32 Retroviral construct pBABE-puro-ER:RasG12V was a gift from C. Counter, 55 and pBABE-puro was as described. 93 Stable cell lines containing nonsilencing shRNA, MondoA shRNA, pBABE-puro, and ER:RasG12V were made by infecting BJ hTERTs with retrovirus generated from each construct in HEK293T cells 94 and subsequent selection in 2 µg/mL puromycin. For experiments utilizing BJ hTERT: pBABE-puro and BJ hTERT:pBABE-puro-ER:RasG12V, cells were plated and serum starved as above and subsequently treated with vehicle (0.1% ethanol) or indicated concentrations of 4-hydroxytamoxifen for 4 hours in starvation media prior to analysis. Transient infections with pCDH-mCherry, pCDH-TXNIP-mCherry, pEIZ-Green, and pEIZ-Green-ΔN237NL SMondoA were performed with lentivirus generated from each construct in HEK 293T as described. 95 Briefly, BJ hTERTs were infected overnight with lentivirus from each construct and allowed to recover from infection for 24 hours. Asynchronous cells were subsequently serum starved for 72 hours and then released into G1 by serum addition. Relative infection efficiency for each experiment was determined by mCherry fluorescence (pCDH) or GFP fluorescence (pEIZ).
BrdU labeling and immunofluorescence
BJ hTERTs or MEFs were plated at subconfluent density on cover slips and treated as indicated. For MEFs, cells were incubated for 24 hours in media containing 10 µM 5-bromo-2′-deoxyuridine (BrdU) (Roche, Basel, Switzerland) prior to analysis for all conditions tested. For BJ hTERTs, G1 cells, following 22 hours in media supplemented with serum, were incubated in media containing 10 µM BrdU for 4 hours, and quiescent cells received 10 µM BrdU in media lacking serum for 4 hours. Following BrdU labeling, cells were washed with PBS and then fixed in ice-cold methanol for 10 minutes, and DNA was denatured with 2N HCl for 1 hour at 37°C. Cover slips were subsequently neutralized by 20-minute incubation in 0.1 M sodium borate (pH 8.5) and subsequently washed with PBS. Cover slips were blocked in PBS containing 0.1% BSA, then incubated with 1 µg/mL anti-fluorescein-BrdU (Roche) for 1 hour, and subsequently washed with PBS. Following 10-minute incubation with 1 µg/mL DAPI (Sigma-Aldrich), cover slips were washed and mounted using Prolong Gold (Invitrogen). Total cell number was determined by counting nuclei (DAPI) and BrdU incorporation by counting fluorescein labeled cells. For each experiment, 200 to 500 total cells per cover slip were counted, and 3 cover slips per condition were evaluated. Each data point shown represents the average of 3 independent experiments.
Chromatin immunoprecipitation (ChIP)
There were 1.8 × 10⁶ BJ hTERTs on 15-cm dishes (3 dishes per point) for all conditions indicated that were washed with PBS and fixed/cross-linked for 10 minutes with 1% formaldehyde. Cross-linking was stopped with 0.125 M glycine for 10 minutes, and cells were washed with PBS and harvested by scraping and incubation in cell lysis buffer (10 mM Tris-Cl [pH 7.4], 10 mM NaCl, 3 mM MgCl2, 0.5% NP40). After washing, cell pellets were sonicated at 4°C in 0.5 mL nuclear lysis buffer (50 mM Tris-Cl [pH 8.0], 10 mM EDTA, 5 mM EGTA, 1% SDS) for 20 rounds of 25-second cycles (0.9 sec on/0.1 sec off) on a Misonix Ultrasonic Processor on setting 3 (Misonix Inc., Farmingdale, NY). The extent of chromatin shearing was determined by reversing the cross-links on an aliquot and examination by agarose gel electrophoresis. Sonicated lysates were per-cleared by incubation with Dynabeads (sheep anti-rabbit M-280, Invitrogen) at 4°C in ChIP dilution buffer (20 mM Tris [pH 8.0], 2 mM EDTA, 150 mM NaCl, 1% Triton X-100, 2 mg/mL BSA, 100 µg/mL ssDNA) and immunoprecipitated overnight with 2 µg anti-MondoA or 2 µg normal rabbit IgG (Santa Cruz Biotechnology) at 4°C. Beads were isolated by magnetic separation and washed once with wash I (20 mM Tris-Cl [pH 8.0], 2 mM EDTA, 1% Triton X-100, 150 mM NaCl, 1 mM PMSF), then twice with wash II (wash I with 0.1% SDS, 500 mM NaCl), and finally once with wash III (20 mM Tris-Cl [pH 8.0], 1 mM EDTA, 250 mM LiCl, 0.5% NP40, 0.5% sodium deoxycholate). Beads were resuspended in 50 µL 10 mM Tris-Cl [pH 8.0], 1 mM EDTA (TE), and incubated with 200 ng/mL RNase A (Qiagen, Venlo, the Netherlands) for 20 minutes at 37°C. Proteinase K and SDS were added to final concentrations of 200 µg/mL and 0.5%, respectively, and beads were incubated at 55°C for 3 hours. Subsequently, immunoprecipitations were incubated overnight at 65°C to reverse cross-links. Samples were phenol-chloroform extracted and further processed by the Qiaquick PCR Purification Kit (Qiagen) prior to qPCR. For experiments shown, specific MondoA DNA binding was determined by normalizing to IgG controls, and MondoA enrichment at the TXNIP locus (forward 5′-CAGCGATCTCACTGATTG-3′, reverse 5′-AGTTTCAAGCAGGAGGCG-3′) was determined at all conditions by normalizing qPCR to the MondoA off-target loci PFKFB3 (forward 5′-CAGGAGTGGAGTGGGACTC-3′, reverse 5′-CCTCTCAGAGCCCCTGTTC-3′) or Bcl2 (forward 5′-CACTCCCAGTCCAAATGTCC-3′, reverse 5′-GAGGCCATAAACAGCTCTGG-3′). 32,33 DNA quantities were determined from standard curves for all primer sets. Data represented are from 3 independent experiments.
Reverse transcription quantitative PCR (RT-qPCR)
For expression analysis, total RNA was extracted from cells using RNeasy Mini Kit (Qiagen), and cDNA was generated from 250 to 500 ng RNA using Superscript III RT system (oligo dT, Invitrogen). cDNAs were mixed with TXNIP (forward 5′-TGGTGGATGATGTCAATACCCCT-3′, reverse 5′-ATTGGCAAGGTAAGTGTGGC-3′) or RPL19 (forward 5′-ATGTATCACAGCCTGTACCTG-3′, reverse 5′-TTCTTGGTCTCTTCCTCCTTG-3′) primers and IQ SYBR Green Supermix (Bio-Rad Laboratories), and qPCR reactions were performed on the iCycler (Bio-Rad Laboratories) as follows: 1 cycle at 95°C for 2.5 minutes, 40 cycles of 95°C for 30 seconds, 55°C for 30 seconds, 1 cycle at 72°C for 35 seconds, 1 cycle at 72°C for 2.5 minutes, and 77 cycles at 72°C to 95°C for 10 seconds at each temperature. Relative mRNA quantities were determined from standard curves for each primer set, and TXNIP mRNA quantities were normalized to RPL19 expression. For each experiment, triplicate reactions were run from a minimum of 2 biological replicates.
Footnotes
Acknowledgements
The authors thank W. Chutkow for wild-type and TXNIP-null MEFs and M. Topham and the Ayer Laboratory for reviewing the paper.
The author(s) declared no potential conflicts of interest with respect to the authorship and/or publication of this article.
National Institutes of Health grants GM55668 and GM60387 (to D.E.A.) and the Huntsman Cancer Foundation supported this work. DNA sequencing and oligonucleotide synthesis were supported by Cancer Center Support Grant 2P30 CA42014.