
Abstract
Clear cell renal cell carcinoma (ccRCC) is the predominant RCC subtype, but even within this classification, the natural history is heterogeneous and difficult to predict. A sophisticated understanding of the molecular features most discriminatory for the underlying tumor heterogeneity should be predicated on identifiable and biologically meaningful patterns of gene expression. Gene expression microarray data were analyzed using software that implements iterative unsupervised consensus clustering algorithms to identify the optimal molecular subclasses, without clinical or other classifying information. ConsensusCluster analysis identified two distinct subtypes of ccRCC within the training set, designated clear cell type A (ccA) and B (ccB). Based on the core tumors, or most well-defined arrays, in each subtype, logical analysis of data (LAD) defined a small, highly predictive gene set that could then be used to classify additional tumors individually. The subclasses were corroborated in a validation data set of 177 tumors and analyzed for clinical outcome. Based on individual tumor assignment, tumors designated ccA have markedly improved disease-specific survival compared to ccB (median survival of 8.6 vs 2.0 years, P = 0.002). Analyzed by both univariate and multivariate analysis, the classification schema was independently associated with survival. Using patterns of gene expression based on a defined gene set, ccRCC was classified into two robust subclasses based on inherent molecular features that ultimately correspond to marked differences in clinical outcome. This classification schema thus provides a molecular stratification applicable to individual tumors that has implications to influence treatment decisions, define biological mechanisms involved in ccRCC tumor progression, and direct future drug discovery.
Keywords
Introduction
Clear cell renal cell carcinoma (ccRCC) afflicts upwards of 50,000 patients annually. 1 Most of these patients will present initially with localized disease, managed with surgery, but unfortunately, nearly a third will develop recurrence and succumb to their disease. ccRCC incidence has increased uniformly over the past 30 years, associated with stage migration toward lower stages, likely due to the increased detection of lesions incidentally. However, there has not been commensurate improvement in survival. ccRCC tumors have variable natural histories, and genetic strategies have been largely unhelpful in identifying patients with higher or lower risk for recurrence due to the overwhelming association of this cancer with von Hippel– Lindau (VHL) tumor suppressor gene inactivation. 2,3
The Fuhrman classification system stratifies ccRCC by tumor cell morphology: low-grade (grade 1), intermediate-grade (grades 2 and 3), and high-grade (grade 4) tumors, with corresponding association with RCC-related death. 4 Prognostic scoring systems such as the UCLA Integrated Staging System (UISS) have been developed using these morphologic characteristics, tumor size, and patient performance status as well as the inherent characteristics of stage and nodal status. 5,6 Other algorithms incorporate postoperative clinical information but have limited discriminative ability for the abundant intermediate-grade and intermediate-stage tumors, and they fail to account for molecular distinctions in tumors. 7 The molecular basis of this diversity in clinical behavior is unclear and makes ccRCC a ripe target for investigating the nature of these heterogeneities.
Gene expression analyses have provided meaningful insight into the clinical heterogeneity of many solid tumors. Unsupervised clustering of gene expression data with supervised learning methods can provide powerful strategies to identify molecularly and clinically significant cancer subtypes. 8-11 New unsupervised consensus ensemble clustering strategies have been developed that have successfully identified breast cancer subtypes correlated with significant differences in risk for recurrence. 12-15
In ccRCC, using traditional unsupervised gene expression analysis, we and others have demonstrated that two or more molecular subclassifications of this tumor type exist. 16-20 Many prior investigations, however, have relied on preselected molecular features or clinical outcomes as the criteria to identify expression signatures and distinguish gene sets. This type of approach fails to permit the underlying tumor biology, through the molecular end products of genetic changes, to inform the formation of tumor subgroups. A robust molecular classification system that connects tumor biology with individual tumor behavior should identify a priori the inherent patterns of gene expression that classify samples into nonoverlapping sets with a high degree of accuracy.
To investigate the molecular features that best define subsets of renal cell carcinoma, we applied unsupervised consensus clustering to the gene expression data of ccRCC tumors, without applying biologic or clinical information. Two robust subtypes (we have designated ccA and ccB) with differentiating biological signatures could be distinguished using a small gene set defined by logical analysis of data (LAD). This gene set allows for assignment of individual tumors within the ccA/ccB classification scheme and is easily translatable to reverse transcription PCR (RT-PCR) technology. Validation in an independent data set demonstrated that ccA tumors have a markedly better prognosis than ccB and that the molecular subtype was significantly associated with survival in both univariate and multivariate analysis. The identification of two robust ccRCC subclasses, which can be assigned by a small but highly significant panel of gene features, will provide a biological resource for future ccRCC investigation, allow better prognostication of ccRCC, and supply a wealth of information for therapeutic decisions.
Results
Identification of ccRCC subtypes
Gene expression data were obtained for 48 ccRCC samples and 3 independent replicate sample preparations. A flowchart diagram depicting the analyses performed is presented in Figure 1.
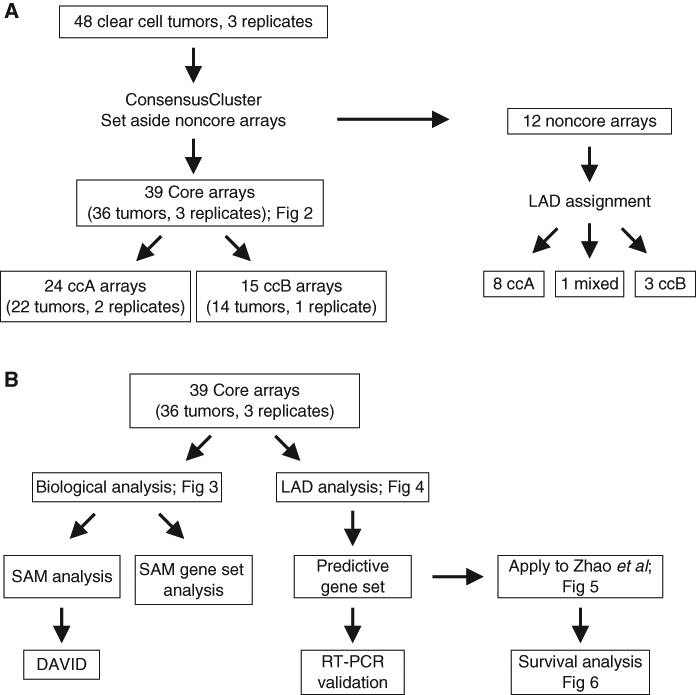
Flowchart diagram depicts the order of analyses. (
First, we performed ConsensusCluster, an unsupervised ensemble clustering algorithm, on the ccRCC samples (Supplementary Table S1), yielding two subsets, designated ccA and ccB (Fig. 2A). Removing the independent replicates produced an identical clustering assignment of tumors (data not shown), further confirming the stability of these clusters. Neither cluster was caused by inclusion of normal tissue in the RNA extraction as normal kidney assorts independently of either cluster (Supplementary Fig. S2).
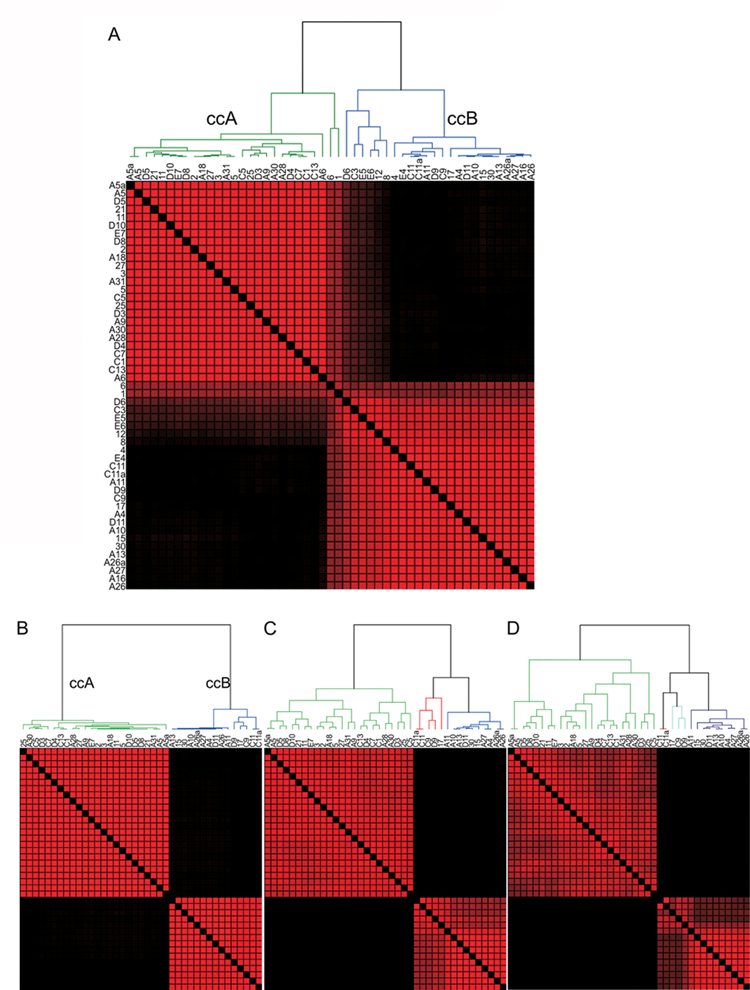
Consensus matrixes demonstrate the presence of only two core clusters of clear cell renal cell carcinoma (ccRCC). Consensus matrix heat maps demonstrate the presence of two clusters within all clear cell tumors (
Representative samples within each cluster were used for the development of characteristic gene signatures and the decipherment of biological pathways. Samples whose membership shifted through multiple bootstrapped iterations were set aside for later classification. These “core” clusters included 39 of the original 51 samples and permitted tumors with best-patterned features to define the cluster. As Figure 2B shows, the core cluster samples split into two robust subtypes of ccRCC that are stable when k (degrees of freedom) increases to k = 3 or k = 4 (Fig. 2 C and D), suggesting that the optimal number of robust clusters in this data set is 2. These analyses demonstrate that ccRCC can be optimally clustered into two distinct subtypes (ccA and ccB), defined purely by molecular characteristics of the tumors.
Analysis of pathway differences between two core clusters
The identification of subtypes provides an opportunity to identify biological differences within the spectrum of ccRCC. SAM (Significance Analysis of Microarrays) analysis identified 2,701 and 3,512 probes overexpressed in ccA and ccB, respectively (Fig. 3A and Supplementary Table S3). This result confirms the gene expression profile heterogeneity observed in previous studies. 17-19,21 The functional classification program, DAVID, was used to functionally categorize the probes identified in our analysis. A demonstration of the gene ontologies and pathways found to be differentially regulated between ccA and ccB tumors is provided in supplementary material (Supplementary Table S3). In addition, SAM Gene Set Analysis, a more statistically robust way of identifying correlated gene groups, was performed using curated gene sets, providing similar results (Supplementary Table S4). The most notable genes, gene sets, and gene ontologies associated with cluster ccA were involved in angiogenesis (Fig. 3B), the beta-oxidation pathway (Fig. 3C), organic acid metabolism, fatty acid metabolism (Fig. 3D), and pyruvate metabolism. In contrast, core cluster ccB tumors overexpressed genes associated with cell differentiation, epithelial to mesenchymal transition (EMT) (Fig. 3E), the mitotic cell cycle, transforming growth factor beta (TGFβ; Fig. 3F), response to wounding, and Wnt targets (Fig. 3G).
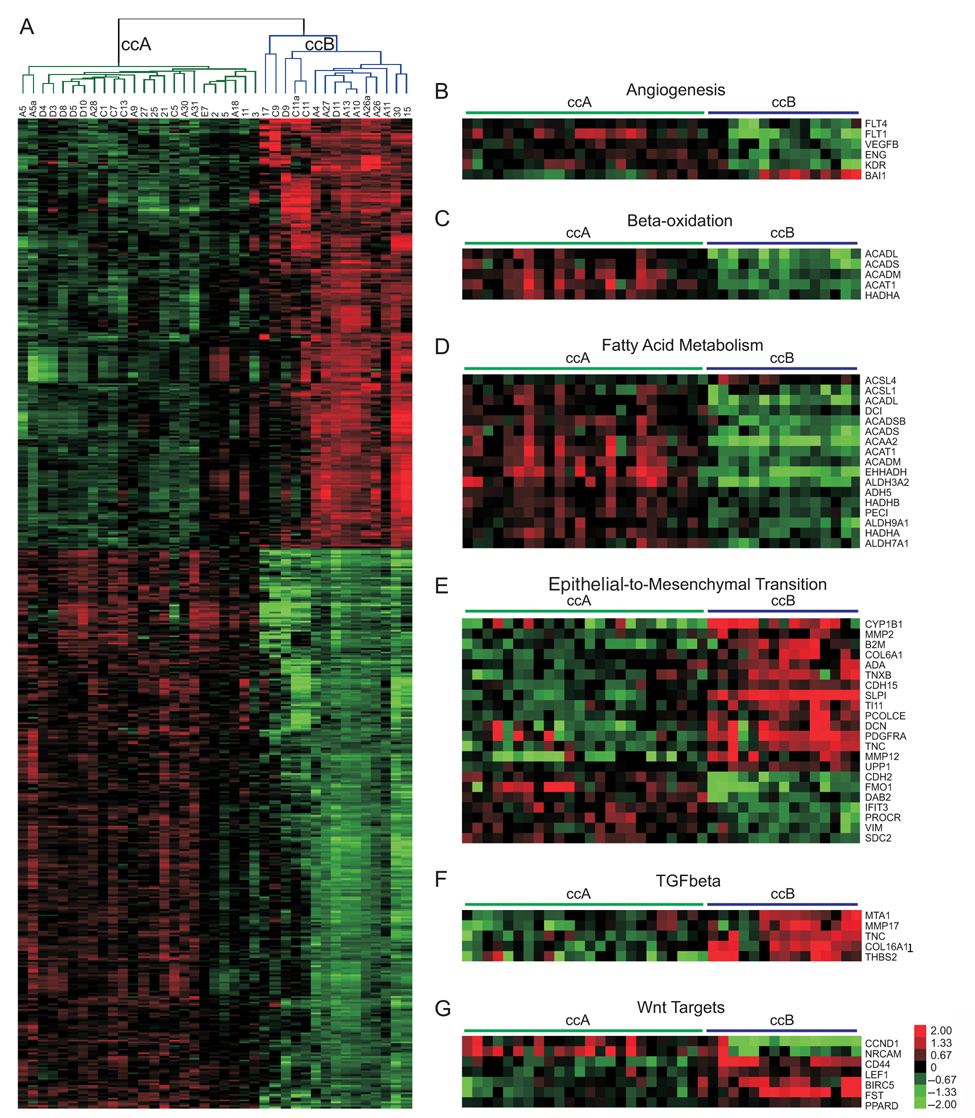
Pathway analysis of subtypes shows that ccA and ccB are highly dissimilar. (
Delineation of a gene set to stratify ccRCC into ccA and ccB
To identify a feature panel that could accurately identify ccA and ccB tumors, we used LAD, which uses pattern recognition and supervised learning to identify key discriminating elements and has been successfully implemented in several biomedical studies. 13,14,22 Using the core ccA and ccB tumors, LAD patterns were identified and validated. Using these patterns, we identified 120 probes, consisting of 110 genes, valuable for cluster assignment (Fig. 4A, Table 1, and Supplementary Table S5). The LAD model (Supplementary Table S6) was applied to the 12 noncore samples from the original analysis and predicted cluster membership for 11 samples, 8 ccA and 3 ccB (Supplementary Table S7).
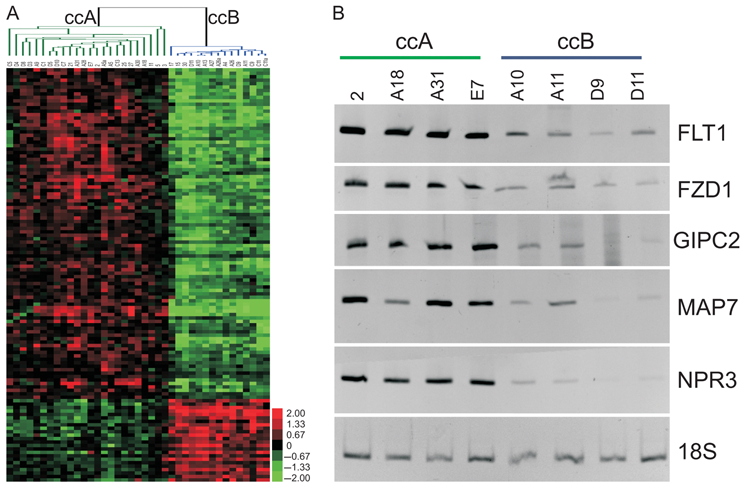
Logical analysis of data (LAD) probes separate ccA and ccB tumor clusters. (
Logical Analysis of Data (LAD) Gene Set
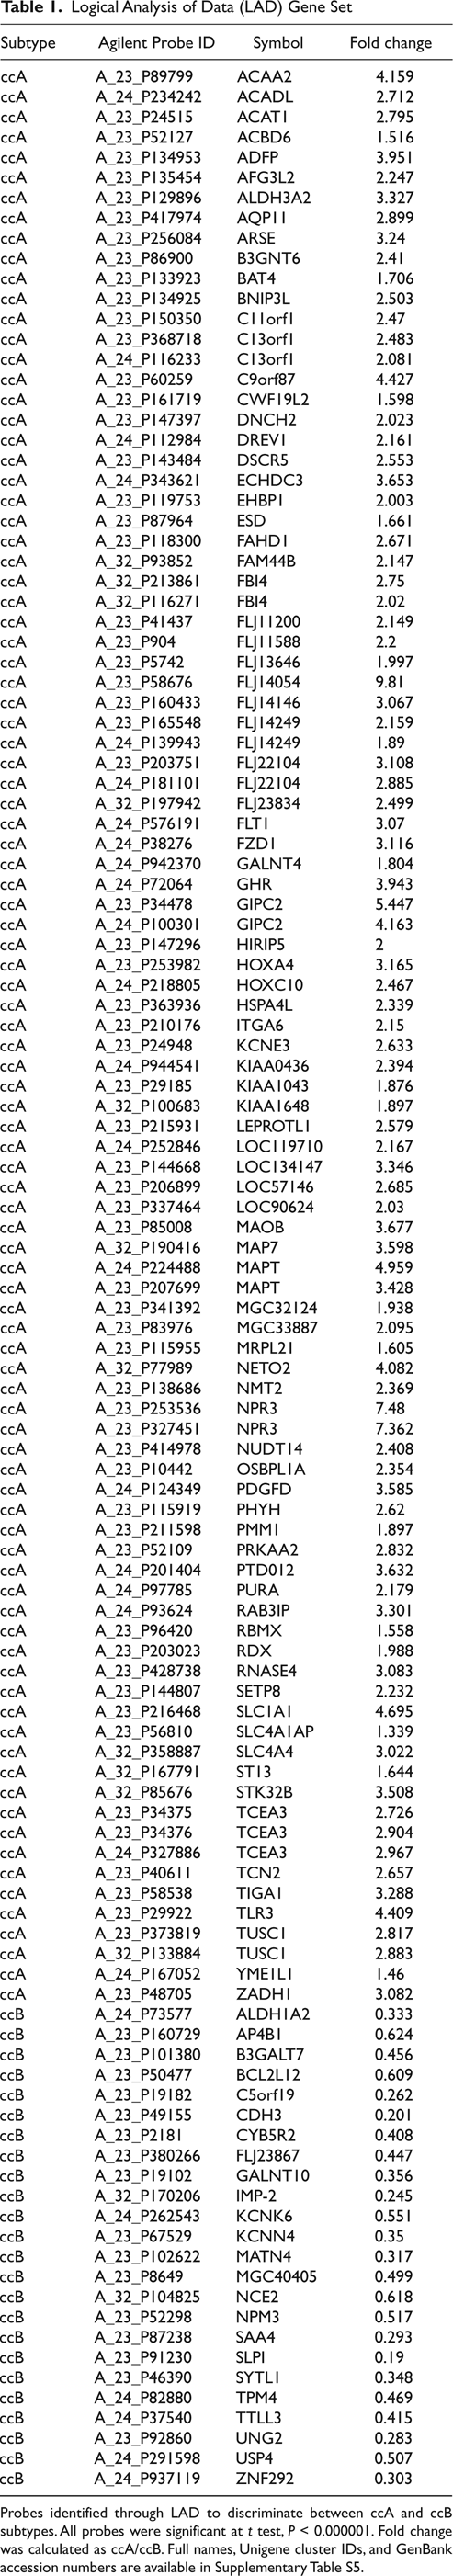
Probes identified through LAD to discriminate between ccA and ccB subtypes. All probes were significant at t test, P < 0.000001. Fold change was calculated as ccA/ccB. Full names, Unigene cluster IDs, and GenBank accession numbers are available in Supplementary Table S5.
To confirm that the genes identified by LAD are differentially expressed ccA and ccB ccRCC subtypes within individual tumors, we tested primers for ccA overexpressed genes FLT1, FZD1, GIPC2, MAP7, and NPR3 on available tumor samples using semi-quantitative RT-PCR. Figure 4B demonstrates that each of these products can predict tumor classification for individual tumors. These results collectively indicate the potential for a limited gene set to correctly distinguish between the two ccRCC subtypes using RT-PCR, a platform immediately transferable to formalin-fixed, paraffin-embedded tissues.
Validation of ccRCC subtypes
To validate the presence of two ccRCC subtypes in a second, independent data set, we applied ConsensusCluster and the LAD probe set to 177 ccRCC microarrays generated using a different gene expression profiling technique. 17 Figure 5 shows the same two strong clusters in the data, which remained stable when k was increased (data not shown). The clusters were assigned to ccA or ccB by comparison of gene expression patterns to those in the primary data set.
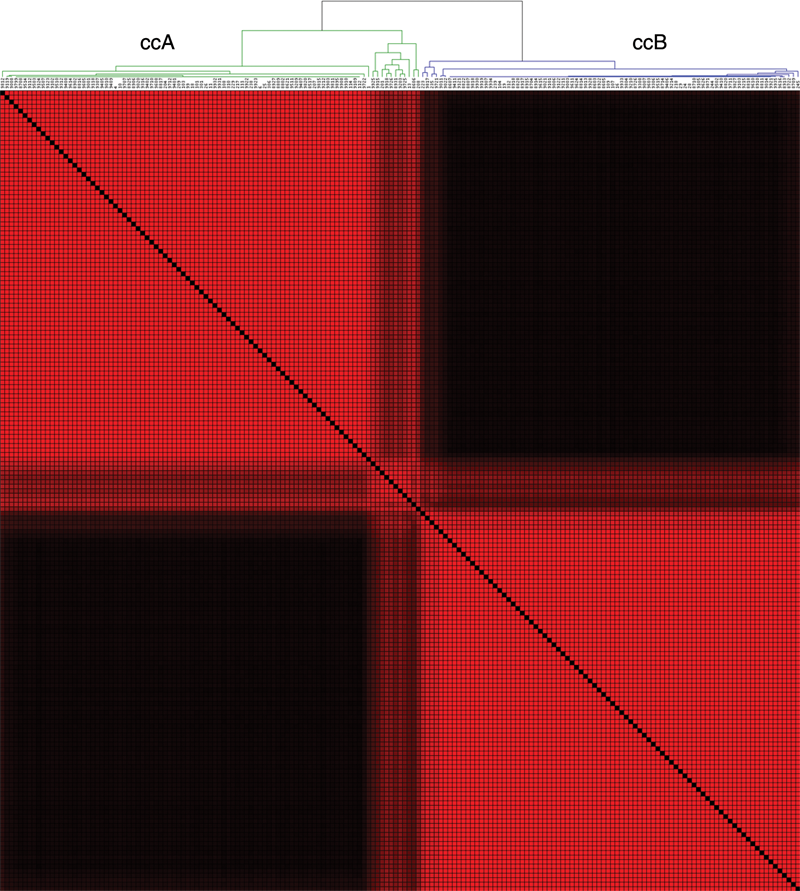
Validation of logical analysis of data (LAD) probes in the validation data set show the existence of two clear cell renal cell carcinoma (ccRCC) clusters. Consensus matrix of 177 ccRCC tumors determined by 111 probes corresponding to the 120 LAD probes. Red areas identify samples clustered together across the bootstrap analysis. Two distinct clusters are visible, validating the ability of the LAD probe set to classify ccRCC tumors into ccA or ccB subtypes from other array platforms.
Assignment of individual tumors
Assignment of tumors to a subtype with Cluster3.0 (traditional heat maps) or ConsensusCluster requires the presence of other tumors. Therefore, we used LAD score to separately assign each individual tumor in the validation data set to ccA or ccB, without assessing similarity to the rest of the tumors. Assignment was predicted for each sample 100 times with 80% pattern bootstrapping. A tumor was classified only if the assignment occurred in >75% of the prediction runs. Of the 177 ccRCC tumors, 83 were predicted to be ccA, 60 as ccB, and 34 remained unclassified with these stringent classification rules (Supplementary Table S8). When compared with the cluster assignment predicted by ConsensusCluster, we found a concordance of over 86%, thus validating LAD-predicted assignment as a sensitive measure of tumor assignment.
VHL pathway analysis
With the ability to assign individual tumors to ccA or ccB, we were able to further investigate an intriguing aspect of our pathway analysis. We had found that several of the pathways overexpressed in ccA tumors are typically considered as being perturbed in ccRCC (i.e., angiogenesis is considered a defining feature of ccRCC). A number of genes (e.g., EPAS1, EGLN3, PDGFC, HIG2, and CA9) tightly correlated with aspects of VHL inactivation and hypoxia inducible factor (HIF) signaling were found to be overexpressed in ccA relative to ccB.
We applied LAD analysis to our previously published data set 23 that was well annotated for VHL inactivation. Of the 21 tumors, 10 were predicted to be ccA, 6 as ccB, and 5 as unclassified (Supplementary Table S9). In each category, there were VHL wild-type tumors, HIF1 and HIF2 overexpressing tumors, and HIF2-only overexpressing tumors. Our own analysis of VHL status also demonstrated the presence of VHL mutations and/or methylation in both the ccA and ccB clusters (Supplementary Table S1). These data suggest that ccA and ccB, despite having a similar frequency of VHL inactivation, have activation of different dominant biologic pathways, resulting in distinct patterns of gene expression.
ccA and ccB have different survival outcomes
Given that VHL is inactivated in tumors of both subtypes, we wanted to know whether the underlying differences in tumor biology would show survival differences. Cancer-specific survival and overall survival for the ccA and ccB classes from the 177 tumor validation set were plotted using Kaplan-Meier curves (Fig. 6 A and B), calculating 95% confidence intervals (Supplementary Table S10). For cancer-specific survival (Fig. 6A), the ccA subtype was associated with a highly significant survival advantage over ccB patients (P = 0.0002, median survival of 8.6 vs 2 years). At 5 years, cancer-specific survival was 56% in ccA patients and only 29% in ccB patients. Figure 6B shows the same trend for overall survival, with a significantly greater survival for ccA patients over ccB patients (P = 0.004, median survival of 4.9 vs 1.8 years). At 5 years, survival for ccA patients is 48% but only 23% for ccB patients.
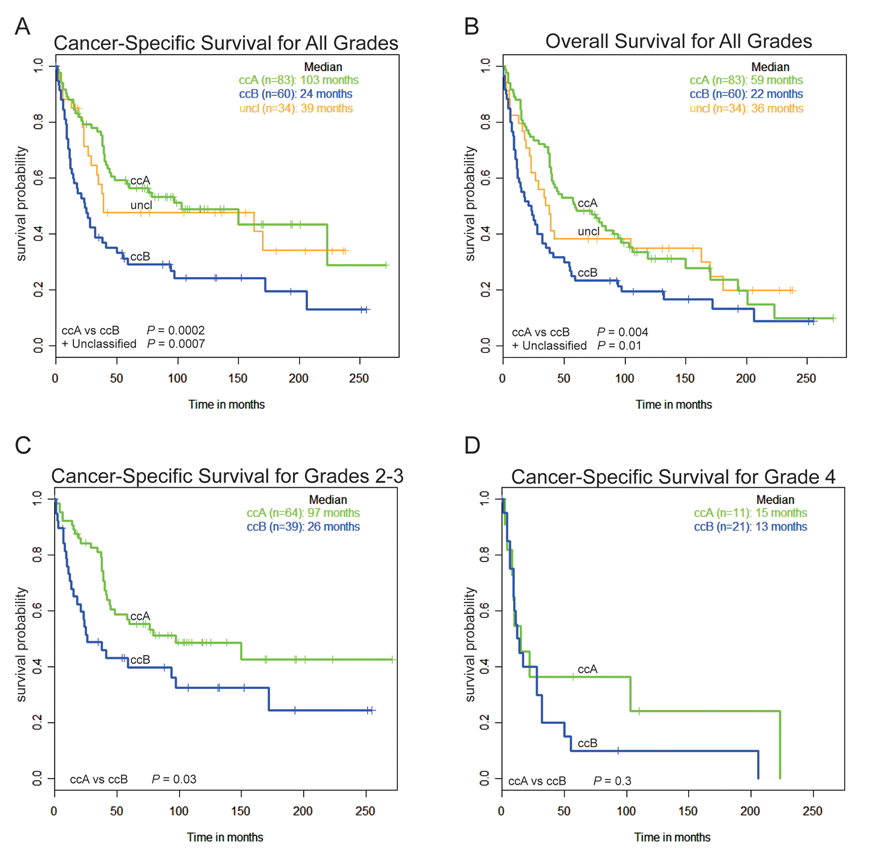
Classification of tumors from the validation data set by logical analysis of data (LAD) prediction shows that subtypes have differing survival outcomes. In total, 177 ccRCC tumors were individually assigned to ccA, ccB, or unclassified (uncl) by LAD prediction analysis, and cancer-specific survival (
ccA/ccB subtype associates with clinical variables
Fuhrman grade, tumor size (T stage), and performance status, the covariates in the UISS for predicting outcome in newly diagnosed patients, 5 were evaluated and compared with our molecular classification with regard to survival outcomes. As expected, molecular classification strongly associated with tumor stage (P = 0.009) and grade (P = 0.0007) but not performance status (P = 0.5684). Seventy-eight percent of grade 1 and 69% of stage 1 tumors clustered as ccA, while 65% of grade 4 and 58% of stage 4 tumors clustered as ccB tumors. As low-grade ccRCC tumors tend to have better prognosis and high-grade tumors poor prognosis, 4 this result was expected. This observation also suggests that the biological characteristics responsible for grade and stage-specific prognosis in ccRCC are encompassed in the classification schema. Figure 6C demonstrates that the ccA/ccB subtype still significantly correlates with survival when limiting analysis to intermediate-grade (grades 2-3) tumors. As expected, a Kaplan-Meier curve limited to the highly aggressive grade 4 tumors shows a convergence of subtype-specific survival (Fig. 6D).
Molecular classification is independently associated with survival
To determine how our classification schema compares with current standard clinical parameters as a prognostic factor, univariate Cox regression analyses were performed (Table 2). Molecular subtype is strongly associated with survival, with a hazard ratio (HR) of 2.2 (P = 0.0003). Even in the absence of stage 4 (metastatic) tumors, subtype has a strong association with survival (HR = 2.143, P = 0.0233). In addition, the use of the Schwartz Bayesian criterion (SBC) suggests 24 that whether the tumor is classified by ccA/ccB/unclassified, ccA/ccB, or LAD score, the measures are strongly associated with survival, with difference in adjusted SBC values of 8, 8.3, and 9, respectively. These results suggest that defining a tumor as ccA or ccB may be an important prognostic indicator for predicting outcome from patients with ccRCC.
Univariable Cox Regression Analysis for Disease-Specific Survival
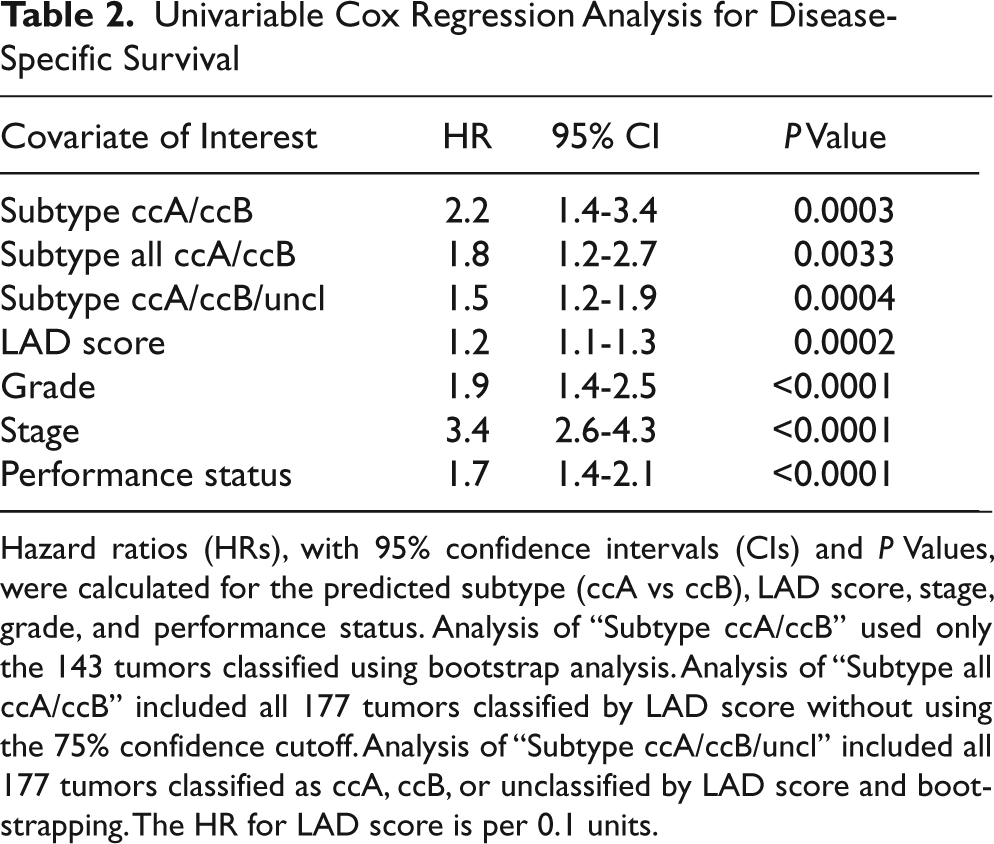
Hazard ratios (HRs), with 95% confidence intervals (CIs) and P Values, were calculated for the predicted subtype (ccA vs ccB), LAD score, stage, grade, and performance status. Analysis of “Subtype ccA/ccB” used only the 143 tumors classified using bootstrap analysis. Analysis of “Subtype all ccA/ccB” included all 177 tumors classified by LAD score without using the 75% confidence cutoff. Analysis of “Subtype ccA/ccB/uncl” included all 177 tumors classified as ccA, ccB, or unclassified by LAD score and bootstrapping. The HR for LAD score is per 0.1 units.
Multivariate analyses were then performed to determine whether our classification schema was still independently associated with survival outcomes in the context of stage, grade, and performance status. The dichotomous classification of ccA/ccB provides a significant association with survival at the 0.1 level (P = 0.089), likely influenced by the smaller sample size of the 143 classified tumors. Increasing sample size to 177 by including unclassified tumors, the trichotomous classification increased significance to P = 0.0736. Statistical analyses often show that continuous variables provide more statistical discrimination. In fact, LAD score is an independent predictor of survival (P = 0.0027) and is more predictive of outcome than Fuhrman grade (P = 0.0308). These data intimate that the classification schema presented in this article may provide independent prognostic information over and above that provided by standard clinical parameters.
Discussion
Unsupervised consensus clustering algorithms can identify distinct classifications of histologically similar tumors based on machine learning algorithms. In this analysis, a small gene set distinguishes two inherent molecular subtypes of ccRCC (ccA and ccB), characterized by divergent biological pathways and a highly significant association with survival outcomes. This unique analysis provides a powerful method to discriminate molecular subgroups of tumors that may be informative of tumor biology or influence tumor behavior.
A fundamental problem in gene expression analysis of human tumors is the measurement of genetic noise in pairwise comparisons across thousands of independent and dependent variables. Our combined use of principal component analysis (PCA), consensus clustering, and LAD is robust and, more important, identifies stable clusters within patterns of gene expression. This method is highly reproducible and able to classify samples into molecular and clinically meaningful categories. Within these categories, “core clusters” are sets of nonoverlapping samples that are distinguishable from each other with high accuracy. This method of tumor analysis permits a refined assignment into gene expression-defined classifications and yields predictive gene signatures based on a manageable sized number of gene features. These properties permit the identification of limited sets of highly predictive molecular features (i.e., genes) useful for the classification of individual samples outside of the primary analysis. The extension of biomarker molecular profiles to small groups of genes, which can assign classification to individual tumors, is a major step forward toward the development of a clinically relevant biomarker. Ultimately, such a classification scheme will be applied with such measures as quantitative RT-PCR.
The clinical heterogeneity of ccRCC, coupled with previous gene expression studies, 16,18,19,23 suggests that at least two molecular subtypes of ccRCC exist. We demonstrated that there are likely only two primary subtypes of ccRCC stable under bootstrap analysis, although further subclassifications within these subtypes may be identified in much larger data sets, and rare tumors may represent unusual variants. Using the LAD predictions in the validation set, a third group of tumors shared pattern features with both ccA and ccB tumors. Such a third group, or other suggested classifications, may represent an intermediate manifestation of tumors undergoing progression from ccA to the ccB subtype or simply share common characteristics of both groups.
The subtypes ccA and ccB were associated with a significant difference in survival outcome, with ccA patients having a markedly better prognosis. While the continuous variable of LAD score proved to be an independent predictor of survival, the more immediately clinically useful dichotomous classification of ccA or ccB had a similar effect size and was statistically significant at the P = 0.1 level in the multivariable analysis. Future studies on larger numbers of patients are needed to validate the results of the preliminary multivariate analysis reported herein.
Pathway analysis showed that the better prognosis ccA group relatively overexpressed genes associated with hypoxia, angiogenesis, fatty acid metabolism, and organic acid metabolism, whereas ccB tumors overexpressed a more aggressive panel of genes that regulate EMT, the cell cycle, and wound healing. Intriguingly, ccA overexpresses genes associated with components of hypoxia and angiogenesis pathways, processes known to be broadly dysregulated in ccRCC. VHL inactivation and subsequent activation of the hypoxia response pathway is so highly correlated with ccRCC that many of these pathways are expected to be upregulated in virtually all ccRCC tumors. As expected, using both training set tumors and LAD assigned gene expression arrays from Gordan et al., 23 we identified VHL inactivation in both clusters. Thus, ccB may have acquired additional genetic events that supplement VHL pathway events, contributing to a more biologically immature and aggressive phenotype that overwhelms the signature associated with VHL inactivation, which should be evaluated in future studies. In addition, it will be interesting in the future to determine if the key features that make up this classification are unique to ccRCC or if other histologic subtypes share the features of either the ccA or ccB classifications.
Finally, our small, robust panel of genes, whose expression levels can classify individual tumor samples into ccA and ccB subtypes with high accuracy, may provide a valuable resource for clinical decisions for patients following nephrectomy regarding frequency of surveillance or choices for adjuvant therapy in the future. This panel provides the basis for the development and validation by a prospective clinical trial to assign subtypes of ccRCC to individual tumor specimens for implementation in a prognostic algorithm.
Materials and Methods
Complete materials and methods can be found in the online supplementary material (Supplementary Data S11).
Samples
Fifty-one specimens from 48 ccRCC patients were collected from consenting patients undergoing nephrectomy for RCC from 1994 to 2008 (Supplementary Table S1), analyzed for quality, flash frozen, and accessed with appropriate institutional review board (IRB) approvals. The validation set of 177 cases was described previously. 17 Survival data were updated with a median follow-up of 120 months (range, 66-271). The pVHL and HIF annotated data set was previously described. 23
Gene expression analysis
RNA was extracted using the Qiagen RNeasy kit (Valencia, CA), amplified, labeled, and hybridized against a reference 9 on Agilent Whole Human Genome (4 × 44k) Oligo Microarrays. Expression data were tabulated, and missing data were imputed. Batches were combined using Distance Weighted Discrimination (DWD; https://cabig.nci.nih.gov/tools/DWD) and normalized. Data are posted on GEO (GSE16449). Gene expression data from the validation set were collected, 17 GEO (GSE3538). Print runs were DWD combined and normalized. Gene expression data from the pVHL/HIF data set 23 were posted on GEO (GSE11904).
Pathway analysis
Heat maps were generated using Cluster 3.0 (http://bonsai.ims.u-tokyo.ac.jp/~mdehoon/software/cluster/) and Java Treeview (http://jtreeviewsourceforge.net/). Genes were functionally annotated in DAVID (http://david.abcc.ncifcrf.gov/). SAM-GSA (http://www-stat.stanford.edu/~tibs/SAM/) was performed using MSigDB curated gene sets (http://www.broad.mit.edu/gsea/msigdb/).
PCA
ConsensusCluster 25 (http://code.google.com/p/sensus-cluster/) was used for PCA 26,27 and consensus clustering. 12 Features whose coefficients were in the top |25%| were selected from PCA eigenvectors representing 85% variation in the data, retaining 20 eigenvectors and 281 features.
Unsupervised consensus ensemble clustering
Consensus clustering was applied to PCA features to divide the data successively into k = 2, 3, 4 . . . clusters, with 80% bootstrapping of 300 subsamples of genes and/or samples. We applied two clustering techniques, K-Means 28 and Self-Organizing Map. 29
LAD
Features mapped to genes that discriminate between the two subtypes (t test, P < 0.000001) were retained. We then applied LAD 30,31 (http://pit.kamick.free.fr/lemaire/software-lad.html). LAD patterns requiring only one gene for perfect discrimination were generated. LAD was reapplied to identify patterns of degree 1 and degree 2 (homogeneity and prevalence = 0.9). A classifier C S = f P – f N assigned an unknown sample to a class, where f N /f P is the fraction of negative/positive patterns satisfied. If the LAD score (C S ) was negative/positive, the sample was predicted to class ccA/ccB, respectively.
Semi-quantitative RT-PCR
RNA from patient tumors (chosen by RNA or tumor availability) was reverse transcribed primarily using RNA extracted from a second sample of tumor. cDNA was amplified by 25 cycles of semi- quantitative PCR with primer sets for FLT1, FZD1, GIPC2, MAP7, NPR3 (http://www.idtdna.com/), or control 18S rRNA primers (Applied Biosystems, Foster City, CA). Full-sized gels are shown in Supplementary Figure S12.
VHL sequence and methylation analysis
DNA was extracted from tumor samples using proteinase K (Roche, Basel, Switzerland) and standard phenol/chloroform extraction. VHL exons were PCR-amplified and directly sequenced for mutations with a BigDye Terminator Cycle kit on a 3130xl sequencer (Applied Biosystems). Primers and protocols used were described previously. 32 A CpG Wiz kit (Chemicon, Temecula, CA) and/or NotI digestion was used for methylation studies. 33
Statistical methods
Statistical analyses were performed using R v2.4.1 (http://www.r-project.org), SAS (SAS Institute, Cary, NC), or STATA (StataCorp, College Station, TX). Kaplan-Meier estimated the time-to-event functions of disease-specific and overall survival. Disease-specific or overall survival was time between nephrectomy to date of death due to disease or date of death, respectively. Log-rank test was used to test for differences between survival curves. Univariable logistic regression evaluated the association of covariates on the outcome probability of subtype ccA versus ccB. Univariable and multivariable Cox regression evaluated the association of individual and multiple covariates on disease-specific and overall survival. SBC 24 assessed model fit.
Footnotes
Acknowledgements
Thanks to Leslie Kennedy and D. Micah Childress for technical assistance; to Perou lab members Katie Hoadley, Aaron Thorner, and Joel Parker for analysis suggestions; and to Tricia Wright for critical reading.
The authors declared no potential conflicts of interest with respect to the authorship and/or publication of this article.
The work of GB was supported in part by the National Science Foundation Grant No. PHY05-51164 and the New Jersey Commission on Cancer Research Grant 09-112-CCR-E0. SG received support from the Sidney Kimmel Foundation and NJCCR. WKR received support from the Lineberger Comprehensive Cancer Center, the Doris Duke Charitable Fund, and the Crawford Fund for kidney cancer research. ARB was supported by the UNC Cancer Cell Biology Training Grant. The UNC Tissue Procurement Facility and Genomics Core are supported by the Lineberger Comprehensive Cancer Center.
References
Supplementary Material
Please find the following supplemental material available below.
For Open Access articles published under a Creative Commons License, all supplemental material carries the same license as the article it is associated with.
For non-Open Access articles published, all supplemental material carries a non-exclusive license, and permission requests for re-use of supplemental material or any part of supplemental material shall be sent directly to the copyright owner as specified in the copyright notice associated with the article.