
Abstract
The goal of this study was to discover a minimally invasive pathway-specific biomarker that is immune to normal cell mRNA contamination for diagnosing head and neck squamous cell carcinoma (HNSCC). Using Elsevier's MedScan natural language processing component of the Pathway Studio software and the TRANSFAC database, we produced a curated set of genes regulated by the signaling networks driving the development of HNSCC. The network and its gene targets provided prior probabilities for gene expression, which guided our CoGAPS matrix factorization algorithm to isolate patterns related to HNSCC signaling activity from a microarray-based study. Using patterns that distinguished normal from tumor samples, we identified a reduced set of genes to analyze with Top Scoring Pair in order to produce a potential biomarker for HNSCC. Our proposed biomarker comprises targets of the transcription factor (TF) HIF1A and the FOXO family of TFs coupled with genes that show remarkable stability across all normal tissues. Based on validation with novel data from The Cancer Genome Atlas (TCGA), measured by RNAseq, and bootstrap sampling, the biomarker for normal vs. tumor has an accuracy of 0.77, a Matthews correlation coefficient of 0.54, and an area under the curve (AUC) of 0.82.
Introduction
Genome-wide gene expression data are now typically available in many cancer studies. The six hallmarks of cancer, sustaining proliferative signaling, evading growth suppressors, resisting cell death, enabling replicative immortality, inducing angiogenesis, and activating invasion and metastasis, all result from genetic and epigenetic changes and drive changes in gene expression. 1 These hallmarks are the defining features of cancer and are required for tumorigenesis. While the natural way to identify cancer is through invasive capture of tumor cells coupled with genetic and cytologic analysis, this obviously requires previous identification of cancer. In this study, we focus on leveraging gene expression changes driven by cancer-type-specific pathways to identify biomarkers that may lead to minimally invasive detection of cancer.
The vast amounts of data generated through microarrays and sequencing technologies create many challenges for analysis. We had earlier shown the value of matrix factorization techniques to isolate the signatures of pathway activity in the presence of overlapping gene regulation. 2 Nonnegative matrix factorization (NMF) has also been shown to be advantageous over other clustering methods for identifying cancer subclasses. 3 Here, we apply the Bayesian NMF algorithm CoGAPS 4 to isolate the underlying processes of head and neck squamous cell carcinoma (HNSCC).
HNSCC is typically caused by tobacco and alcohol use or by human papillomavirus (HPV). HNSCC is the sixth leading cancer by incidence worldwide, and it is estimated that only 40–50% of patients with HNSCC will survive for five years with the disease, likely due to failure to detect the disease at early stages. 5 Therefore, early diagnosis using a robust biomarker could substantially improve the treatment of patients with HNSCC.
Mapping the signaling networks of interest for the cancer under study is an integral part of our approach. Figure 1 displays the protein signaling network involved in HNSCC, which was constructed based on two reviews by experts in the field.6,7 The root nodes (IGF-1R, VEGFR, EGFR, and cMet) are receptor tyrosine kinases, which, when activated, drive signaling cascades that lead to the activation or repression of transcription factors (TFs). In individual patients, several different mutations or epigenetic changes have been identified that can change signal propagation in this network. Therefore, copy number and epigenetic measurements on individual patients can provide prior probabilities of TF activity. CoGAPS permits encoding of this information as prior probabilities of the expression of target genes of the TFs.

Diagram of the signaling network involved in HNSCC. The root nodes (octagons) of this diagram represent the receptors that are activated and then drive the rest of the network. The leaf nodes (circles) represent the TFs that activate a large number of genes involved in HNSCC. A pointed arrow represents activation of the target and a T represents repression of the target. Rounded rectangles represent signaling proteins.
Biomarkers provide an easily measured indicator of hidden biological processes of interest, and the identification of biomarkers has proven to be essential for disease diagnosis and for determining the treatment strategies for cancer.
8
Our goal is to identify mRNA biomarkers related to specific deregulated signaling known to drive cancer development. Here, we utilize CoGAPS to isolate patterns associated with HNSCC and Top Scoring Pair (TSP) to generate biomarkers robust to normalization artifacts.
9
The advantage of TSP lies in the inclusion of internal controls by looking only at relative expression between two genes. Unlike the sets of genes that tend to rely on relative levels, TSP relies only on ranks. A marker solely based on rank with the same number of genes may be equally effective, but the threshold would be harder to implement because
Methods
Summary
The overall analysis plan is summarized in Figure 2. Multiple molecular data types are downloaded and, if not preprocessed by the provider, processed to create properly normalized data sets. Expression data are filtered based on the known targets of TFs in the network, while other data (ie, mutation, copy number, methylation) are filtered to include only network members. The nonexpression data provide prior relative probabilities of the activity of different proteins in the signaling network, and these prior probabilities are propagated through a graphical model to a probability of the expression of the TF targets. The expression data are then analyzed with these prior relative probabilities using CoGAPS. The results of analysis include patterns that are reviewed for association with tumor status. Patterns with such an association are then analyzed for significance of TF activity, and targets of these TFs are captured. The TSP algorithm is run on these genes and the reference gene list to identify biomarkers with one gene from the targets of significantly active TFs and one gene from the stable reference gene list.

The overall analysis path for the creation of robust biomarkers. The diagram shows the plan from initial data gathering to biomarker identification and is described in detail in the text.
Data
The HNSCC data used as a training set for this study were from a public domain data set generated at Johns Hopkins University, containing microarray expression, promoter methylation, and copy number data (Gene Expression Omnibus (GEO) accession: GSE33232), from 44 subjects with HNSCC tumors (HPV+ 13, HPV– 31) and from 25 subjects from uvulopalatopharyngoplasty surgery. The normal samples were taken from different individuals to avoid any contamination due to field cancerization, which can lead to nonlocalized premalignant transformation of tissues in the head and neck area. The expression data were normalized using RMA, 10 copy number data were summarized using CRLMM, 11 and methylation data were normalized based on their natural beta distribution.
For validation, level 3 data from TCGA, comprising 515 tumor samples with 44 normal samples, were downloaded on November 17, 2015. 12 The measurements for the genes in the biomarker were extracted from the complete gene-level summaries.
Pathway Curation
In order to encode prior information from methylation and copy number measurements on signaling proteins, the model of the signaling network shown in Figure 1 is used. The network drives transcriptional changes through the TFs, so the final link to expression is to identify the targets of the TFs (shown as circles in Fig. 1). The identification of TF targets was done using the TRANSFAC database 13 and Elsevier's MedScan software, which is part of the Pathway Studio tool.
For the TFs ELK1, the FOXO family, and MYC, targets were curated by identifying the abstracts of papers with MedScan, as the TRANSFAC data were limited. All identified abstracts were manually reviewed to classify the TF-target interaction, confirm a direct regulatory relationship, and thus complete the link from signaling pathway to transcripts. For other TFs in the network, TRANSFAC was used exclusively.
Determining Priors for Expression Analysis
In order to set priors on the potential expression of genes that are targets of HNSCC network shown in Figure 1, information on protein activity is needed. For this, an outlier analysis was performed on the methylation and copy number data. Outliers were counted for the hypomethylation of promoters or amplification of genes that coded signaling proteins. A rank outlier method was used,
14
where an outlier for a gene was defined such that the methylation of a tumor was below the normal by at least 0.1 or the copy number of the tumor was above the normal by at least 0.5. For each gene, this resulted in a count, C, for each tumor capturing how many normals it exceeded in methylation and copy number. We converted this to an empirical
The network of Figure 1 was then propagated with these values to the TFs as follows. For receptors and other root nodes with no parents, the relative probability of activity was set equal to the value. For any node 
where ppa(
where ppr(
Finally, the relative probability of a TF being active was then used as the prior relative probability of a target being expressed. The implementation of the prior scaled all values to have equal overall prior probability assigned to each pattern, so these values effectively just set the relative probability within one pattern (one column of the
Analysis of Gene Expression Data with CoGAPS
CoGAPS is an NMF algorithm that utilizes Bayesian statistics and Markov Chain Monte Carlo (MCMC) sampling. NMF works to factor a data matrix, 
where
Estimation of the dimensionality of the data (or the number of factors needed to recover the data within the noise) is an outstanding problem in all analyses of expression data, including clustering methods, principal component analysis (PCA), and NMF. To determine the best dimensionality, we reviewed the patterns generated for the separation of HPV+, HPV-, and normal samples. As the final goal of this study is a validated biomarker unrelated to the CoGAPS factorization, the exact dimensionality determined may not be critical so long as the signaling processes are successfully identified, thus providing a biomarker that withstands validation.
Estimating TF Activity
The patterns generated by CoGAPS were analyzed to infer TF activity using a
TSP and Biomarker Discovery
In order to identify biomarkers robust to normalization, we applied the TSP algorithm. 9 TSP finds pairs of genes chosen by how well the statistic can distinguish the two classes based on the inversion of the relative values between the classes. One limitation of TSP is that it searches all possible gene pairs, which can produce pairs driven by noise, because there are many more gene pairs than samples. We avoided this limitation by limiting the genes being input into TSP.
To limit the TSPs to genes expected to change expression due to HNSCC signaling by HNSCC, we only included curated targets of the TFs in the pathways of interest for HNSCC (Fig. 1). While TFs will not themselves generally show expression changes, their targets should change expression based on the TF activity changes driven by the signaling pathways. Because the patterns from CoGAPS are correlated with disease status, strong TF activity in a pattern determined by the TF
To make the TSPs robust to tissue contamination, we also required each TSP to include one gene related to HNSCC signaling and one gene from a reference gene list. The reference gene list was generated by gathering all normal tissues measured on the U133plus2 Affymetrix array and deposited in GEO. All genes with medium expression levels in all samples (log2 expression as determined by frozen RMA 17 of 5–7) were ranked for low variance. The genes with the least variance were retained for inclusion in TSPs. The R package switchBox was used for the TSP analysis, 18 which yielded a biomarker composed of five paired genes with one gene from the target list and one gene from the reference list.
Validation
Fivefold cross validation was performed on our original data set to determine the error rate of our model at predicting the tumor status of a patient. The biomarker was then tested on the TCGA data set.
Results
The pathway curation allowed us to produce a list of targets for the TFs of interest for HNSCC. Targets of the terminal TFs in the network were first identified in TRANSFAC. For TFs with limited information, further curation was done with MedScan. Targets for ELK1, FOXO1, FOXO2, FOXO3, FOXO4, and MYC were extended with MedScan, and all targets were integrated into the network shown in Figure 1 as leaf nodes. The combined list of FOXO family targets was taken as targets of FOXO in the network.
Using methylation and copy number measurements for the members of the signaling network shown in Figure 1, an outlier analysis generated a ranking of each pathway member by the total number of hypomethylated promoters and gene amplifications. The range of values was linearly scaled to a range from 0.9 for the most outliers to 0.5 for the fewest. These values were propagated through the network shown in Figure 1 as detailed in Methods section, and the relative probabilities for the TFs were taken as prior relative probabilities of the expression of their targets. These provided a modified probability of a gene being associated with the first pattern in the matrix factorization. There was no effect on the other patterns, which retain flat priors across all genes.
CoGAPS was run seeking three to nine patterns. Six patterns provided the best factorization of the HNSCC data based on the visual separation of normal, HPV+, and HPV– groups.
This factorization produced two flat patterns and four patterns showing differing levels in the

Heat map showing hierarchical clustering of subject types across the patterns. The values in the heat map provide the level of association of a sample with a pattern. Class labels are presented in the top bar: HPV+ tumors (red), HPV- tumors (yellow), or normal tissue (green).
The four patterns with interpatient variation (Fig. 4) showed differing statistics for the TF activities. ELK1 showed low activity in tumor samples, while HIF1A, SP1, and FOXO all showed strong activity in HPV- tumor samples. MYC showed low activity in the HPV- and normal samples and some slight activation in the HPV+ samples. Overall, HIF1A and FOXO provided the strongest

Boxplots of the strength of each sample in the patterns related to disease status produced by running CoGAPS with the H NSCC network prior.
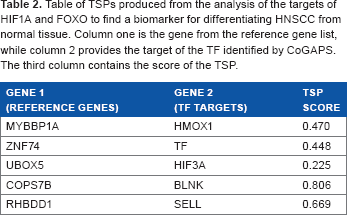
The TSP analysis of HIF1A and FOXO targets and reference genes (Table 1) produced five pairs of genes that could serve as a biomarker. These pairs are listed in Table 2. The genes HMOX1, TF, and HIF3A are the targets of HIF1A, and the genes BLNK and SELL are the targets of FOXO. The set of genes paired with these TF targets is from our reference gene list. Because the reference genes have stable expression throughout all subjects, using these TSPs as biomarkers will allow us to detect HNSCC even if a sample is contaminated with normal tissues.
The target genes of HIF1A and FOXO and the reference gene list from which the biomarker of Table 2 was developed.

Table of TSPs produced from the analysis of the targets of HIF1A and FOXO to find a biomarker for differentiating HNSCC from normal tissue. Column one is the gene from the reference gene list, while column 2 provides the target of the TF identified by CoGAPS. The third column contains the score of the TSP.
A receiver operator characteristic (ROC) analysis of the TSP-based tumor vs. normal biomarker was performed, and the sensitivity and specificity for a threshold of three votes from the five TSPs were 0.91 and 0.92, respectively. Figure 5A shows the full ROC curve for this model generated by changing the number of votes needed to generate a tumor call.

ROC curves for the results of the TSPs as predictors for cancer in the original data set (A) and in the TCGA data generated by bootstrapping (B). Six thresholds (0–5) for the number of votes required to determine the case vs. control were used for producing these plots.
The fivefold cross validation of the biomarker for tumor vs. normal generated an error rate of 28.5%. We applied the biomarker to predict the cancer status in the TCGA data. We obtained a sensitivity of 0.855, a specificity of 0.674, an accuracy of 0.773, and an MCC of 0.54 using the biomarker on the TCGA data. To address the issue that there were 515 tumor samples but only 44 normal samples in the TCGA data, we used a balanced bootstrap to estimate this result. We generated 100 bootstrap samples, comprising 44 normal samples and 44 tumor samples, and generated the measures from these samples. Then, we also generated an ROC curve for the measurements and estimated the AUC at 0.84. The ROC curve is shown in Figure 5B.
Discussion
HNSCC is a heterogeneous disease, which has contributed to a lack of accurate prognostication, treatment planning, and identification of pivotal genes as the cause of tumor growth. 5 It is possible to distinguish several subclasses of HNSCC through histological studies, and RNA and DNA profiling studies have helped to identify further subtypes of the disease. A thorough review of expression studies in HNSCC is provided in Ochs and Califano. 19 The current study aimed to provide an approach to generate robust, minimally invasive biomarkers that could be used to identify the presence of disease.
The overall poor prognosis of HNSCC, especially HPV-disease, has been linked to the lack of early detection. Therefore, the development of minimally invasive biomarkers could substantially improve prognosis. We tested our biomarker comprising five TSPs developed from a microarray-based study to the TCGA HNSCC data set, where RNAseq was used. Despite the change in measurement platform, the biomarker performed well with an accuracy of 77.3%, which reflects the design of the TSP method to use internal normalization through seeking a change in a relative expression of just two genes at a time.
This work provides the initial methodology of utilizing multiple biomolecular measurements for prior information on the signaling network, deduction of the key TFs related to the signaling activity, curation of the targets of the TFs as potential expression markers, use of a reference set of genes that are stably expressed in most normal tissues, and use of TSP to build a robust biomarker. Future studies will focus on adding the consideration of overall expression levels in tumors, so that we can refine the biomarker to one likely to find an adequate signal even in the case where the tumor sample is highly diluted relative to normal tissue, and on further curation of genes associated with specific TFs in the network. An ideal biomarker for other cancers would also be circulating in blood, allowing a noninvasive test. As such, seeking signaling-driven secreted proteins or stable miRs that show the same relative changes between tumors and normals would be desirable although of greater difficulty.
Author Contributions
Conceived and designed the experiments: MFO. Analyzed the data: JCS, MFO. Wrote the first draft of the manuscript: JCS. Contributed to the writing of the manuscript: MFO. Agreed with the manuscript results and conclusions: JCS, MR, RS, CK, DAG, EJF, JAC, MFO. Jointly developed the structure and arguments for the paper: EJF, MFO. Made critical revisions and approved the final version: MFO. All the authors reviewed and approved the final manuscript.
Supplementary File
The reduced data sets and their analysis are presented with the R script and Rda files in the supplementary material: Analysis_and_Data.zip.