
Abstract
Mutations in two major genes,
Keywords
Introduction
Breast cancer is the most common cancer in women in the western world, of which approximately five to ten percent of cases are of hereditary origin. Two major susceptibility genes,
Microarray studies have also shown that constitutional mutations in
With regard to healthy tissues, studies of fibroblasts cultured from breast
14
and skin biopsies
15
showed that irradiated cells from heterozygous
These different studies show that gene expression profiles associated with
The use of untreated PBMCs is relevant in light of the established links between DNA damage response, immunity and cancer. 19 Other studies have successfully used PBMCs to demonstrate that breast cancer affects gene expression patterns in peripheral blood cells during early stages of disease development. 20 Inter-individual variation observed in peripheral blood21–23 was shown to be minimal in comparison to that observed associated with various diseases and disorders21,23 such as cancer or infectious disease.
In the present study, we compared gene expression profiles in peripheral blood cells of
Materials and Methods
Case Selection Criteria
All samples were taken from members of high-risk breast cancer families ascertained through the Oncogenetic consultation at the Centre Jean Perrin. Individuals were asked to provide a blood sample and to sign an informed consent form approved by the CCPPRB regional ethics committee (Auvergne). Fifteen samples from patients with germline mutations of
RNA Isolation
Peripheral Blood Mononuclear Cells (PBMCs) were isolated on a density gradient. Briefly, 3 ml of Pancoll (PAN Biotech GmbH, Aidenbach, Germany) was added to a LeucoSep tube (Dutscher, Brumath, France) and centrifuged to position the porous LeucoSep membrane on the Pancoll surface. Approximately 6 ml of heparinized blood was poured onto the membrane, and the tubes were centrifuged at 1000 g for 10 min at room temperature. After centrifugation, the interface containing PBMCs was collected and washed twice with PBS (Invitrogen, Carlsbad, CA). Total RNA was extracted with TRIzol reagent (Invitrogen, Carlsbad, CA) according to the manufacturer's instructions. RNA quantity and quality were determined using the RNA 6000 Nano Assay kit on an Agilent 2100 BioAnalyzer (Agilent Technologies, Palo Alto, CA), as recommended. A commercial pool of total RNA (ref. 636580 BD Biosciences Clontech, Heidelberg, Germany) extracted from normal human peripheral leukocytes of 13 healthy male/female Caucasians was used as a reference RNA cohybridized with the test sample (carriers or controls) in each microarray.
cRNA Amplification and Labeling
Total RNA was amplified and labeled with Cyanine 5 for test samples (carriers and controls) and with Cyanine 3 for the reference using Agilent's Low RNA Input Linear Amplification Kit (Agilent Technologies, Palo Alto, CA) following the detailed protocol described in the kit manual (Manual Part Number G4140–90050 version 5.0.01). Briefly, 1 μg of total RNA was reversed transcribed to double-strand cDNA using a poly dT-T7 promoter primer. Primer, template RNA and quality-control transcripts of known concentration and quality were first denatured at 65 °C for 10 min and incubated for 2 hours at 40 °C with 5X first strand Buffer, 0.1 M DTT, 10 mM dNTP, MMLV RT, and RNase-out. The MMLV RT enzyme was inactivated at 65 °C for 15 min. cDNA products were then used as templates for
Sample Hybridization
For each hybridization, 825 ng of Cyanine 3 labeled cRNA (reference) and 825 ng of Cyanine 5 labeled cRNA (carriers or controls) were mixed, fragmented, and hybridized at 65 °C for 17 hours to an Agilent 44 K Whole Human genome Oligo Microarray containing 45,015 features representing 41,000 unique probes. After washing, microarrays were scanned using an Agilent DNA microarray scanner. Feature extraction software (Agilent Technologies, Palo Alto, CA) was used to assess fluorescent hybridization signals and to normalize signals using linear regression and a Lowess curve-fit technique. Reproducibility and reliability of each single microarray was assessed using Quality Control report data (Feature extraction, Agilent Technologies). Self-self and dye swap hybridizations were performed to check data quality and evaluate the importance of dye bias. For self-self hybridizations, aliquots of the same RNA sample were separately labeled with CY3 and CY5 fluorescent dyes and cohybridized to the same microarray.
Data Analysis
Gene expression analysis was carried out using GeneSpring GX software (Agilent Technologies, Palo Alto, CA). Expression ratios were calculated (CY5 processed signal was divided by CY3 processed signal), and normalized per chip to the 50th percentile and finally normalized per gene to medians. We worked on a pre-screened list of 16,997 genes obtained after filtering the data for outliers, negative and positive controls, and on the quality flag CY5 and CY3 signals being “well above background”. To pass this last flag, CY5 and CY3 net signals needed to be positive and significant, with g(r) BGSubSignal greater than 2.6 g(r) BG_SD.
To determine if there were genes differentially expressed between mutation carriers and controls, we performed two Welch's t-tests (P < 0.01) on this pre-screened list of genes: one without correction and one with Benjamini and Hochberg's correction. Average linkage hierarchical clustering analysis was applied using Euclidean distance, and differentially expressed genes were annotated using the information from the Gene Ontology Consortium. Panther, Ingenuity Pathways Analysis (Ingenuity Systems®, www.ingenuity.com) and FatiGO software were used to assess whether specific biological processes or molecular functions were differentially expressed, through the over-representation of groups of genes with functional links, rather than individual genes. Global molecular networks and comparison of canonical pathways were generated using Ingenuity Pathways Analysis.
Allele-Specific Transcript Expression
Single-nucleotide primer extension was performed as described in the Supplementary Methods with the ABI Prism SnaPshot multiplex Kit (Applied Biosystems, Evry, France).
Results
Sample Characteristics
Sample characteristics are listed in Table 1. We selected a group of fifteen
Sample characteristics for

Non-carriers are healthy relatives tested negative by direct sequencing for a known
None:
When non-carriers belong to a
Distribution of Signal Intensity and Abundance of Transcripts
Signal intensity in lymphocytes was low. Although the dynamic range for the red and green channels was wide (from 30 to 60,000 for net signals), the median intensities were around 80 for both channels. As presented in Figure 1, the average

Mean of CY5 processed signal over 30 experiments for selected
Unsupervised Analysis
The mutation carrier and non-carrier samples were cohybridized with an internal reference to Agilent 44 K Whole Human genome Oligo Microarrays. Data were normalized using Feature Extraction software (Agilent Technologies, Palo Alto, CA) and analyzed with Genespring GX software (Agilent Technologies, Palo Alto, CA), resulting in a pre-screened set of 16,997 genes. An unsupervised method was used to reveal distinct clusters according to different parameters, such as

Hierarchical clustering performed on all samples «15
Supervised Analysis
Supervised analysis was performed to identify genes differentially expressed between
Hierarchical Clustering
Hierarchical clustering in both gene and experiment dimensions using these 133 genes (Fig. 3) showed two main clusters with a positive predictive value of 100% and a negative predictive value of 80%. The dendogram branches show eleven of the 15

«15
Gene List Annotation
Among the 133 differentially expressed genes, 105 corresponded to known genes with a unique identifier, and 81 could be classified in a Panther database (listed by function in Table 2). Transcription and translation functions were fairly well represented, with a subunit of RNA polymerase I (POLR1D), a putative RNA helicase (DDX55), and zinc finger transcription factors (ZZEF1, ZFYVE28, PRDM1) tending to be over-expressed in the
Gene list for 81 annotated genes selected from the 133 transcripts found to be differentially expressed between
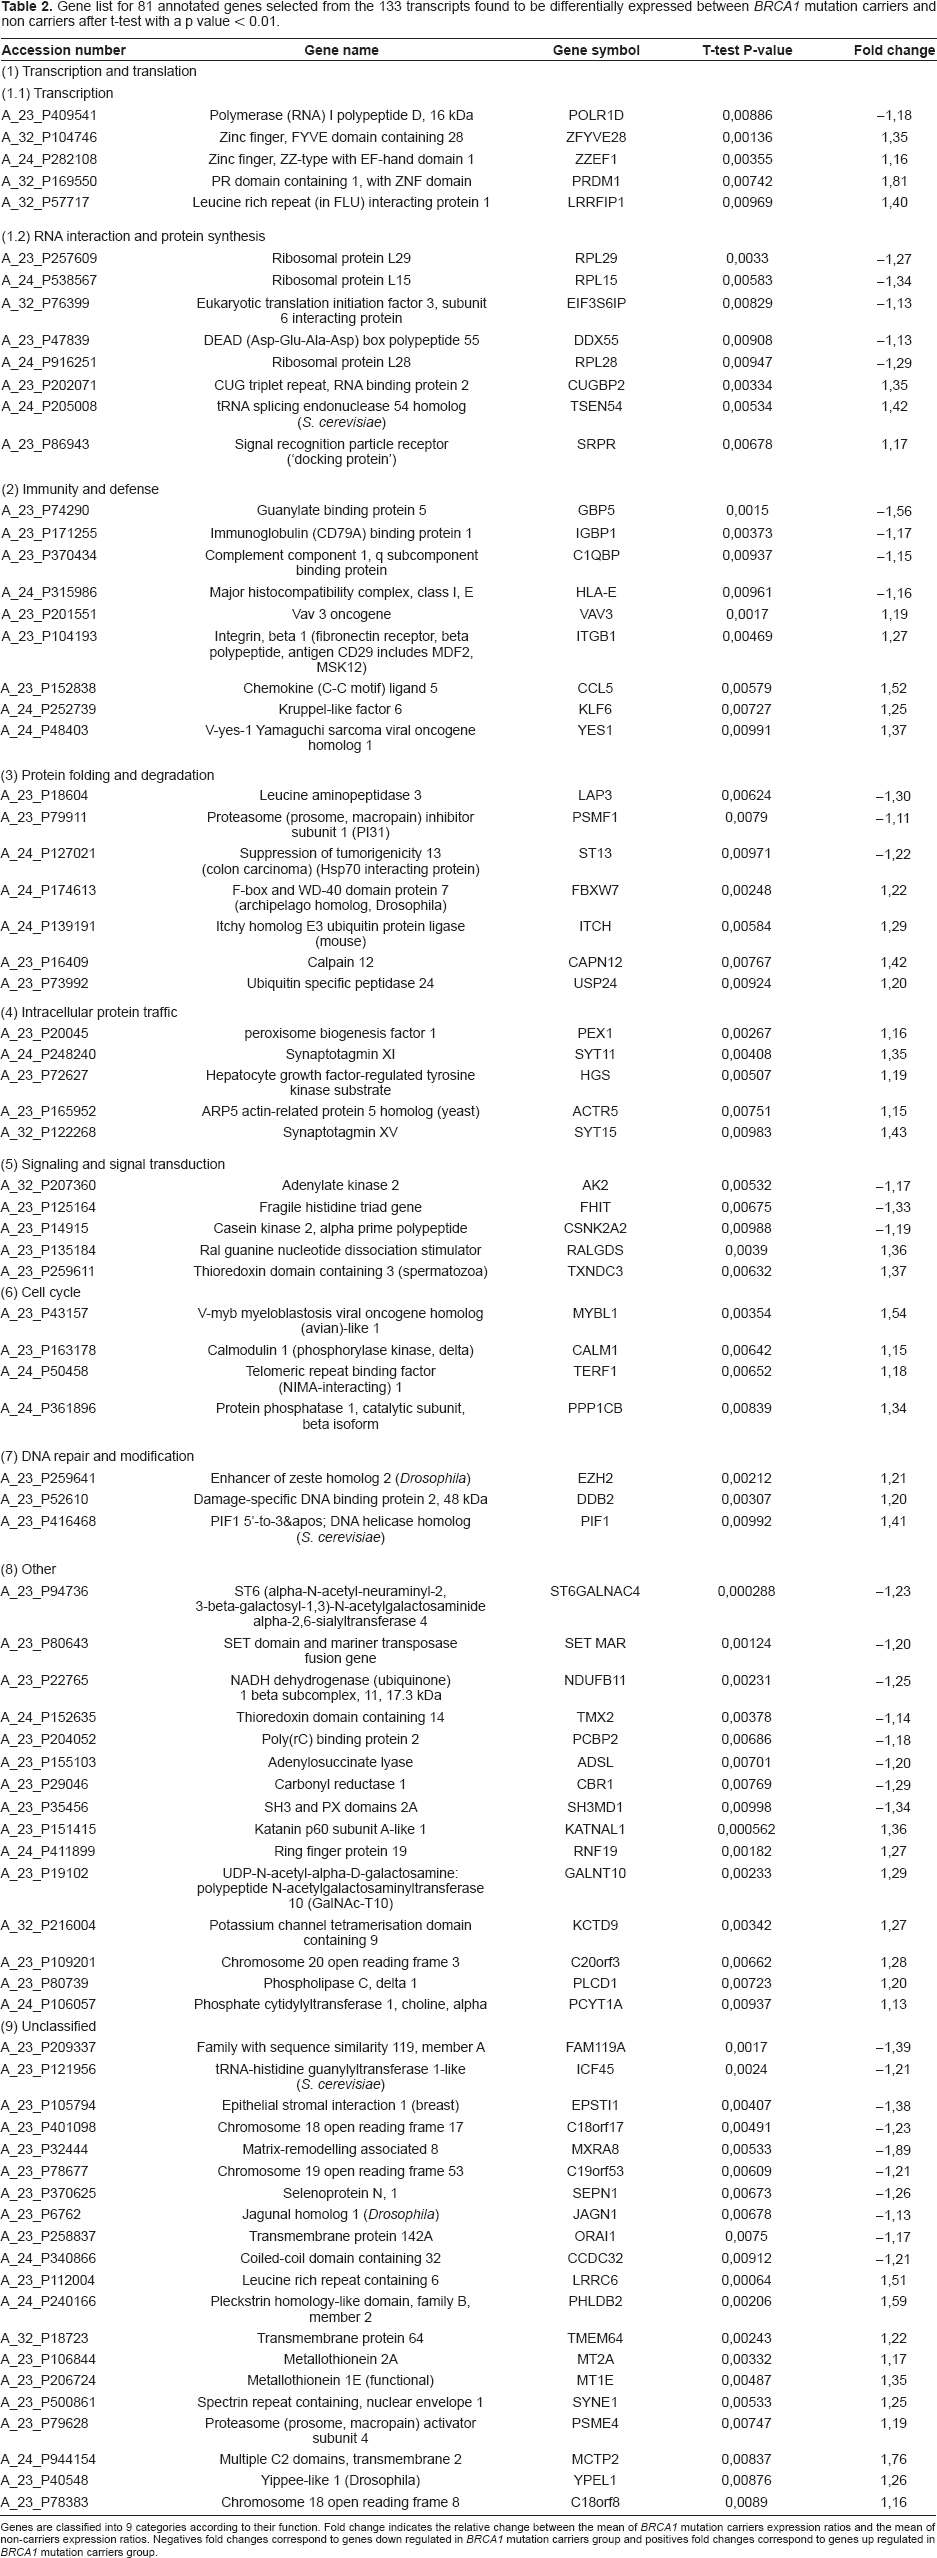
Using Ingenuity Pathways Analysis software, 67 genes could be used to generate global molecular networks, which identified 13 independent networks mainly involving genes linked to cancer disease. No overlap was observed between these 13 networks with the BRCA1 global molecular network, since no genes were common to our set of 133 genes and the global molecular network of 35 genes connected to BRCA1 and selected from the Ingenuity's Knowledge database. A search of all molecules upstream and downstream of BRCA1, for all types of relationships, yielded 314 genes linked to BRCA1. Comparison of this list to the 133 differentially expressed genes identified two in common (
The transcript DDB2 codes for Damaged DNA Binding Protein and was shown to be transcriptionally up-regulated by wild type BRCA1 in a p53-dependent manner upon DNA damage.
25
In our dataset, it tended to be slightly over-expressed in
None of the other BRCA1-interacting proteins and transcriptional targets cited previously and presented in Figure 1 were present among the 133 differentially expressed genes (Table 2). Fold-changes in gene expression for differentially expressed genes had little amplitude, and the standard deviation within the same group was large. As an example, in Figure 4A, although the VAV3 transcript tended to be slightly more represented in

Distribution of log ratios between 15
Supervised Analysis with Correction of False Discovery Rate
In order to limit the number of significant genes due to random chance among the 16,997 tested genes, we performed a t-test with Benjamini and Hochberg multiple testing correction with a p-value less than 0.01. This analysis did not show any genes differentially expressed between
Supervised Analysis of BRCA1-Interacting Proteins and Targets
Expression profiles of 52 BRCA1-interacting proteins and transcriptional targets were compared to mutation status. None of these genes appeared significant in a t-test with a p-value less than 0.05. Two genes,
Discussion
We compared gene expression profiles of untreated PBCMs from 15
Considering the very large number of genes tested (nearly 17,000) and the small number of samples (30), it is likely that random chance will yield some genes which are not really significant even though they appear to discriminate between the two populations. Using a more stringent test to control this false discovery rate, we did not find any genes passing this statistical restriction filter. Moreover,
This lack of difference in gene expression patterns between
Another source of error to consider is 3′-end bias. Reverse-transcription using oligo-dT primers biases this study in favor of detecting the 3′end of transcripts in the hybridization step, and is not suitable for detecting variants alternatively spliced far upstream of the 3′end. To address this issue, other strategies could be employed, notably random priming of the RT-PCR reaction, 26 and the use of exon-specific arrays, in which probes designed to interrogate variant transcripts are included in the array.
Comparing our results with microarray data from other groups obtained after irradiation confirms that
Previous studies demonstrate that gene expression profiles can be a powerful tool to predict
Disclosure
The authors report no conflicts of interest.