
Abstract
Keywords
Introduction
China has the largest distribution of karst landscapes in the world, primarily found in the south-western subtropical mountains (Wang et al., 2004; Chen et al., 2021). Karst landscapes are characterized by unique carbonate rock formations (Sweeting, 1995), elevated organic matter content(Ahmed et al., 2012), a double-layered structure (Dan et al., 2022) and limited soil-forming capacity (Liao et al., 2018). These landscapes are susceptible to disturbance, degradation, erosion, slow community succession, and pose challenges for ecosystem restoration (Zhang et al., 2021, 2022). Consequently, environmental changes significantly impact soil organic matter in karst ecosystems (Chen et al., 2018).
Soil microbes play a crucial role in biogeochemical cycles, particularly in relation to carbon, nitrogen, phosphorus, and iron. Soil microbes play a crucial role in biogeochemical cycles, particularly in relation to carbon, nitrogen, phosphorus, and iron. (Van Der Heijden et al., 2008; Fierer et al., 2012; Vos et al., 2013; Alivisatos et al., 2015; Tecon and Or, 2017). Studies have demonstrated the significance of soil microbes in facilitating the conversion of plant-derived organic matter into soil organic carbon, thereby extending the duration of carbon retention (Prommer et al., 2020). Additionally, Phosphorus in soil microorganisms is an important component of total phosphorus in the soil, usually equal to or greater than phosphorus content found in plant biomass (Richardson & Simpson, 2011). Furthermore, microorganisms, including symbiotic mycorrhizal fungal associations with plant roots, play a pivotal role in enhancing phosphorus availability by facilitating the process of apatite weathering (Turner et al., 2013). Soil microbes also enhance plant nutrient availability through biological nitrogen and phosphorus fixation (Van Der Heijden et al., 2008). Barrios (2007) notes that rhizobia in soil bacteria remains the most important source of biological nitrogen fixation in agriculture due to the symbiotic relationship between rhizobacteria and legumes. Additionally, prokaryotes in plants, such as Azotobacter, contribute to nitrogenous biomolecule production by absorbing NH3 (Wagner, 2011). Furthermore, in soil microorganisms, mycorrhizal fungi improve plant nutrient uptake, especially for nitrogen and phosphorus, and enhance plant resilience to stress conditions, such as nutritional deficiencies, droughts, and soil disturbances (Herrera et al., 1993; Requena et al., 2001; Barea et al., 2005). However, the functioning of microbial processes is determined by the biomass and activity of microbes, which are often restricted by the availability of essential resources like carbon (C) and nutrients such as nitrogen (N) and phosphorus (P). This limitation, referred to as microbial resource limitation, can impact the overall efficiency and effectiveness of microbial-driven biogeochemical cycles. (Abidine et al., 2016). Therefore, gaining a comprehensive understanding of the factors that limit and regulate microorganisms, as well as the specific resources that constrain their activities, is crucial for investigating alterations in the Earth's biogeochemical cycles. This knowledge is fundamental for comprehending the mechanisms driving ecological processes and predicting the impacts of environmental changes on the planet's biochemical dynamics.
The dynamics, activity and ecology of soil microbial community are significantly affected by topography, temperature, soil moisture, and soil organic matter (Florinsky et al., 2004; Zou et al., 2022). Slope orientations, by altering the solar radiation received by the surface, can affect microclimates (e.g., soil temperature, evapotranspiration) (Florinsky et al., 2004; Bennie et al., 2008), soil properties (e.g., water retention, soil organic matter) (Yimer et al., 2006; Geroy et al., 2011), and hydrological processes (Broxton et al., 2009).
In the northern hemisphere, north-facing slopes tend to be wetter and cooler than south-facing slopes, while south-facing slopes experience higher transpiration rates and slower plant growth due to greater exposure to sunlight (Segura et al., 2002; Méndez-Toribio et al., 2016). Several studies have also suggested that differences in soil properties between north and south slopes are also caused by soil weathering and erosion processes on south-facing slopes (Bochet & García-Fayos, 2004; Gong et al., 2008; Liu et al., 2020; Tuo et al., 2018). These factors collectively contribute to variations in biotic and abiotic factors, such as temperature, water content, pH, and soil nutrients, between the north and south slopes, which strongly influence the establishment of soil bacterial communities (Shen et al., 2013, 2020). Moreover, soil moisture, plant biomass, nitrogen, and carbon are highest on lower slopes, leading to more prolific and active microbial communities compared to upper slopes. (Broughton and Gross, 2000; Florinsky et al., 2004; Ma et al., 2022). Previous studies have focused on the effects of karst topography on topography and vegetation structure and the influence of topography on the organic matter of karst landscapes (Zhou et al., 2019; Huang et al., 2022). Specifically, these studies have revealed that the sunny and shady slopes of karst craters within the negative terrain habitat of the karst degraded tiankeng have a significant impact on the microclimate, resulting in notable variations in plant communities (Feng et al., 2021). However, there remains a lack of comprehensive analysis regarding the combined effects of karst topography under different slope orientations on the structure of soil microbial communities.
Therefore, in order to better understand the role of slope orientation in soil microbial communities in karst landscapes, it is necessary to study the effects of different slope orientations on soil microbial communities. In this study, three sample plots with different slope orientations in karst landscapes were selected, namely, shady slopes, sunny slopes and hilltops as sample plots. The purpose was to study the differences in soil chemical properties and soil microbial communities under the influence of different slope directions. The research aims to increase the understanding of the role of different topography on soil microorganisms in karst landscapes and to provide a reference and scientific basis for ecological restoration projects in karst areas.
Materials and Methods
Study Site
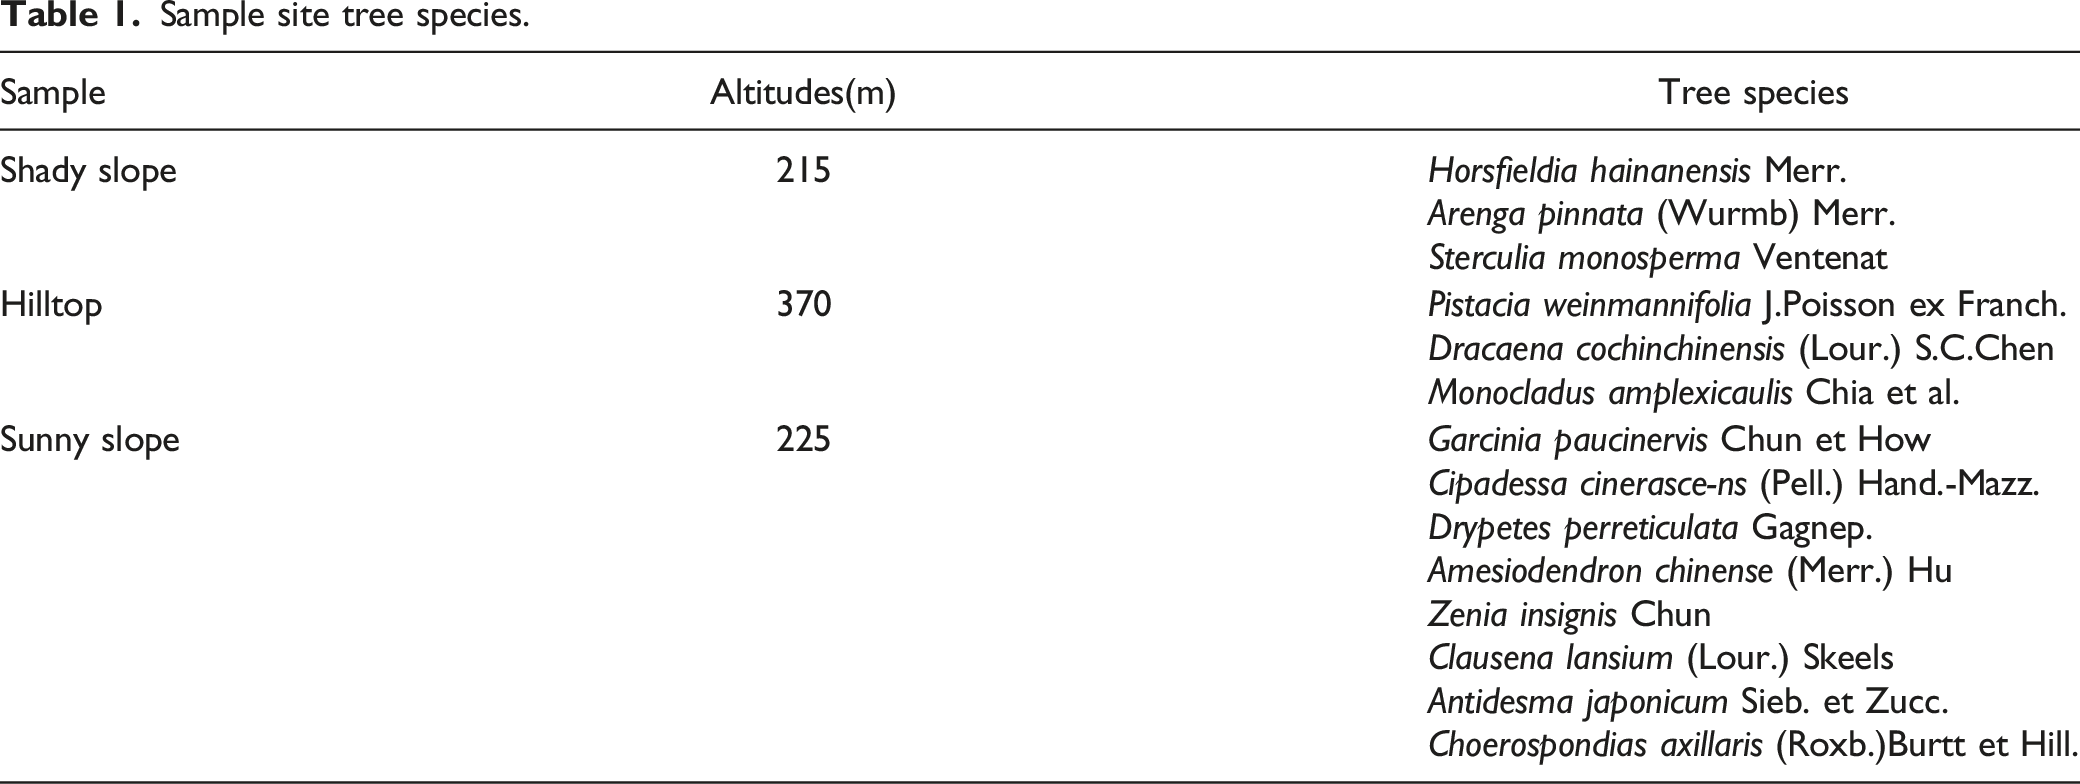
Sample site tree species.
Soil Sampling
In October 2022, we collected 12 soil samples from three sample plots which were set up from three different slope orientations (sunny slope, shady slope and hilltop) under the same weather conditions. Each soil sample was collected from a plot of 20m × 20m and was spaced 50-200 m apart. After removal of the litter layer, soil samples were obtained from layer A of each stand, which is the uppermost layer of soil that is most affected by natural and man-made influences such as climate, vegetation and cultivation, by means of a soil auger (8 cm). The collected soil samples were placed in a cooled box and then transferred into the laboratory. To remove the roots and other fragments, the samples were screened by a 2 mm screen and each repeated soil was split into two parts. One is stored in a refrigerator at -80°C and then total soil DNA is extracted after a period of storage, the other is dried in a ventilated, cool, dry room for the determination of chemical parameters of the soil.
Soil Chemical Properties
Soil pH was determined in 1:2.5 (w:v) solutions. Total carbon (TC) and total nitrogen (TN) contents were determined by the elemental analyzer (Elementar Vario EL III, Germany) (Song et al., 2015). Total phosphorus (TP) in soil was determined by the molybdenum antimony anti-colorimetric method (Ba et al., 2020).
DNA Extraction, Amplification, and Illumina Miseq Sequencing
Extraction of soil DNA from 0.5 g of soil using the FastDNA SPIN Kit for Soil (MP Biomedicals, Santa Ana, CA, USA) was performed using a NanoDrop ND-1000 spectrophotometer (Thermo Fisher Scientific, Waltham, MA, USA). Quantitative PCR amplification of the V3-V4 region of the bacterial 16S rRNA gene was carried out using forward primer 338F (5r-ACTCCTACGGGAGGCAGCA-3r) and reverse primer 806R (5r-GGACTACHVGGGTWTCTAAT-3r). The target fragment was amplified using ITS1F (forward primer: 5'-CTTGGTCATTTAGAGGAAGTAA-3') and ITS2R (reverse primers: 5'-GCTGCGTTCTTCATCGATGC-3') was used to amplify the target fragment of the selected transcribed spacer region of the fungus. The PCR reaction system and conditions for the amplification of fungal target fragments were the same as those for bacteria. The PCR reaction system was: 2 μL DNA template, 1 μL each upstream and downstream primers (10 μmol-L-1), 5 μL buffer, 5 μL Q5 high fidelity buffer, 0.25 μL high fidelity DNA polymerase (5 U-μL-1), 2 μL dNTP (2.5 mmol-L-1) and 8.75 μL ultrapure water (dd H2O). The PCR amplification procedure was as follows: pre-denaturation at 98°C for 2 min, 25 cycles (denaturation at 98°C for 15 s, annealing at 55°C for 30 s, extension at 72°C for 30 s), followed by stable extension at 72°C for 5 min, and finally storage at 4°C. Amplicons for PCR were purified using Agencourt AMPure Beads (Beckman Coulter, Indianapolis, IN) and quantified using a PicoGreen dsDNA detection kit (Invitrogen, Carlsbad, CA, USA). PCR products were obtained using Shanghai Ltd.'s Illumina NovaSeq 6000 sequencing platform for sequencing.
Statistical Analyses
Firstly, qiime cutadapt trim-paired was called to cut out the primer fragments of the sequences and discard the unmatched primer sequences; followed by qiime dada2 denoise-paired to invoke DADA2 for quality control, denoising, splicing and chimera removal to obtain the de-duplicated sequence amplicon sequence variants (ASVs) (Callahan et al., 2016). After the denoising analysis of each sequence separately, the characteristic sequences of ASVs and ASV tables were combined and the ASVs with a total number of sequences of only 1 in the whole sample were removed. The tables were subjected to certain transformations after the abundance tables were generated. At the six taxonomic levels of domain, phylum, order, order, family, genus and species, the results of the analysis are presented in bar charts by counting the character tables after the removal of single individuals. Also, a histogram can be plotted by calling the 'qiime taxa barplot' command using the unplotted ASV/OTU table to calculate the chosen alpha-diversity index. The data in the grouped samples were plotted as box plots using the R script to visualise the differences in alpha-diversity between the different sample groups and the significance of the differences could be verified using the Kruskal-Wallis rank sum test and the Dunn'test as a post-hoc test. The data in the grouped samples were plotted as box plots to visualise the differences in alpha diversity between the different sample groups and the significance of the differences was verified using the Kruskal-Wallis rank sum test and the Dunn'test as a post-hoc test. Venn diagrams were carried out for shared and unique ASVs of different slopes using the VennDiagram package. Beta diversity clustering analysis was mostly used in Hierarchical clustering (HCC) analysis to show the similarity between samples in the form of hierarchical trees. Cluster analysis was performed using the uclust function of the R stat package, defaulting to the UPGMA algorithm for the Bray-curtis distance matrix (i.e. the clustering method is average) and visualised using the R script ggtree package. Also, community composition differences were analysed at all taxonomic levels by forming LEfSe analyses using the Python LEfSe package and the R script gtree package. Using the flattened ASV/OTU table, call “qiime diversity core-metrics-phylogenetic” or “qiime diversity core-metrics” depending on the presence or absence of a tree file. “command, calculate Bray-Curtis, and do PCoA analysis on these distance matrices, and output the QZV file. The QZV files can be visualised by dragging them into the corresponding area of https://view.qiime2.org/. Also, PCoA analysis can be done in R using the R script to output the PCoA coordinates of the sample points and plot them as a two-dimensional scatter plot. Using the bray-curits distance matrix file, the “permanova” (default test) between-group variance analysis was performed using the scikit-bio package in python, with the number of permutation tests set to 999. When the test was selected as “adonis”, then the vegan package for R was used to calculate the R2 and p significance of the variance of the distance matrix for the grouping scheme, and the number of permutation tests was set to 999.
Results
Comparative Analysis of Soil Chemical Properties Under the Effect of Different Slope Orientations
Soil chemical properties.
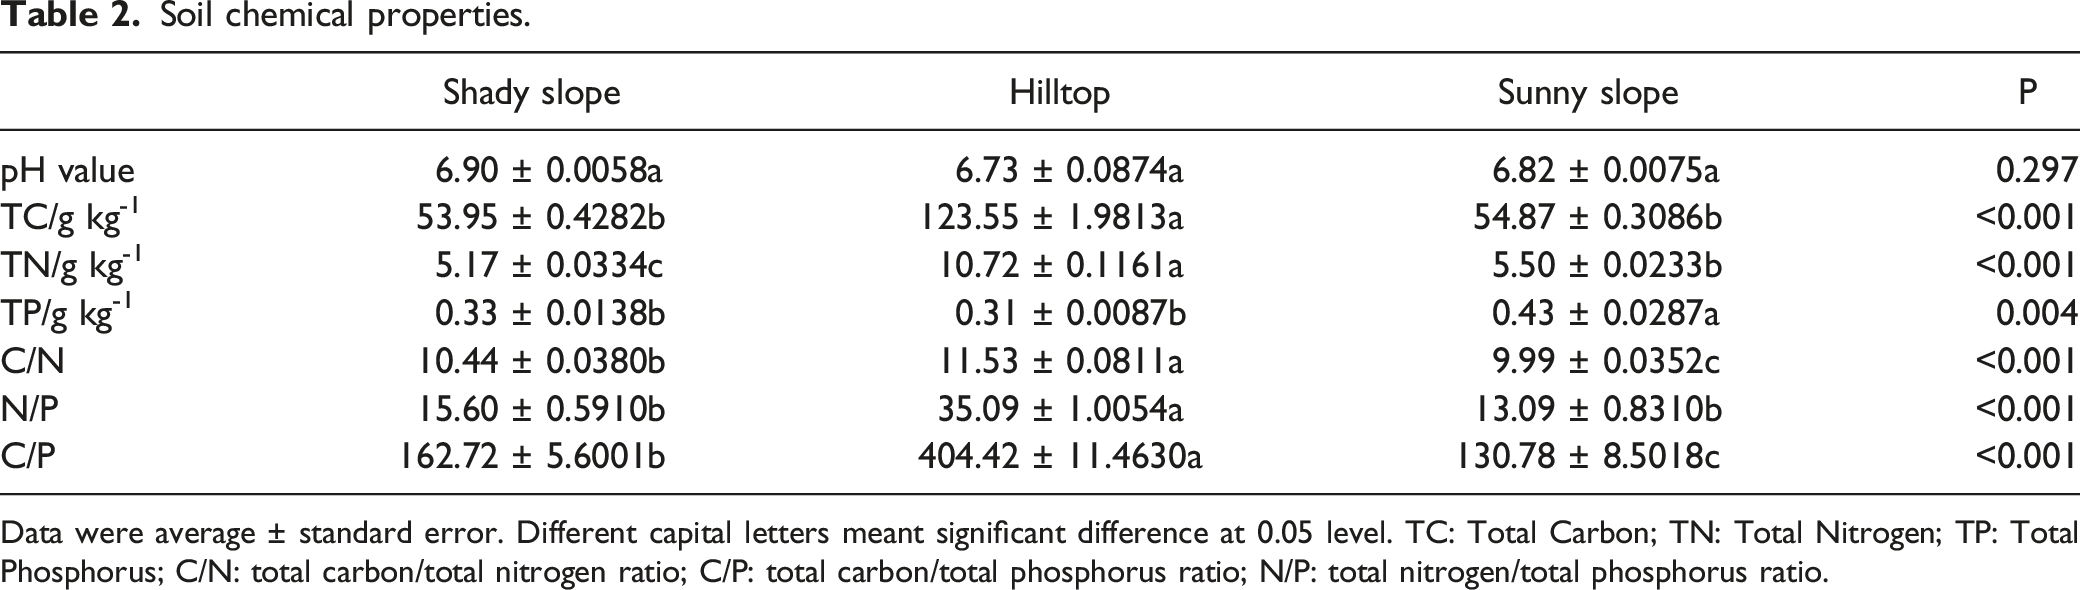
Data were average ± standard error. Different capital letters meant significant difference at 0.05 level. TC: Total Carbon; TN: Total Nitrogen; TP: Total Phosphorus; C/N: total carbon/total nitrogen ratio; C/P: total carbon/total phosphorus ratio; N/P: total nitrogen/total phosphorus ratio.
Microbial Community Richness and Diversity Under The Effect of Different Slope Orientations
At the bacterial level, Venn diagrams were constructed using the ASV abundance table to determine the number of unique ASVs in each subgroup and the ASVs shared among the groups. ASVs shared among Shady slope, Hilltop, and Sunny slope were 471, while the unique number of ASVs of Shady slope, Hilltop, and Sunny slope were 7781, 7798, and 8423, respectively. Additionally, the Shady slope and Sunny slope exhibited the highest number of shared ASVs (Figure 1a). The shared and unique OTUS of soil (a) bacterial and (b) fungal community diversity among SN, SH, and SD. SN: Shady Slope; Downhill; SH: Shady Slope; Hilltop; SD: Sunny Slope; Shady Slope.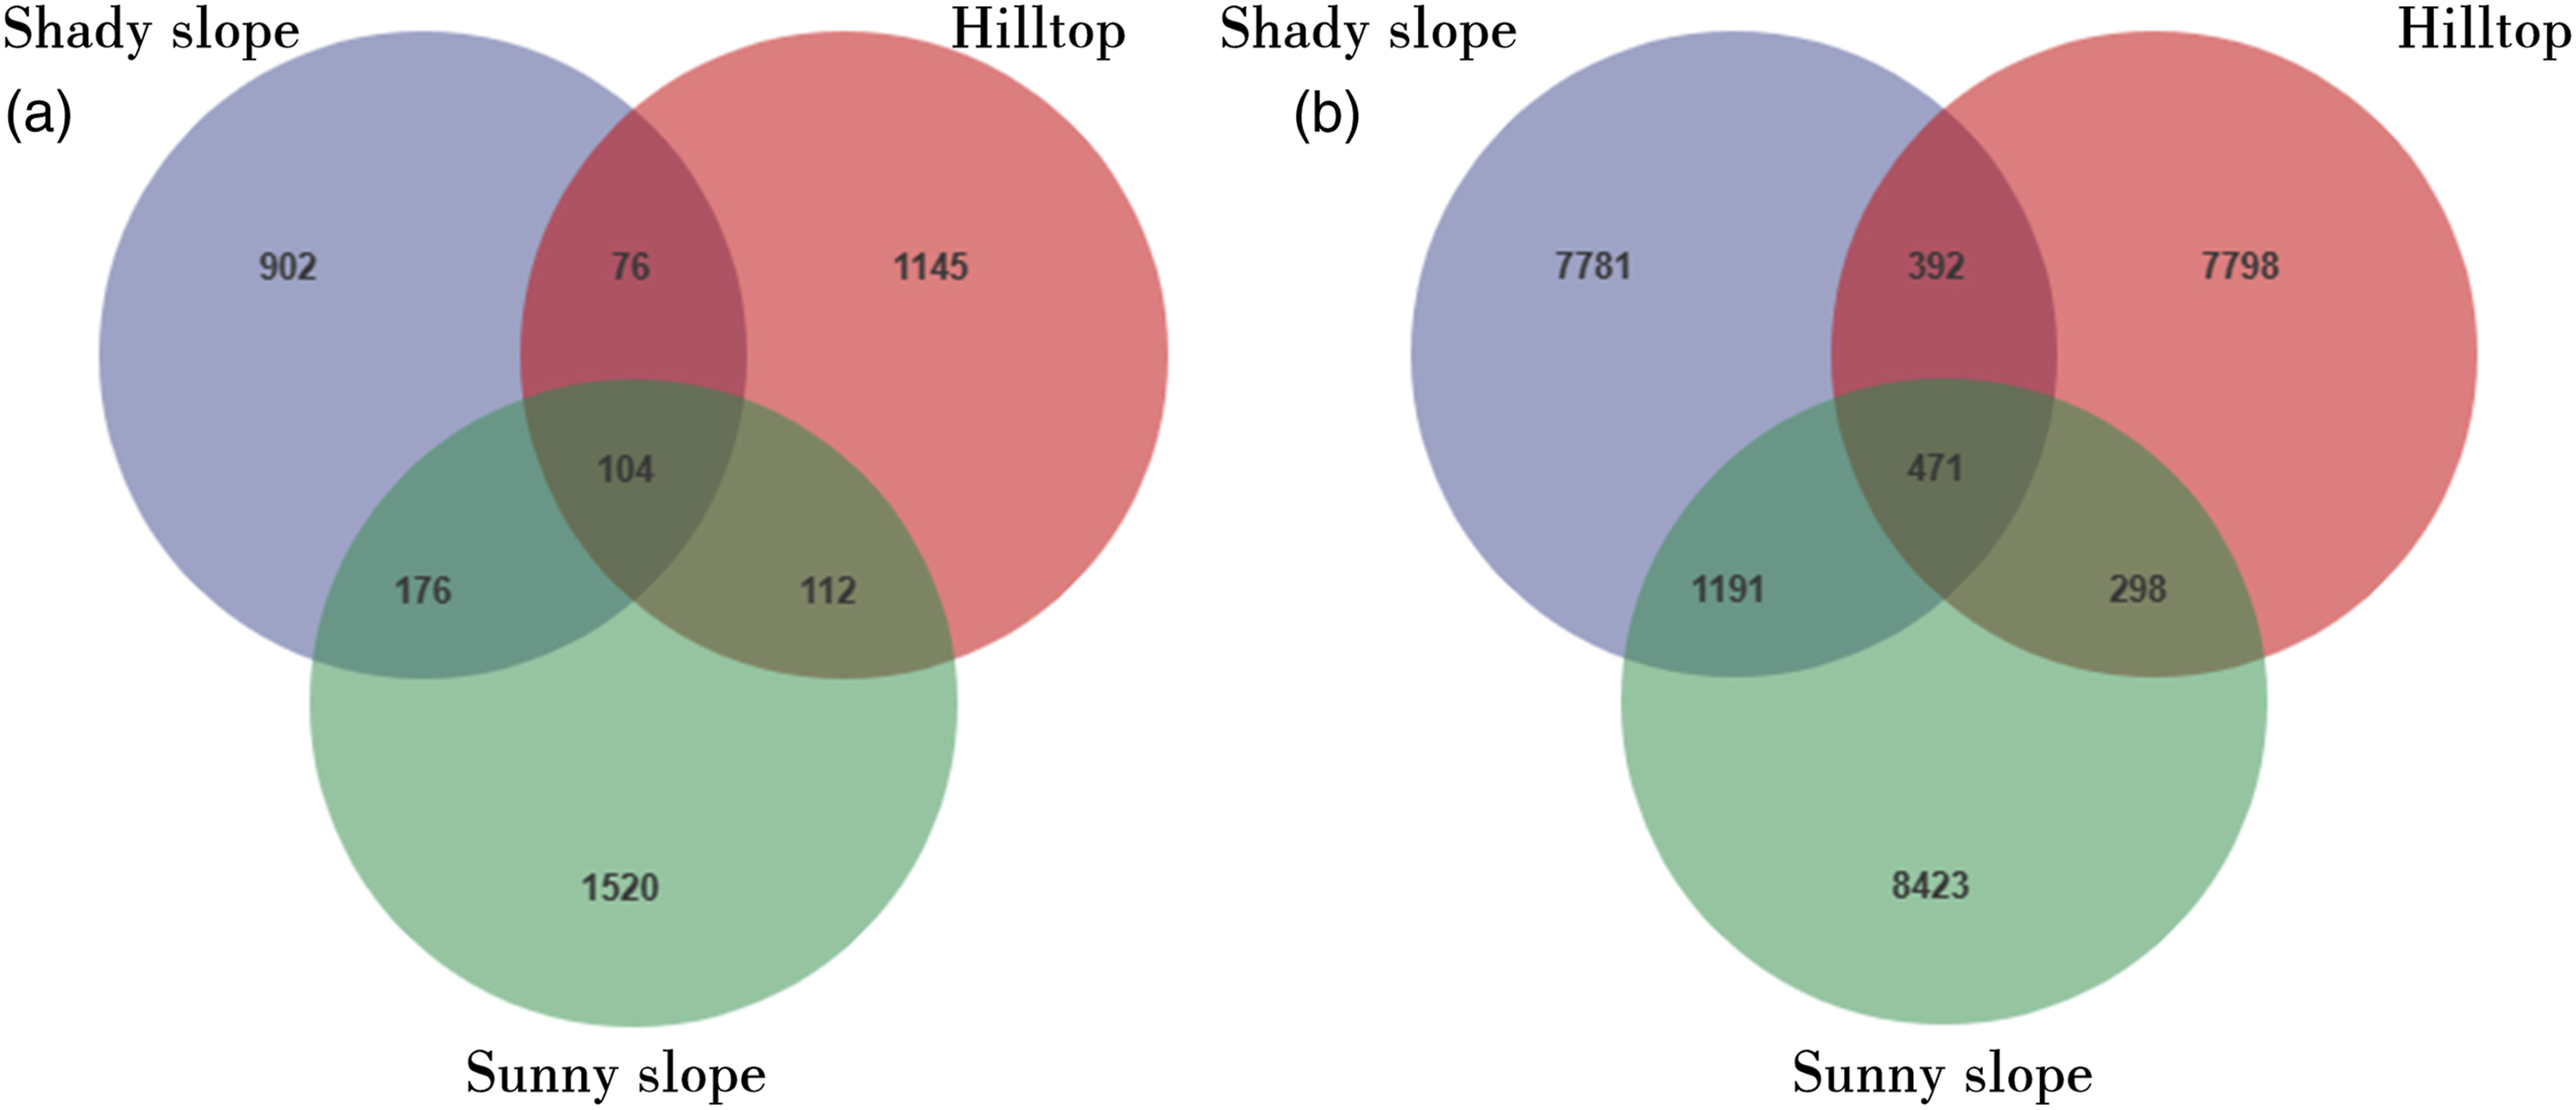
The alpha diversity analysis, including the Chao 1 index, Pielou_e index, Goods_coverage, and Shannon index, was employed to assess the diversity among the Sunny slope, Shady slope, and Hilltop. The Chao 1 index and Goods_coverage index did not demonstrate significant variations among the Shady slope, Hilltop, and Sunny slope (F= 0.72, P= 0.55 and F= 0.034, P= 0.59, respectively). However, there were significant differences in bacterial diversity (Shannon index) (F= 12.396, P= 0.037), with the order being Sunny slope > Shady slope > Hilltop. Similarly, the Pielou_e index also showed notable differences (F= 23.753, P= 0.018), with the order being Shady slope > Sunny slope > Hilltop (Figure 2a). Soil bacterial (a) and fungal (b) community diversity among SN, SH, and SD. SN: Shady Slope; SH: Hilltop; SD: Sunny Slope.
At the fungal level, the number of fungal ASVs shared among Shady slope, Hilltop, and Sunny slope was 104, while 902 unique ASVs were found in Shady slope, 1145 in Hilltop, and 1520 in Sunny slope. Furthermore, 176 fungal ASVs were shared between the Shady slope and Sunny slope, 76 between the Shady slope and Hilltop, and 112 between the Hilltop and Sunny slope, with the highest number of shared fungal ASVs occurring between the Shady slope and Sunny slope (Figure 1b).
In contrast to bacteria, the Chao 1 index of fungal showed significant variations. The Chao 1 index of Sunny slope was considerably higher than that of Hilltop, while the Shady slope exhibited the lowest index (F= 17.437, P= 0.0073). The Goods_coverage also exhibits a marked change (F=9.743, P= 0.017),with the hilltop significantly higher than Shady slope, and followed by Sunny slope. However, there were no significant differences observed in the Shannon index (F= 1.168, P= 0.22) and Pielou_e index (F= 0.065, P= 0.29) among the Shady slope, Hilltop, and Sunny slope (Figure 2b).
Distribution and Composition of Microbial Community Under the Effect of Different Slope Orientations
The distribution and composition among different soil samples were analyzed using a heatmap, which allowed for the visualization of species abundance trends across the samples As shown in Figure 3, at both the bacterial and fungal levels, At both the bacterial and fungal levels, the Hilltop samples clustered together as a distinct category, while the remaining samples clustered into another category. The Shady slope showed great similarity to the Sunny slope, although the similarity between the Hilltop and the Shady slope/ Sunny slope was lower. The histogram revealed variations in microbial community abundance at the genus level. Despite the similar species composition of the Shady slope and Sunny slope, the relative abundance of bacterial phyla differed between the different slope orientations. Hierarchical clustering analysis of soil bacterial (a) and fungal (b) communities among SN, SH, and SD. SN: Shady Slope; SH: Hilltop; SD: Sunny Slope.
Principal Coordinates Analysis (PCoA) analysis was performed by projecting the sample distance matrix into a lower dimensional space, preserving the original samples distance relationships. The analysis demonstrated that the bacterial communities of SN (Sunny slope) and SD (Shady slope) were significantly more similar, while SH (Hilltop) exhibited significant dissimilarity from SN and SD (Figure 4). Permanova analysis was employed to test whether the distances within each group were different from the distances between groups. Consistently, the results indicated that SD and SN showed more similar characteristics, while SH displayed greater variability (Figure 5). Distance matrix and PCoA analysis soil bacterial (a) and fungal (b) community diversity among SN, SH, and SD. SN: Shady Slope; SH: Hilltop; SD: Sunny Slope. Permannova analysis of bacterial (a) and fungal (b) communities among SN, SH, and SD. SN: Shady Slope; SH: Hilltop; SD: Sunny Slope.

By examing the feature table after removing singletons, the compositional distribution of each sample at the phylum taxonomic level was visualized (Figure 6). A total of 42 bacterial phyla were obtained, with 13 phyla accounting for >1% abundance overall. Together these major bacterial phyla accounted for 99.06%-99.80% of all sample sequences. The dominant bacterial phylum in the Shady slope and Sunny slope was Proteobacteria (33.13%-39.28% in Shady slope and 33.69%-36.82% in Sunny slope), followed by Actinobacteriota (19.69%-26.91% in Shady slope and 28.33%-32.62% in Sunny slope) and Acidobacteriota (14.00%-15.92% in Shady slope and 11.50%-15.41% in Sunny slope). In contrast, Actinobacteriota predominates in the Hilltop samples (42.39%- 45.59%), followed by Proteobacteria (31.49%- 33.31%) and Acidobacteriota (9.98%- 11.74%) (Table s1). Analysis of the composition of soil bacterial (a) and fungal (b) communities among different slope orientation at levels of phylm unit. SN: Shady Slope; SH: Hilltop; SD: Sunny Slope.
The fungal communities were primarily composed of Ascomycota (73.15%-79.67%), followed by Basidiomycota (12.05%-20.97%) and Mortierellomycota (0.90%-5.06%). Ascomycota were overwhelmingly dominant species in all samples [Shady slope (79.67%), Hilltop (77.75%), Sunny slope (73.15%)]. Additionally, the relative abundance of Basidiomycota was notably higher in the Sunny slope compared to the Shady slope and Hilltop, while the Shady slope exhibited the highest abundance of Mortierellomycota (Table s1).
The analysis of LEFse revealed significant differences in the number of important biomarkers for different classes of taxonomic units among the Shady slope, Hilltop, and Sunny slope. Specifically, there were 80, 59, and 56 important biomarkers for these slope categories, respectively. Eight major bacterial phyla showed significant differences in abundance in the Shady slope, while the Hilltop and Sunny slope had one and two major differentiating phyla, respectively. At the family level, the species with the highest abundances varied considerably across the slope orientations. In the Shady slope, the indicator species included Rokubacteriales (Rokubacteria), Acidobacteria_Subgroup 6, and B1-7BS (Gammaproteobacteria). Meanwhile, the most abundant species in Hilltop were Solirubrobacterales bacterium 67-14 (Actinobacteria), Geminicoccaceae (Alphaproteobacteria), and bacteriap25 (Deltaproteobacteria). In the Sunny slope, the key species were were .Xanthobacteraceae (Alphaproteobacteria), Burkholderiaceae (Gammaproteobacteria), and Roseiflexaceae (Chloroflexi) (Figure 7). The most abundant ASVs in Shady slope were assigned to Rokubacteriales. These bacteria are positively correlated with pH and commonly found in nitrogen-containing wetlands (Ivanova et al., 2021). Acidobacteria_Subgroup_6, also exhibited a positive correlation with pH and a negative correlation with carbon content, consistent with findings reported by Fierer N et al. (2007). The most abundant ASVs in Hilltop was Solirubrobacterales bacterium 67-14 (Actinobacteria), which showed a preference for diverse carbon sources and is mainly detected in soil with high species diversity and distinct phenotypic characteristics (Hu et al., 2019). Geminicoccaceae in the hilltop also belongs to aerobic or facultatively anaerobic bacteria. Meanwhile, bacteriap25, performed high interactivity and low demand for inorganic compounds. In the Sunny slope, the indicator species belonged to Xanthobacteraceae, which are strictly aerobic and cultured at temperatures between 25-42°C (Oren, 2014). Biomarkers found after linear discriminant analysis Effect size (LEfSe) of soil bacterial (a) and fungal (b) community among SN, SH, and SD. SN: Shady Slope; SH: Hilltop; SD: Sunny Slope.
At the fungal level, significant differences were observed in the number of biomarkers for different classes of taxonomic units among the Shady slope, Hilltop, and Sunny slope, with 43, 48, and 82 significant biomarkers, respectively. The dominant species in the Shady slope were Capnodiaceae (Ascomycota), Mortierellaceae (Mortierellomycota), and Hypocreales_fam_Incertae_sedis (Ascomycota). In contrast, the three most abundant species in Hilltop are Archaeorhizomycetaceae (Ascomycota), Chaetomiaceae (Ascomycota), and Geastraceae (Basidiomycota), while the Sunny slope exhibited high abundances of Ganodermataceae (Basidiomycota), Trichosporonaceae (Basidiomycota), Aspergillaceae (Ascomycota).
Correlations Between Microbial Communities and Soil Properties
Relative abundance of the top 10 most abundant bacterial phyla (>1%) present in soil samples.

*means significant correlation at the P< 0.05 level; ** means significant correlation at the P<0.01 level. TC: Total Carbon; TN: Total Nitrogen; TP: Total Phosphorus; C/N: total carbon/total nitrogen ratio; C/P: total carbon/total phosphorus ratio; N/P: total nitrogen/total phosphorus ratio.
Analysis using Lefse identified the most abundant family-level species in each sample. Extracting the three species with the highest abundant in each sample and relating them to the soil chemical properties, then Table s2 can be received. In the Shady slope, Rokubacteriales, Acidobacteria_Subgroup_6, and B1-7BS were the most abundant species. In the hilltop, Solirubrobacterales bacterium 67-14, Geminicoccaceae, and bacteriap25 dominated. The Sunny slope was characterized by Xanthobacteraceae, Burkholderiaceae, and Roseiflexaceae as the most abundant species. TC was significantly negatively correlated with Rokubacteriales (r= -0.776), B1-7BS (r= -0.839), and Roseiflexaceae (r= -0.713). TN showed significant negative correlations with Rokubacteriales (r= -0.837), Subgroup_6 (r= -0.697), and B1-7BS (r= -0.911), but positive correlations with Solirubrobacterales bacterium 67-14 (r= 0.837) and Geminicoccaceae (r= 0.602). TP was significantly negatively correlated with Geminicoccaceae (r= -0.664) and bacteriap25 (r= -0.830), but positively with Xanthobacteraceae (r= 0.657), Burkholderiaceae (r= 0.819), and Roseiflexaceae (r= 0.685). C/N showed significant positive correlations with Geminicoccaceae (r= 0.720) and bacteriap25 (r= 0.888), and significant negative correlations with Burkholderiaceae (r= -0.762) and Roseiflexaceae (r= -0.888). N/P and C/P were significantly positively correlated with Geminicoccaceae (r= 0.804), bacteriap25 (r= 0.881), Burkholderiaceae (r= 0.881), but significantly negatively with Xanthobacteraceae (r= -0.580) and Roseiflexaceae (r= -0.811).
At the fungal phylum level, no significant changes were observed in Ascomycota with respect to soil properties. However, Basidiomycota showed significant negatively correlations with C/N, N/P, and C/P, while Mortierellomycota exhibited significant negative correlations with TC and TN and a positive correlation with pH (Table s2).
These analysis demonstrates that soil properties have a substantial impact on the abundance of soil bacterial family species, with distinct effects observed across different samples. Furthermore, our analysis indicates that changes in bacterial abundance are more responsive to variations in soil properties compared to fungal abundance. These results highlight the significance of soil properties in shaping the composition and abundance of soil bacterial communities, underscoring their ecological importance in ecosystem functioning and stability.
Discussion
Response of Bacterial Community Diversity and Composition to Soil Chemical Properties Among Different Slope Orientations
The study revealed a strong correlation between soil microbial activities and environmental factors, including tree species, topography, temperature, soil moisture, and soil organic matter. These factors were found to have a significant impact on the composition of microbes and distribution patterns (Nakamura, A et al., 2003; Eviner, V.T., 2004). Notably, our study found that the slope exhibited a higher number of ASVs, likely due to the greater plant species diversity found on slopes. Previous studies have attributed differences in litter, forest floor and soil microbial communities to differences in tree species at a particular site (Prescott & Grayston, 2013). Furthermore, studies also demonstrated that a broad-leaved forest had a significant positive influence on the bacterial community, as compared to the shrubs (Qiu, Z et al., 2022). This finding aligns with our observations, as the hilltop exhibited a higher abundance of shrubs, while the sunny slope featured a greater prevalence of broad-leaved trees. Our research revealed similarities in the species composition of bacterial communities across different slope orientations, but notable differences in their relative abundances. Although the species richness index did not show significant differences, we observed a significant influence of phosphorus content on Observed_species, with Hilltop species having the lowest richness due to their lower phosphorus levels. Previous studies have demonstrated the significant relationship between pH and bacterial community structure, with near-neutral soils generally exhibiting higher bacterial diversity compared to acidic or alkaline soils. Moreover, the relative abundance of several bacterial taxa has been shown to correlate with soil pH (Lauber et al., 2009). While the relationship between pH and bacterial communities was not evident in our study, we observed a trend of higher abundance of relatively neutral soil bacteria.
The study found that the dominant bacterial classes in soils affected by different slopes were distinct, including Solirubrobacterales, Rokubacteriales, Xanthobacteraceae. Previous studies (Fierer et al., 2007; Hu et al., 2019; Oren, 2014) have demonstrated the typical nature of these features. The abundance of thermophilic flora increases significantly with altitude, while the bacterial communities with the highest abundance of tree species at lower altitudes tend to be mesophilic and predominantly aerobic. The distinct families with the highest abundance across different slopes indicate the presence of microorganisms with specialized functions that can thrive in diverse habitats influenced by slope orientation.
Furthermore, the similar composition of dominant genera at the fungal family level suggests a stable microbial community composition structure for soil microorganisms from different slope orientations at the same site. However, the highest abundance of species differs between slope orientations, suggesting that microorganisms with specific functions can survive in habitats with different environmental variables (Jiang et al., 2022).
Drivers of Differences in the Structure of Soil Microbial Communities Among Different Slope Orientations
Plant community structure is known to strongly influence the microbial communities by affecting the quantity and quality of litter and exudates, consequently leading to changes in the microbial community composition (Bezemer et al., 2010). Our study revealed significant differences in the dominant microbial species among plant communities in different slope orientations. Additionally, the chemical properties of the soil play a crucial role in shaping the soil microbial community (Hu et al., 2014). Previous studies have shown a negative correlation between carbon content and community richness (Bastida et al., 2021), which is consistent with our findings that TC exhibited a significant negative correlation with the community richness index. The soil C/N ratio directly reflects the N mineralisation capacity of the soil. Low soil C/N levels indicate a high N mineralisation rate, promoting nitrogen uptake by microorganisms and plants. Conversely, high C/N ratios favour the fixation of soil organic carbon, which corresponds to our observation that Hilltop had the highest C/N ratio but the lowest ASVs (Barbier et al., 2008). Furthermore, TN and TP wwere found to have important effects on the composition of soil bacterial communities. Therefore, slope orientations serve as significant drivers of differences in the structure of soil microbial communities. Cai et al (2020) showed that interharvesting treatments of larch plantations in northern China positively affected the diversity, abundance and soil nutrient status of soil bacterial communities. In particular, increases in soil total carbon, total nitrogen, total phosphorus, nitrate-nitrogen and ammonium-nitrogen at moderate intercutting intensities helped to regulate the abundance of bacteria (e.g., Bacillus phylum and Nitrosospirillum).
Different Slope Orientations Contribute to Different Plant Community Structures and Soil Chemical Characteristics
Slope orientation exerts a significant influence on microclimate, soil structure and plant community composition. The summits consist of more trees which prefer hot and warm weather, while the trees on the shady slopes prefer moist and humid conditions. Gutierrez-Jurado et al. (2006) found that in the lower elevations in northern New Mexico, north-facing slopes support a greater abundance of mesic plant species, while south-facing slopes are dominated by arid species. Similarly, Xavier Zapata et al. (2016) considered that slope orientations influence differences in vegetation cover and biomass by controlling differences in resources, particularly moisture. In our study, We observed that, the Sunny slope possessed the higher vegetation abundance compared to Shady slope and Hilltop. Although the plant communities of each site in this study resembled typical tropical montane rainforests, their community structure varied greatly from different slope orientations. The dominant families, genera and species of the plant communities also differed among the slopes as well. Specifically, the shady slope was characterized by the dominance of Horsfieldia hainanensis Merr., Arenga pinnata (Wurmb) Merr., and Sterculia monosperma Ventenat, which are shade-tolerant rainforest species adapted to acidic and calcareous soils (J.-F. Liu et al., 2019a; Liu et al., 2019b). Hilltop species, on the other hand, prefers warmer, drier environmentsand are commonly found on open peaks and forest tops. In contrast, trees on the Sunny slope predominantly grow in dry sparse or dense forests in limestone mountains, favoring warm, moist, sunny conditions (Liu et al., 2016). Evidently, the unique plant community structures observed on each slope are the result of complex interactions between climate, hydrology, and soil properties influenced by slope orientation. Plants exploit subtle resource heterogeneity across microenvironments to occupy different ecological niches, facilitating species (Badano et al., 2005; Moeslund et al., 2013). Regarding chemical properties, our findings indicate that the Sunny slope exhibits an absolute advantage in terms of TC and TN. Consistent with previous studies, variations in plant species traits contribute to differences in soil environments and microbial community composition (Ayres, E et al., 2009). Furthermore, Kuzyakov (2006) provided evidence that different plant species have the potential to enhance carbon loss by releasing labile forms of carbon through root secretions. This process, in turn, can stimulate soil microbial activity by promoting the mineralization of both old and new soil organic carbon. Qiu, Zhenlu et al.(2022) also demonstrated that in comparative studies made on coniferous forests, mixed coniferous and broadleaf forest squares and broadleaf forests, and barren mountain shrubs, it was found that broadleaf afforestation most significantly improved the nutrient characteristics and bacterial communities of the soil.
These findings align with the notion that different tree species can lead to different soil microorganisms. Based on this understanding, we can hypothesize that different plant communities formed under the influence of different slope orientations similarly shape the composition of different soil microbial communities. Additionally, our analysis demonstrates that soil properties exert a significant influence on the abundance and diversity of soil bacterial families, with varying effects observed across different samples.
Supplemental Material
Supplemental Material - Comparative Study of Soil Microbial Diversity on Different Slope Orientations in Karst Rocky Mountains of Guangxi, China
Supplemental Material for Comparative Study of Soil Microbial Diversity on Different Slope Orientations in Karst Rocky Mountains of Guangxi, China by Keye Zhu, Jiaying Liu, Yang Ge, Ruiyao Dong, Qi Tian, Wenxu Zhu, Nanyan Liao, and Wuzheng Li in Tropical Conservation Science
Footnotes
Declaration of Conflicting Interests
The author(s) declared no potential conflicts of interest with respect to the research, authorship, and/or publication of this article.
Funding
The author(s) disclosed receipt of the following financial support for the research, authorship, and/or publication of this article: This work was supported by the National Natural Science Foundation of China (Grant No.32271843).
Supplemental Material
Supplemental material for this article is available online.
References
Supplementary Material
Please find the following supplemental material available below.
For Open Access articles published under a Creative Commons License, all supplemental material carries the same license as the article it is associated with.
For non-Open Access articles published, all supplemental material carries a non-exclusive license, and permission requests for re-use of supplemental material or any part of supplemental material shall be sent directly to the copyright owner as specified in the copyright notice associated with the article.