
Abstract
Introduction
BPH is a frequently encountered urological condition in elderly males. According to autopsy-based research, the prevalence of this condition is estimated to be 8% for individuals in their 40 s, 50% for those in their 60 s, and 80% for those in their 90 s, who suffer from BPH-related lower urinary tract symptoms (LUTSs). 1 BPH is characterized by a multifocal, noncancerous proliferation of stromal and epithelial cells within the prostate's transitional zone. This histopathological progression leads to the formation of distinct nodules, inflammation, fibrotic changes, and alterations in smooth muscle function, which may partially or entirely impede the urethra. The consequent obstruction at the bladder outlet, along with enhanced bladder muscle tone and secondary detrusor dysfunction, gives rise to a spectrum of LUTSs.2,3 Research has revealed a correlation between BPH and advanced age, with its occurrence differing among various racial and ethnic groups. 4 Additionally, several other factors are correlated with the development of BPH, such as metabolic syndrome, obesity, a higher body mass index (BMI), dyslipidemia, diabetes, cardiovascular conditions, both acute and chronic prostatic inflammation, the use of antidepressants and calcium channel blockers, sexual function or erectile dysfunction, and elevated levels of prostate-specific antigen. Conversely, there is an inverse relationship observed between BPH and factors such as regular physical activity, moderate alcohol intake, and smoking. 3 While BPH is not a lethal condition, the associated morbidity, along with the potential for complications, can significantly reduce the quality of life and lead to substantial societal and economic burdens. 5
The primary treatment for BPH starts with adjustments to lifestyle and behavioral therapies for those with mild symptoms. In cases where these initial strategies are unsuccessful, medications such as alpha-blockers, 5-alpha reductase inhibitors, anticholinergics, or phosphodiesterase inhibitors may be prescribed, despite potential side effects including dizziness, rhinitis, retrograde ejaculation, and sexual dysfunction.6,7 A subset of patients may endure serious adverse reactions, such as permanent sexual dysfunction and mood swings, a condition associated with post finasteride syndrome. The combination of limited effectiveness and the risk of side effects leads to poor persistence with medical treatments, with many individuals, particularly those with a larger prostate size, seeing no improvement and ultimately considering surgical procedures. 8
TCM is crucial for managing chronic conditions such as inflammation and pain. They are used to treat issues such as chronic prostatitis and BPH, either alone or alongside Western medicines. 9 TCM suggests that the etiology and pathogenesis of BPH are closely related to factors such as kidney deficiency and qi weakness, blood stasis, and damp heat. TCM emphasizes syndrome differentiation and treatment, with the approach of promoting blood circulation to prevent blood stasis, promoting diuresis and unblocking the urinary tract while also nourishing the kidney. However, the complex composition of TCM prescriptions poses a significant challenge for identifying the core bioactive components and elucidating their synergistic mechanisms. Conventional reductionist approaches, focusing on single herbs or compounds, often fail to capture the holistic nature of TCM efficacy. To address this gap, network pharmacology has emerged as a powerful tool to decipher the “multi-component, multi-target” action of TCM by constructing integrative networks linking compounds, targets, and diseases. Molecular docking further allows for the virtual screening of compound-target interactions at the atomic level.
Therefore, this study employs an integrated strategy combining network pharmacology, molecular docking, HPLC quantification, and RSM-guided optimization to identify and validate key quality components from NATCM-registered BPH prescriptions, thereby bridging traditional knowledge with modern analytical and pharmacological techniques. Using “prostatic hyperplasia” as the keyword, a total of 28 prescriptions, including FuFangXueShen capsules, were obtained from the database of Chinese prescriptions. Data mining and analysis were conducted on these prescriptions to confirm the key quality components for BPH treatment. HPLC quantification was then performed on these components across these prescriptions. Subsequently, concentration-ratio optimization of components was conducted, followed by efficacy validation in BPH cell lines. Treatment effects were assessed by monitoring hormone biomarkers. This study can provide new insights for the revision of quality standards for Chinese patent medicines, the discovery of core quality markers, and the development of new Chinese prescriptions. It is important to note that the goal of identifying “key quality components” is not to reduce the holistic efficacy of TCM to a few compounds, but rather to establish scientifically-grounded, measurable chemical markers that can ensure consistency, quality, and batch-to-batch reproducibility of these complex prescriptions—a fundamental challenge in TCM modernization.
Materials and Methods
Data Mining and Network Pharmacology Analysis
Screening Common Targets and key Components from Prescriptions for BPH
The term “function: BPH” was used as the key word to search the Chinese prescription database for all 28 prescriptions registered NATCM. The components of each prescription were retrieved through the Traditional Chinese Medicine System Pharmacology (TCMSP, https://www.tcmsp-e.com/) Analysis Platform. ADME parameters were used to screen out possible key drug molecules, with the oral bioavailability threshold (OB) set at ≥30%, the drug likeness threshold (DL) set at ≥0.18%, and other parameters set to default values. To mitigate the issue of incomplete or inaccurate data inherent in any single database, a multi-source validation strategy was employed: First, active chemical components not covered by TCMSP were cross-referenced and supplemented using the Traditional Chinese Medicine Integrative Pharmacology Research Platform v2.0 (TCMIP, http://www.tcmip.cn/) and by manual curation of relevant pharmacological literature (PubMed searches using herb names and “active components” or “pharmacological activity”). Second, all collected components underwent virtual screening using the SwissADME (http://www.swissadme.ch/) database to evaluate key drug-likeness properties (Lipinski's Rule of Five, bioavailability). Components with poor pharmacokinetic predictions were filtered out. Third, to ensure consistency in downstream analysis, all target protein names obtained from TCMSP were standardized to official gene symbols and UniProt IDs using the UniProt database (https://www.uniprot.org/) mapping service. This multi-step process aimed to enhance the reliability and comprehensiveness of the component-target dataset.
Drug Component-Target-Disease and PPI Network Construction
The target prediction function of the TCMSP database was utilized to identify components that met the criteria for drug ingredients and to obtain the corresponding target proteins. The CTD (Comparative Toxicogenomics Database, http://ctdbase.org) was searched via the keyword “BPH” to identify BPH-related genes. The genes were then sorted by inference score, and a gene list with an inference score of 30 or above was selected. Finally, the target protein list predicted by the TCMSP database was intersected with the gene list with an inference score of 30 or above in the CTD database to obtain a screened target protein list. Target protein lists predicted from TCMSP for all components were initially pooled. Concurrently, BPH-related genes were obtained from the CTD database. To integrate these two sources and eliminate redundancy, all protein/gene identifiers from both lists were converted to their corresponding “official human gene symbols” using the ID mapping tool in the UniProt database. Duplicate entries (ie, the same gene symbol appearing from multiple component predictions or from both TCMSP and CTD sources) were consolidated into a single, non-redundant entry. This unified and deduplicated gene list was then used as the input for the subsequent PPI network analysis in STRING, ensuring that each node in the network represented a unique gene product and preventing artificial inflation of network connectivity due to duplicate entries.
The obtained target proteins were uploaded to the STRING database (https://string-db.org/) for protein-protein interaction enrichment analysis. The species was set to “Homo sapiens”, free nodes were hidden, and the minimum interaction requirement score was set to the highest confidence (0.900) to construct the PPI (Protein-Protein Interaction, PPI) network diagram. This conservative approach may exclude some lower-confidence but biologically relevant interactions, potentially omitting peripheral yet meaningful targets. To partially mitigate this, the subsequent MCODE and CytoNCA analyses within Cytoscape were employed to identify densely connected modules and central hubs, which can capture key regulatory relationships even within a high-confidence subnet. Therefore, the PPI network diagram was analyzed and optimized using Cytoscape 3.9.1. The MCODE plug-in (molecular complex detection) in Cytoscape was used to identify the modules with the strongest interaction associations in the protein interaction network as the PPI core network. Additionally, a network diagram of Chinese medicinal components, known as the “herb-ingredient-target” network diagram, was constructed.
To systematically investigate the interplay of therapeutic targets for BPH and identify pivotal protein nodes, we employed the following analytical workflow. First, putative target proteins identified from multiple prescriptions were systematically uploaded to the STRING database, generating 28 PPI network maps. These networks were subjected to comprehensive analysis and topological optimization via Cytoscape 3.9.1. The CytoNCA plugin was subsequently implemented to calculate the degree centrality (connectivity degree) for each protein node, providing a quantitative measure of each protein's topological significance within the network.
A visual hierarchy was established by proportionally scaling node sizes and color gradients according to degree values, with high-connectivity nodes rendered more prominent to facilitate rapid identification of critical hubs. Proteins were subsequently ranked in descending order of their degree centrality to systematically screen core therapeutic targets. After deduplication and integration across all 28 prescriptions, a consolidated set of key targets was identified as the principal mediators of BPH-1 cell regulation through multi-herbal interventions.
Core Molecule-Target Docking
Based on the degree centrality analysis of the integrated “herb-ingredient-target” and PPI core networks, the top-ranked small molecules (quercetin, kaempferol, β-sitosterol, luteolin) and target proteins (TP53, AKT1, MAPK1, MAPK3, STAT3, JUN, SRC, HSP90AA1, RELA) were selected for molecular docking. Molecules and targets were chosen based on their “highest node degree values”, indicating their maximal connectivity and presumed central role in the network pharmacology model. 3D structures in SDF format were downloaded from PubChem. Structures were protonated at pH 7.4 and energy-minimized using the MMFF94 force field in OpenBabel Protein Data Bank (https://www.rcsb.org/). The selection criteria for PDB structures were: (1) resolution ≤ 2.5 Å, (2) human origin, (3) presence of a co-crystallized ligand in the active/binding site. Prior to docking, protein structures were prepared by removing water molecules, adding hydrogen atoms, assigning protonation states at pH 7.4, and optimizing side-chain conformations using the “QuickPrep” module in MOE.
Molecular docking simulations were performed using Molecular Operating Environment (MOE) software. The binding pocket for each target was defined as the coordinates of the original co-crystallized ligand, with a margin of 4.5 Å. Docking was carried out using the “Triangle Matcher” placement method and “London dG” scoring function for the initial pose generation. The top 30 poses per ligand were retained and further refined using the “Forcefield” refinement algorithm and re-scored with the “Affinity dG” scoring function, which estimates the free energy of binding (kcal/mol). For each ligand-target pair, the pose with the most favorable (most negative) Affinity dG score was selected as the predicted binding mode. Protein-ligand complexes with an Affinity dG score < −5.0 kcal/mol were considered to have stable binding potential. Additionally, the formation of specific hydrogen bonds, π-π stacking, or hydrophobic interactions within the binding pocket was analyzed visually using MOE's ligand interaction module.
To validate the accuracy of our docking protocol, we performed a re-docking experiment for each target. The native co-crystallized ligand was extracted and re-docked into its original binding site. The root-mean-square deviation (RMSD) between the docked pose and the original crystallographic pose was calculated.
Experimental Verification
Experimental Materials
Quercetin (≥98%, HPLC), Luteolin (≥98%, HPLC), Kaempferol (≥98%, HPLC), β-Sitosterol (≥98%, HPLC) were purchased from Shanghai Yuanye Biotechnology Co.,Ltd;. CCK8 (Cell Counting Kit-8) was obtained from Beijing Solarbio Science & Technology Co., Ltd; Dulbecco's modified Eagle's medium (DMEM) with high glucose, RPMI-1640 medium, fetal bovine serum (FBS), penicillin‒-streptomycin solution, trypsin, and PBS buffer were obtained from Shanghai VivaCell Biosciences Ltd Human estradiol (E2), rat prostate specific antigen (PSA) and double hydrogen testosterone (DHT) Elisa kits were purchased from Kindstar Globalgene Technology, Inc.; A nitric oxide synthase (NOS) activity assay kit was obtained from Nanjing Jiancheng Biotechnology Co., Ltd The WPMY-1 cells were provided by the American Type Culture Collection (ATCC), and the ATCC No is CBP60756. While the BPH-1 cells were purchased from Procell Life Science & Technology Co.Ltd, and the accession No. is PC-H2024029913, 1 × 10⁶. Both cell lines were authenticated by short tandem repeat (STR) profiling within the last three years and were routinely tested negative for mycoplasma contamination using a PCR-based detection kit. Specifically, the BPH-1 cells and WPMY-1 cells were authenticated by reputable third-party service providers: Procell Life Science & Technology Co., Ltd and the National collection of authenticated cell cultures, respectively. And the authentication certificate is available upon request. This authentication complies with the ATCC Cell Line Authentication Testing Recommendations. Furthermore, our laboratory routinely monitors cell lines for mycoplasma contamination using a PCR-based detection kit, and confirmed absence of contamination.
The 26 types of Chinese prescriptions: FuFangXueShen capsule (FFXS capsule, Z20153025), QianLieBeiXi capsule (QLBX capsule, Z20025028), QianLieLongBiTong tablet (QLLBT tablet, Z20090291), QianLieLongBiTong capsule (QLLBT capsule, Z20025304), LongJinTongLin capsule (LJTL capsule, Z20025499), ZeGuiQuanShuang tablet (ZGQS tablet, Z20205006), QianLieXin capsule (QLX capsule, Z10950010), WengliTong capsule (WLT capsule, Z20054027), QianLieGuiHuang tablet (QLGH tablet, Z19991099), QianLieShuTong capsule (QLST capsule, Z20027140), YangHuoSanChuan granules (YHSC granules, B20020727), QianLieTong tablet (QLT tablet, Z44022456), QianLieBiErTongShuan (QLBETS, Z20020130), GuiZhiFuLing capsule (GZFL capsule, Z10950005), WenShenQianLie capsule (WSQL capsule, Z20025340), QianLieTongShuan (QLTS, Z20044424), XiPaYiMaiZiBiZi capsule (XPYMZBZ capsule, Z20050766), LongBiShu capsule (LBS tablet, Z10960007), GuHanYangShengJing oral liquid (QLGHGHYSJ, Z43020746), QianLieShu pill (QLS pill, Z10910009), XiaLiQi capsule (XLQ capsule, Z20123085), PuLeAn tablet (PLA tablet, Z34021056), JinLiYou soft capsule (JLY soft capsule, Z20020010), QianLieShuLe tablet (QLSL tablet,Z20060095), NiaoSaiTong capsule (NST capsule, Z20060299), and NiaoSaiTong tablet (NST tablet, Z20043862), were purchased separately from their respective manufacturers.
The initial network pharmacology analysis encompassed all 28 NATCM-registered prescriptions to capture the full spectrum of potential mechanisms. However, for the subsequent experimental quantification and validation phase, we applied an additional inclusion criterion: the prescription must contain detectable levels of at least one of the four key quality components (quercetin, luteolin, kaempferol, or β-sitosterol) as predicted by the network. Two prescriptions (LZ Tablet and LBT Capsule) were excluded from the experimental analysis because their predicted content of these four key components was below the quantifiable limit based on our preliminary screening, and they did not show strong connectivity to the core target network. The principal distinctions among the 28 prescriptions are reflected in their herbal compositions, the relative concentrations of bioactive constituents, and their corresponding therapeutic indications.
Sample Preparation and UPLC Analysis
For the simultaneous quantification of the four specific key components across diverse formulations, this standardized extraction method was adopted to ensure consistency and comparability of the analytical results. Briefly, the 50 g of commercially 26 Chinese prescriptions preparation product was added to a 1500 mL Soxhlet extractor. An 80% ethanol aqueous solution was added at a material-liquid mass ratio of 1:20. The mixture was heated and refluxed for 4 h. The insoluble matter was filtered out, and the solvent was removed in a rotary evaporator to obtain a sample to be tested. The sample to be tested (0.1-0.5 mg) was dissolved in 10 mL of 80 wt% methanol aqueous solution and fully dissolved for further research.
The analysis was performed with an Agilent 1260 Infinity system with a Poroshell 120 EC-C18 column (4 µm, 4.6 mm × 150 mm). The column temperature was set to 40 °C. The mobile phase consisted of solvent A (0.1% formic acid in water) and solvent B (methanol). For QianLieShu pill and XialiQi capsule, the gradient program for mobile phase B was as follows: 0–5 min, 50%; 5–10 min, 65%; 10–14.9 min, 100% and 15th minute, 50%. For the other prescriptions, the gradient program for mobile phase B was as follows: 0–10 min, 50%; 10.1–25 min, 100%; and 25.1–30 min, 50%, with a flow rate of 0.35 mL/min and an injection volume of 2 µL.
The HPLC method was validated for the quantification of the four components in terms of linearity and accuracy. Calibration curves were constructed with six concentration levels. Intra-day and inter-day precision (expressed as RSD) were evaluated by analyzing quality control samples at low, medium, and high concentrations six times within a day and on three consecutive days.
Cell Culture
WPMY-1 cells and BPH-1 cells were cultured in DMEM medium and RPMI 1640 medium, respectively. Both cell lines were incubated at 37 °C in a humidified atmosphere with 5% CO2, using media supplemented with 10% FBS and 1% penicillin/streptomycin. The cells were allowed to adhere and grow for 24 h before being treated with various samples. All experimental trials were independently performed with no fewer than three duplicates.
Cell Viability
CCK8 tests were used to assess relative cell viability. WPMY-1 cells and BPH-1 cells were cultured in 96-well plates for 24 h. In the experimental group, both cell lines were grown with various doses of quercetin (40, 80, 160 µM), luteolin (22.5, 45, 90 µM), kaempferol (65, 130, 260 µM), β-Sitosterol (40, 80, 160 µM), and their combinations over 24 h. After rinsing twice with prewarmed PBS, 100 μL of fresh medium or 10 μL of CCK8 working solution was added, and the mixture was incubated for 4 h. Cells treated with medium containing an equivalent volume of the compound vehicle (eg, DMSO, final concentration < 0.1%) served as the vehicle control. A positive control for cytotoxicity (10 µM staurosporine) was included in each experiment. A blank control (medium only, without cells) was included on every plate to account for background absorbance. The relative cell viability was then assessed by measuring the absorbance of CCK8 at 450 nm. To validate the assay's performance in our system, we confirmed the linear relationship between cell number and absorbance within the seeding density range used. The percentage of cellular viability was determined by the following calculation:
Key Components’ Pharmacological Effects Optimization by RSM
Using network pharmacology analysis, we identified and analyzed the types and contents of the main key ingredients in 28 prescriptions through HPLC. Based on the pharmacological potency (EC50) of each component, we selected three concentrations for each ingredient, including the EC50 and one concentration on either side of it, for experimental analysis. The parameters were evaluated, and the process was optimized using response surface methodology (RSM) in conjunction with a Box-Behnken experimental design. This method encompasses four numeric factors, each at three distinct levels. The design consisted of 29 experiments, including five replicates at the central points. The independent variables in this study were the concentrations of quercetin (X1, 40-120 µM), luteolin (X2, 22.5-67.5 µM), kaempferol (X3, 65-195 µM), and β-Sitosterol (X4, 40-120 µM). The parameters were normalized by coding the independent variables, which were ranged from +1 to −1 to evenly influence the selected responses. The coding process and the evaluation of the experimentally obtained responses are detailed in the supplementary file accompanying this manuscript. The coded and natural values of the chosen independent variables in the constructed Box-Behnken model are presented in Table 1. The toxicology and therapeutic effects of each combination prescriptions were subsequently evaluated thoroughly.
Parameter Range and Independent Variable Level.

ELISA
The concentrations of PSA, DHT, E2, NO, and NOS in BPH-1 cells were quantified via ELISA kits, following the manufacturer's guidelines. The optical density was then measured at a designated wavelength with a microplate reader.
Statistical Analysis
In this experiment, one-way ANOVA and two-way ANOVA were conducted using GraphPad Prism 8 for data analysis and visualization. The data were presented as means ± standard deviations, and a p < 0.05 was considered statistically significant. It's important to note that all experiments were independently repeated a minimum of three times unless otherwise indicated. Statistical significance was denoted as follows: * for p < 0.05, ** for p < 0.01, *** for p < 0.001 and **** for p < 0.0001.
Results
Data Mining and Network Pharmacology Analysis
Herbs in Prescriptions for Treating BPH
Database analysis revealed that 28 TCM prescriptions for the treatment of BPH utilized a total of 112 Chinese medicinal ingredients, as depicted in Figure 1.
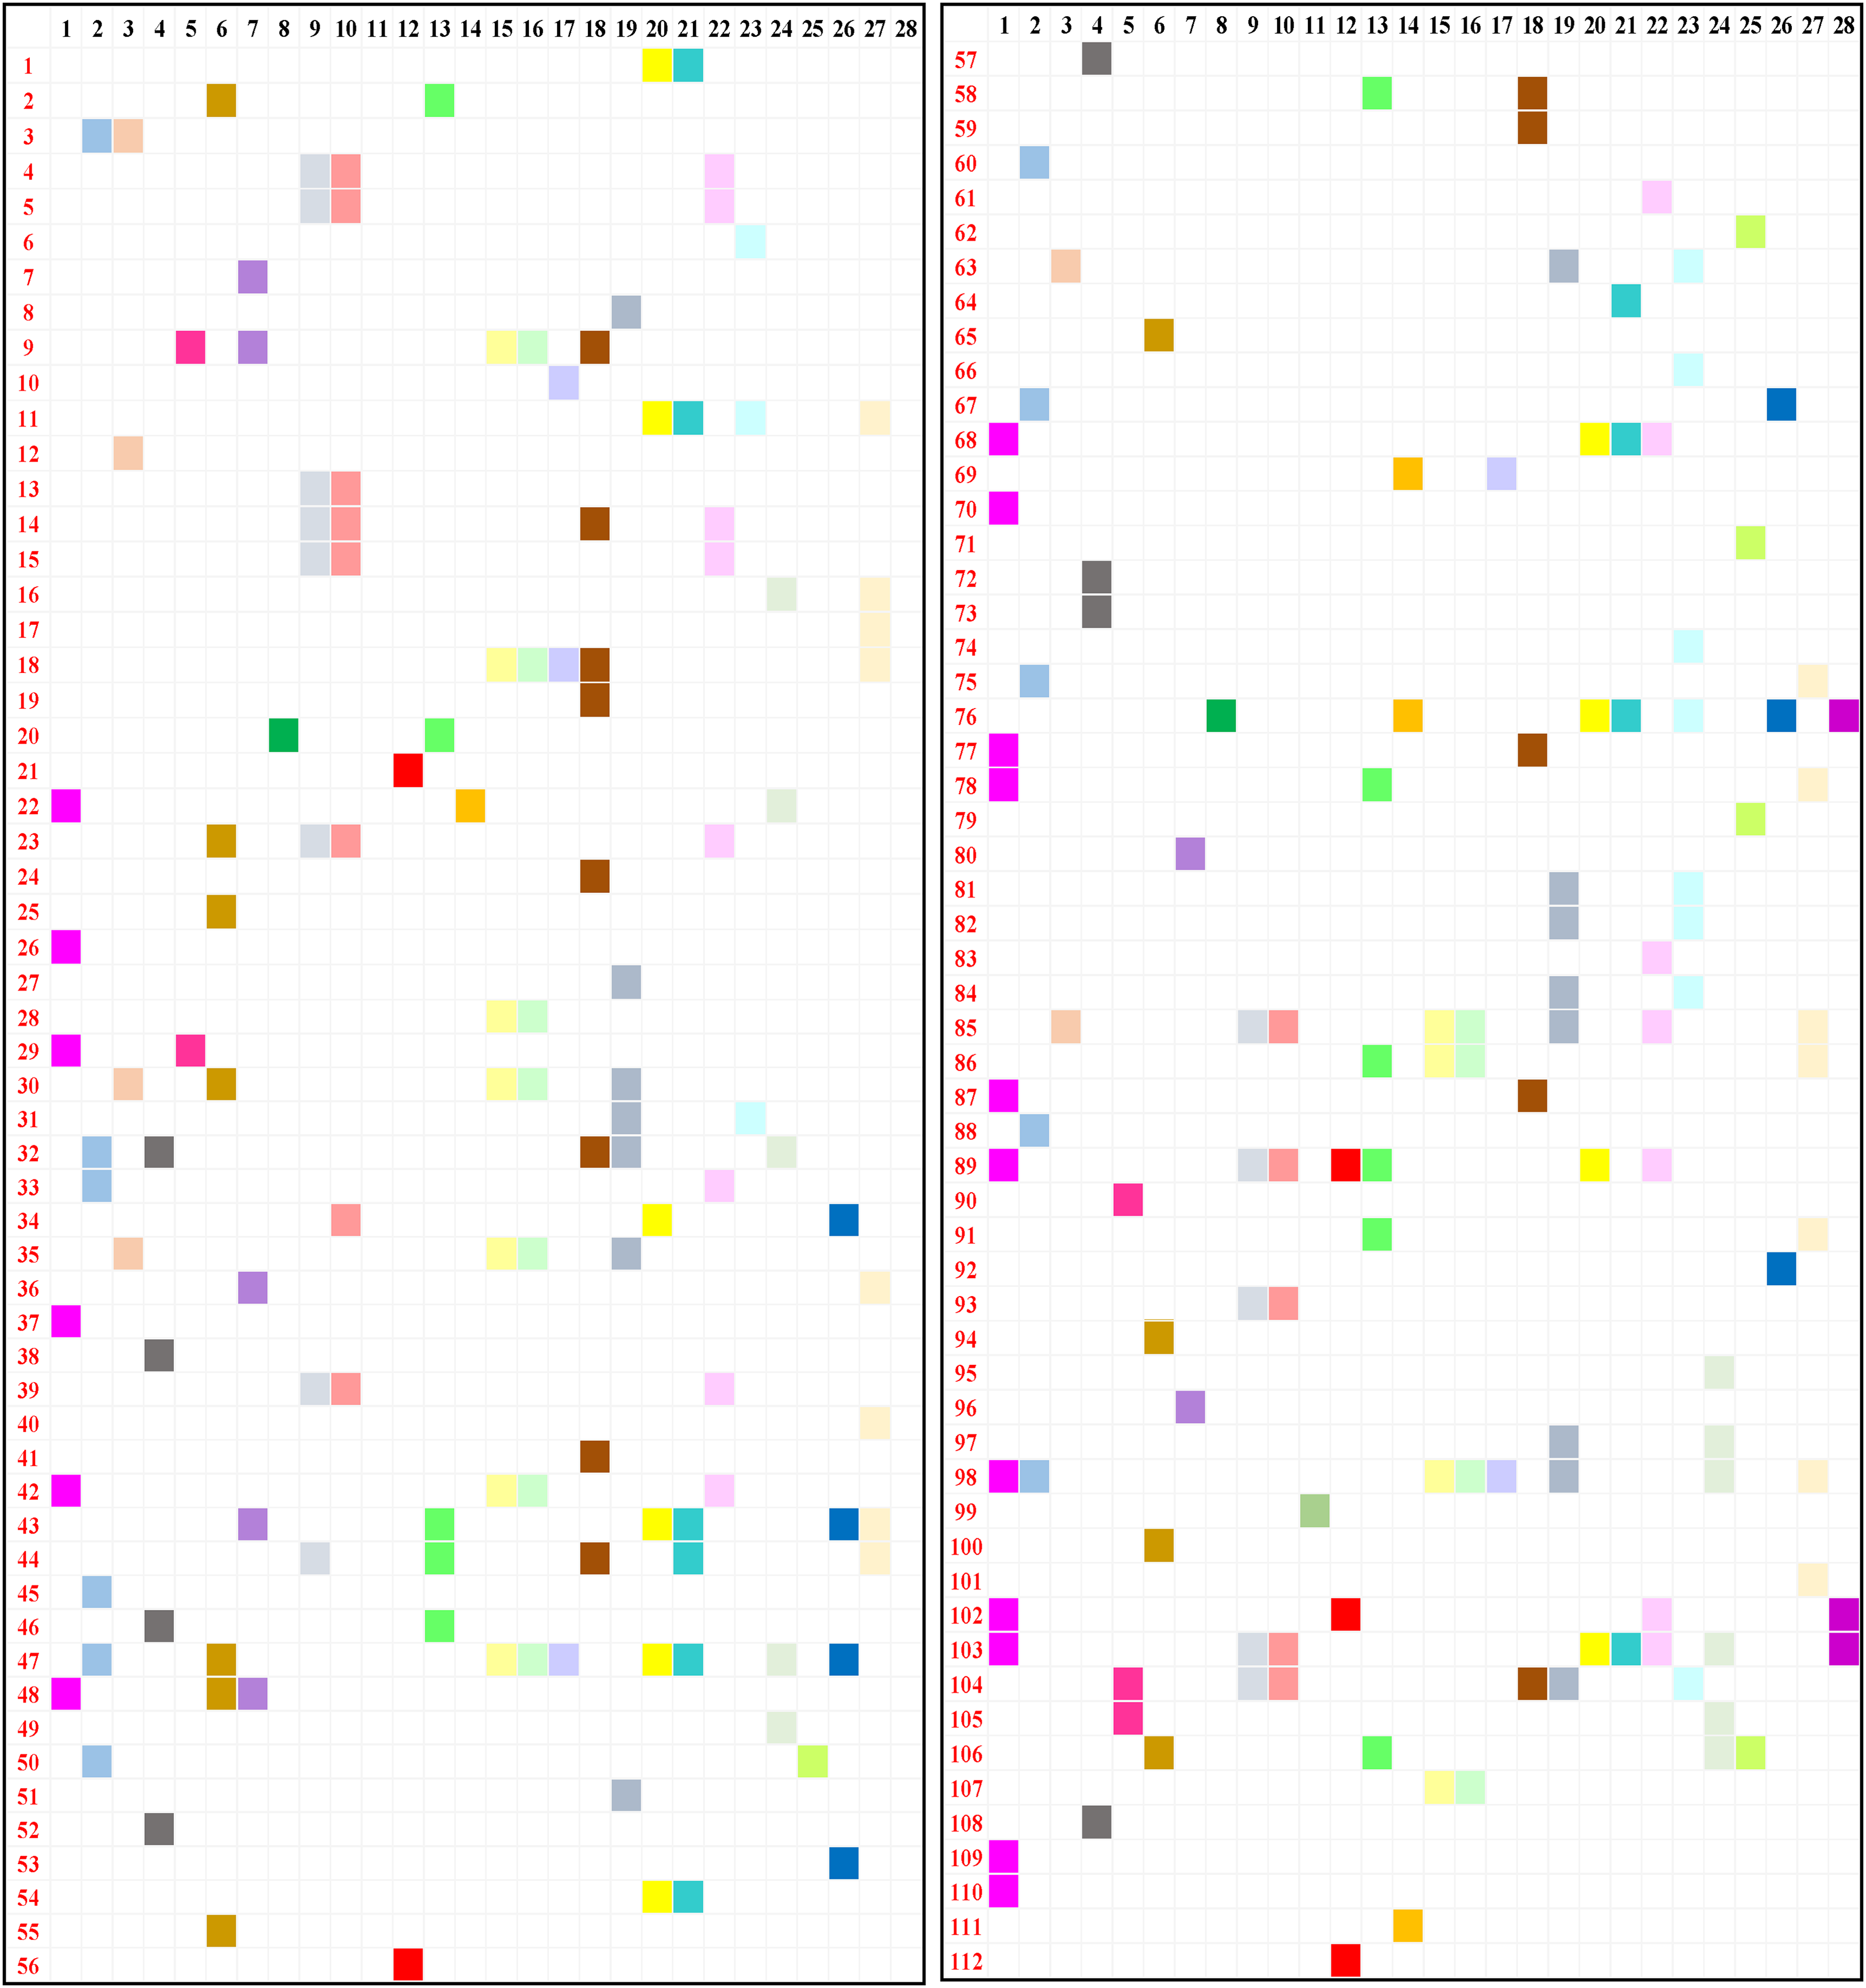
Distribution map of 112 herbs in 28 prescriptions. The black numbers represent 28 prescriptions (the detailed information was listed in supplementary as Text S1); the red numbers represent 112 herbs (the detailed information was listed in supplementary as Text S2).
Components in Prescriptions for Treating BPH
Based on the therapeutic effects of BPH, a total of 596 effective chemical components were obtained through TCMSP screening of 112 kinds of TCM prescriptions, among which: There were 177 flavonoids, 110 terpenoids, 76 phenols, 59 steroidal components, 47 alkaloids, 25 esters, 23 acids, and 10 amino acids.
The corresponding genes of the target proteins for treating BPH screened from 28 prescriptions were imported into Cytoscape 3.9.1 software to draw a network diagram of the Chinese medicine components, namely the “drug-ingredient-target” network diagram, from which the top 10 chemical components with the highest degree values were obtained. A total of 75 components were obtained. These components include the following: Flavonoids: quercetin, kaempferol, luteolin, isorhamnetin, baicalein, (R)-naringenin, acacetin, nobiletin, anhydroicaritin, wogonin, corymbosin, morin, 3-Methylkempferol, (+)-taxifolin, areapillin, myricetin, chryseriol, corymbosin, apigenin; Isoflavones: formononetin, calycosin, genistein, daidzein, biochanin, betavulgarin, 7-Methoxy-2-methylisoflavone; L-epicatechin, (+)-catechin, procyanidin B1), sterols: β-sitosterol, stigmasterol, hederagenin, α3-Sitosterol, ursolic acid, diosgenin, oleanolic acid, campesterol, cholesterol; Anthraquinone compound: pelargonidin, zhebeiresinol, 6-Methoxyl-2-acetyl-3-methyl-1,4-naphthoquinone-8-O-β-D-glucopyranoside, 2-Methoxy-9,10- dihydrophenanthrene-4,5-diol, tanshinone IIA, aloe-emodin, toralactone, emodin, 7-O-Methylisomucronulatol, ellagic acid, Glabridin, licochalcone B, cryptotanshinone, Hydroxybenzoic acids: tyrosol, melilotate, cinnamaldehyde, 5-O-Coumaroylquinic acid, cinnamic acid, eugenol; Alkaloids: peimisine, 4'-Methyl-N-methylcoclaurine, fumarine, uracil, palmatine, berberine sulfate, berberrubine; Amino acids: L-aspartic acid, α-glycine, D-alanine; Fatty acids: l-monolinolein, arachidonic acid, stearic acid, oxalic acid. β-carotene, α-cedren.
Key Targets of Prescriptions for Treating BPH
The target proteins obtained from the 28 prescriptions were uploaded to the STRING database for PPI enrichment analysis. A network interaction diagram consisting of nodes and edges was obtained, and then the top 10 core genes with the highest degree values were identified. There were 18 genes in total, namely TP53, AKT1, MAPK1, MAPK3, MAPK14, RELA, TNF, IL6, FOS, MYC, ESR1, RXRA, STAT3, CTNNB1, JUN, HSP90AA1, SR1, and SRC. These targets exhibited marked topological centrality across multiple herbal regulatory networks, suggesting their pivotal regulatory roles in BPH pathogenesis.
Molecular Docking
The 28 prescriptions were analyzed for node connectivity in the “medicine-ingredient-target” network and the PPI core network. The SDF format files of the key small molecule molecular structures were downloaded from the PubChem database, and the corresponding target protein files were downloaded from the PDB protein database. The MOE software verified the molecular docking possibility between the target and key small molecule, and a node connectivity analysis of the medicine-ingredient-target network was performed to obtain the top three chemical molecules and targets with the highest degree values, which were identified as the key small molecules and targets for treating prostate hyperplasia. Among them, 9 target proteins were associated with 26 prescriptions: TP53, AKT1, JUN, MAPK1, MAPK3, STAT3, SRC, HSP90AA1, and RELA. Quercetin appeared as a key small molecule in 26 prescriptions and could bind to all 9 target proteins, as depicted in Figure 2. Kaempferol is a key small molecule in 23 prescriptions and can bind to all 9 target proteins. β-sitosterol appeared as a key small molecule in 14 prescriptions and can bind to TP53, AKT1, MAPK1, MAPK3, STAT3, JUN, and SRC target proteins. Luteolin is a key small molecule in 12 prescriptions and could bind to TP53, SRC, MAPK3, AKT1, HSP90AA1, RELA, JUN, and STAT3 target proteins. Detailed docking scores, RMSD values from validation, and key interaction analyses are provided in Supplementary Table S1. An RMSD value of < 2.0 Å was considered a successful validation, indicating the protocol's reliability in reproducing known binding geometries. All our validation runs resulted in RMSD values between 0.8 and 1.7 Å.

Docking map of 4 key components with 9 core target proteins. The central four structures represent the simplified forms of quercetin, kaempferol, luteolin, and β-sitosterol, respectively. These structural diagrams include 9 target proteins: TP53, AKT1, MAPK1, MAPK3, STAT3, JUN, SRC, HSP90AA1, and RELA.
Experimental Verification
The Amounts of Key Components
Unlike medications composed of a single chemical entity, herbal remedies are distinguished by their complex composition, featuring numerous constituents that collectively interact with various targets to elicit therapeutic outcomes. 10 Consequently, for the development of a more thorough assessment approach for consistency, identifying a suite of components that are consistently present in the medicine in significant amounts to serve as reference markers is essential. 11 We acquired the 26 prescriptions for analysis via HPLC. Peak identities of quercetin, luteolin, kaempferol, and β-sitosterol in sample chromatograms were confirmed by co-injection with authentic standards, showing peak enhancement at the same retention times. Furthermore, the UV spectra of the peaks in the samples were compared with those of the standards using the DAD system. The match factors (correlation coefficients) were all greater than 0.998, providing additional confirmation of peak identity. The HPLC results for the blended standard solutions are depicted in Figure 3a and 3b. A review of the chromatograms revealed that at a wavelength of 360 nm, the three standard components were effectively separated, with the elution sequence occurring at 4.707 min for quercetin, 5.747 min for luteolin, and 8.207 min for kaempferol. At 200 nm, β-sitosterol displayed peak absorption at 17.773 min. Figure 3c and 3d displayed the HPLC chromatograms of a sample, exemplified by FuFangXueShen capsule. The HPLC method validation results, including linearity, limits of detection (LOD), limits of quantification (LOQ), accuracy (recovery), and precision (intra-day and inter-day RSD), are summarized in Table 2.
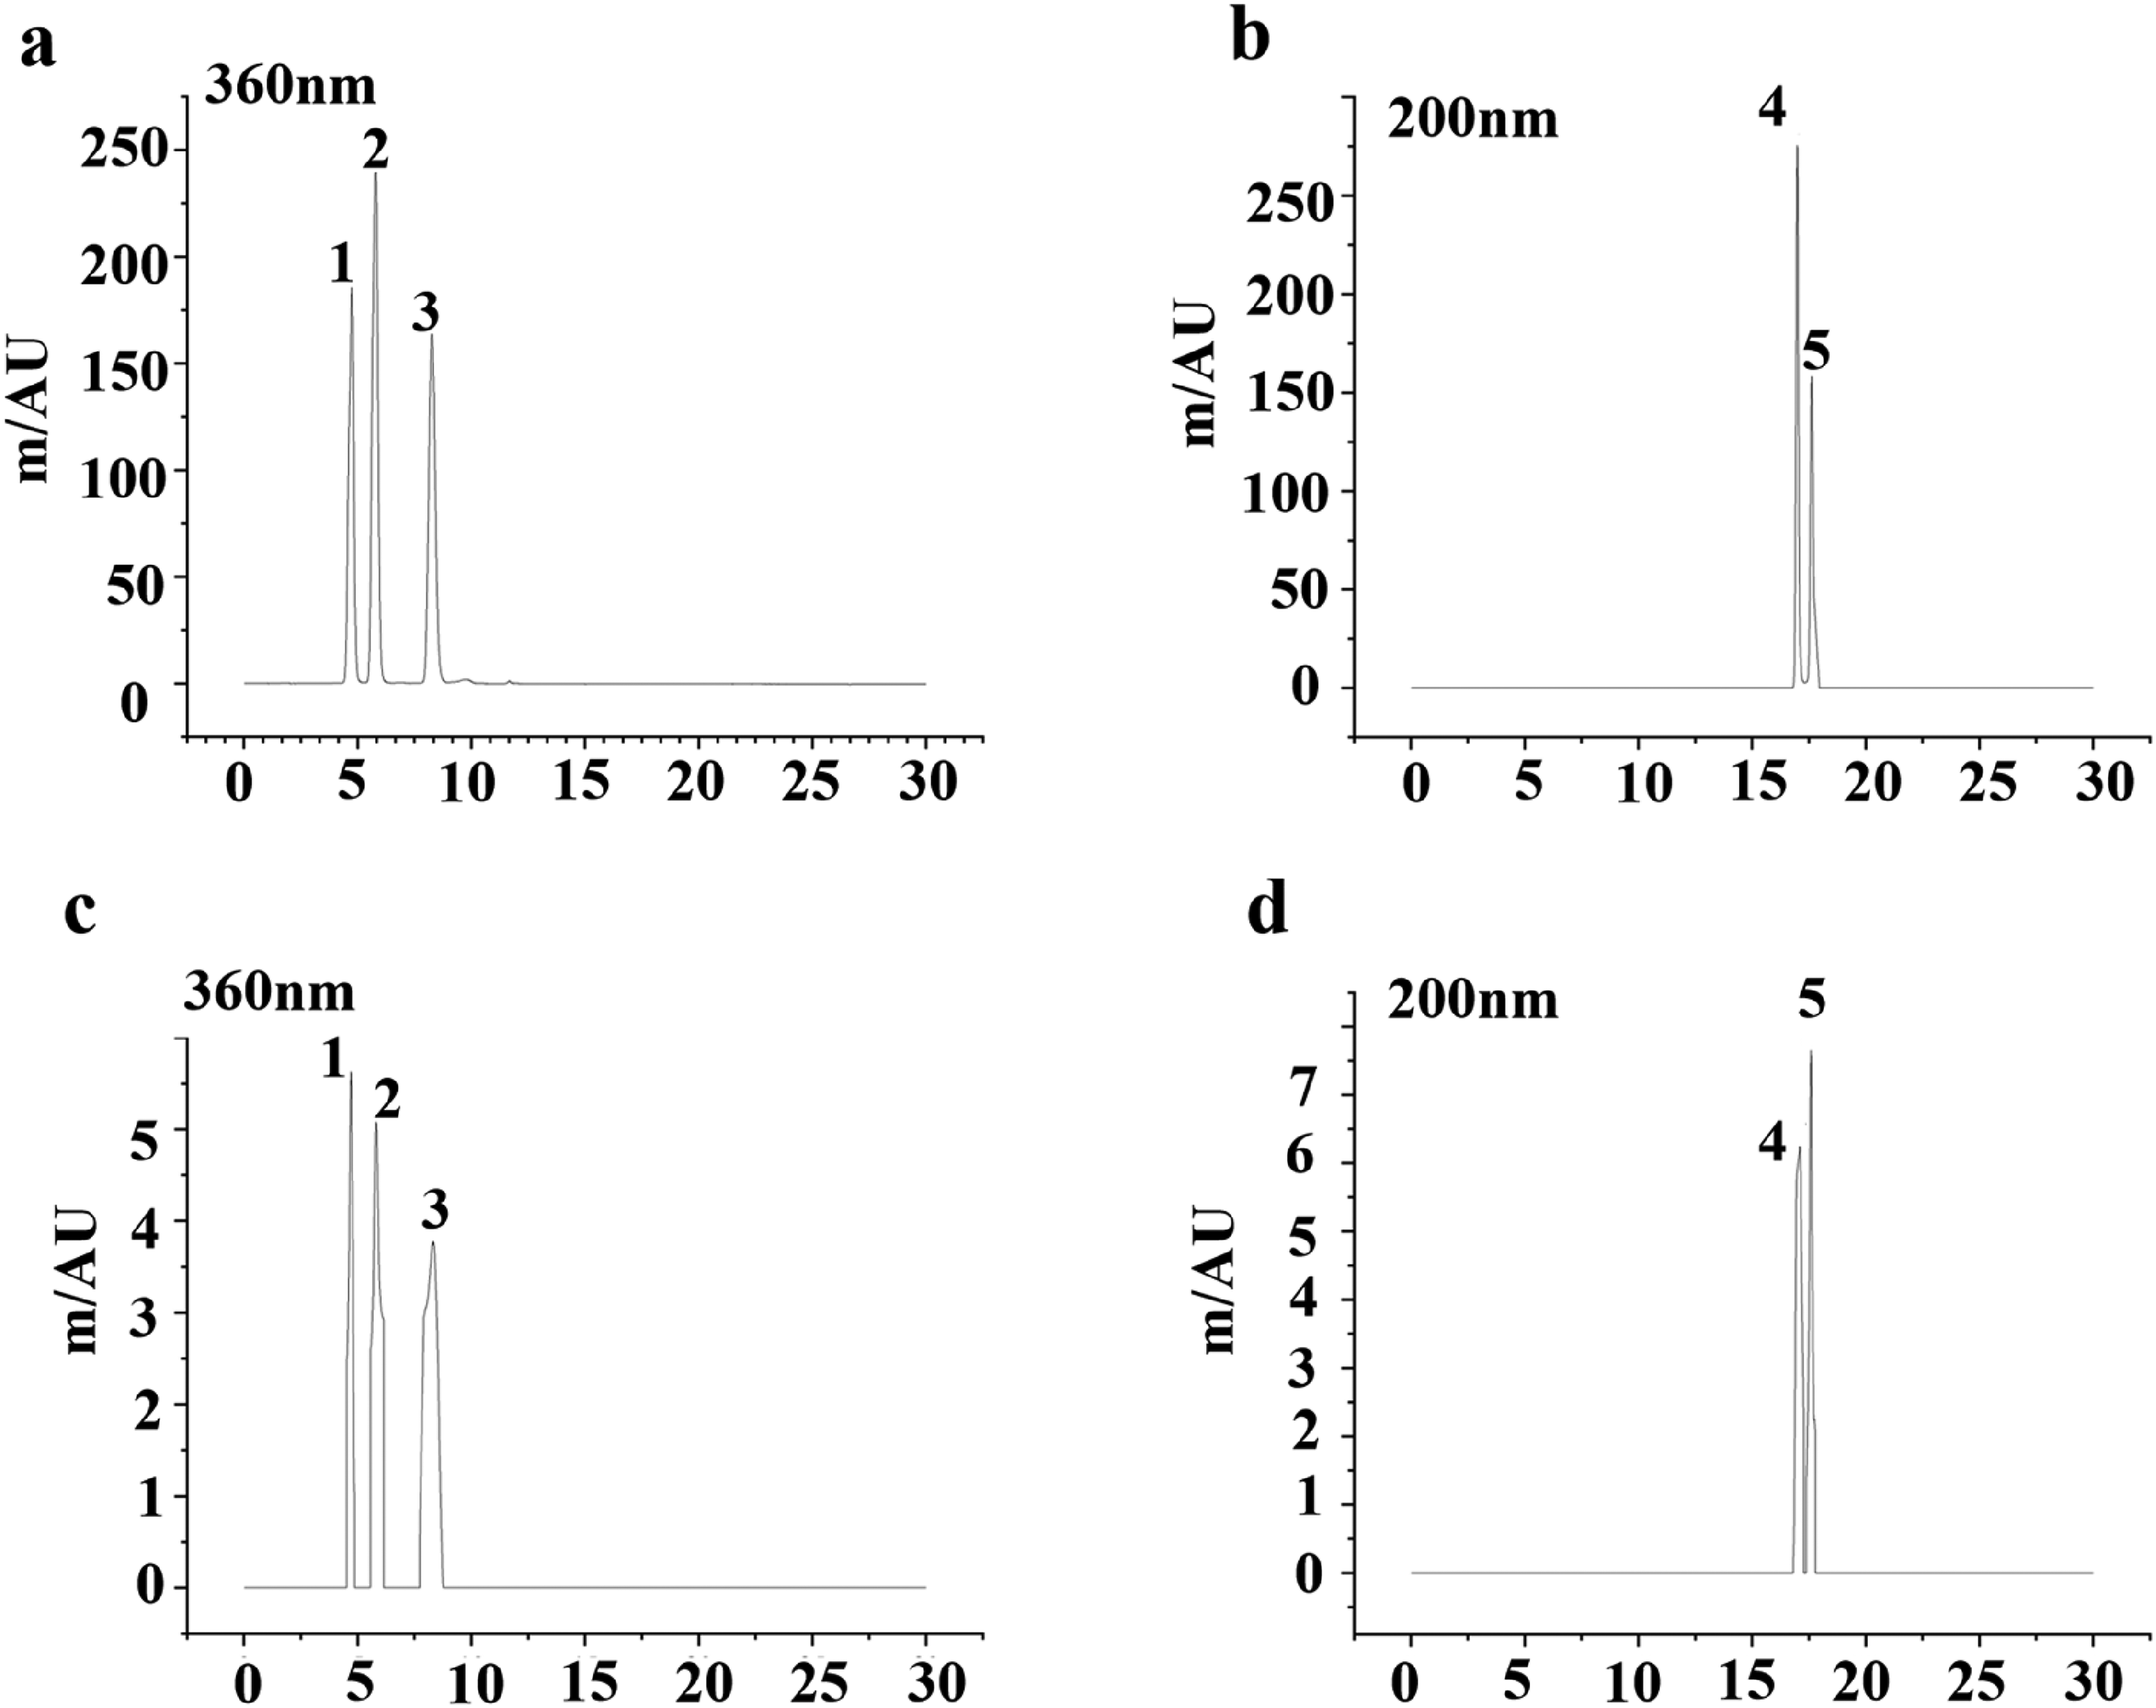
HPLC identification of standards and sample (exemplified by FuFangXueShen capsule). (a) Standards at 360 nm chromatogram; (b) Standards 200 nm chromatogram; (c) Sample at 360 nm; (d) Standards 200 nm chromatogram; 1, quercetin (4.707 min); 2, luteolin (5.747 min); 3, kaempferol (8.207 min); 4, stigmasterol (17.290 min); 5, β-Sitosterol (17.773 min).
The Validation Data Equations of the 4 Components.

RSD = Relative Standard Deviation; LOD = Limit of Detection; LOQ = Limit of Quantitation.
Three batches of solutions were prepared for each of the prescription samples. The contents of quercetin, luteolin, kaempferol, and β-sitosterol in the 26 prescriptions were calculated based on the standard curves of the four components, as presented in Table 3. Across the 26 prescriptions, the contents of 4 components were determined (quercetin: 0.003∼0.192μmol/g; luteolin: 0.007∼0.150μmol/g; kaempferol: 0.007∼0.535μmol/g; β-sitosterol: 0.025∼0.619 μmol/g), respectively. In a few prescriptions, the content was below the detection limit, which indicate that these components are present at very low concentrations in those particular prescriptions. Furthermore, the relative ratios of the four components were calculated relative to β-sitosterol (assigned as 1) and are listed in Table 3.
The Amounts (μmol/g) and Ratio (with β-sitosterol as the Reference) of Quercetin, Luteolin, Kaempferol and β-sitosterol in the 26 TCMs.

Cell Viabllity
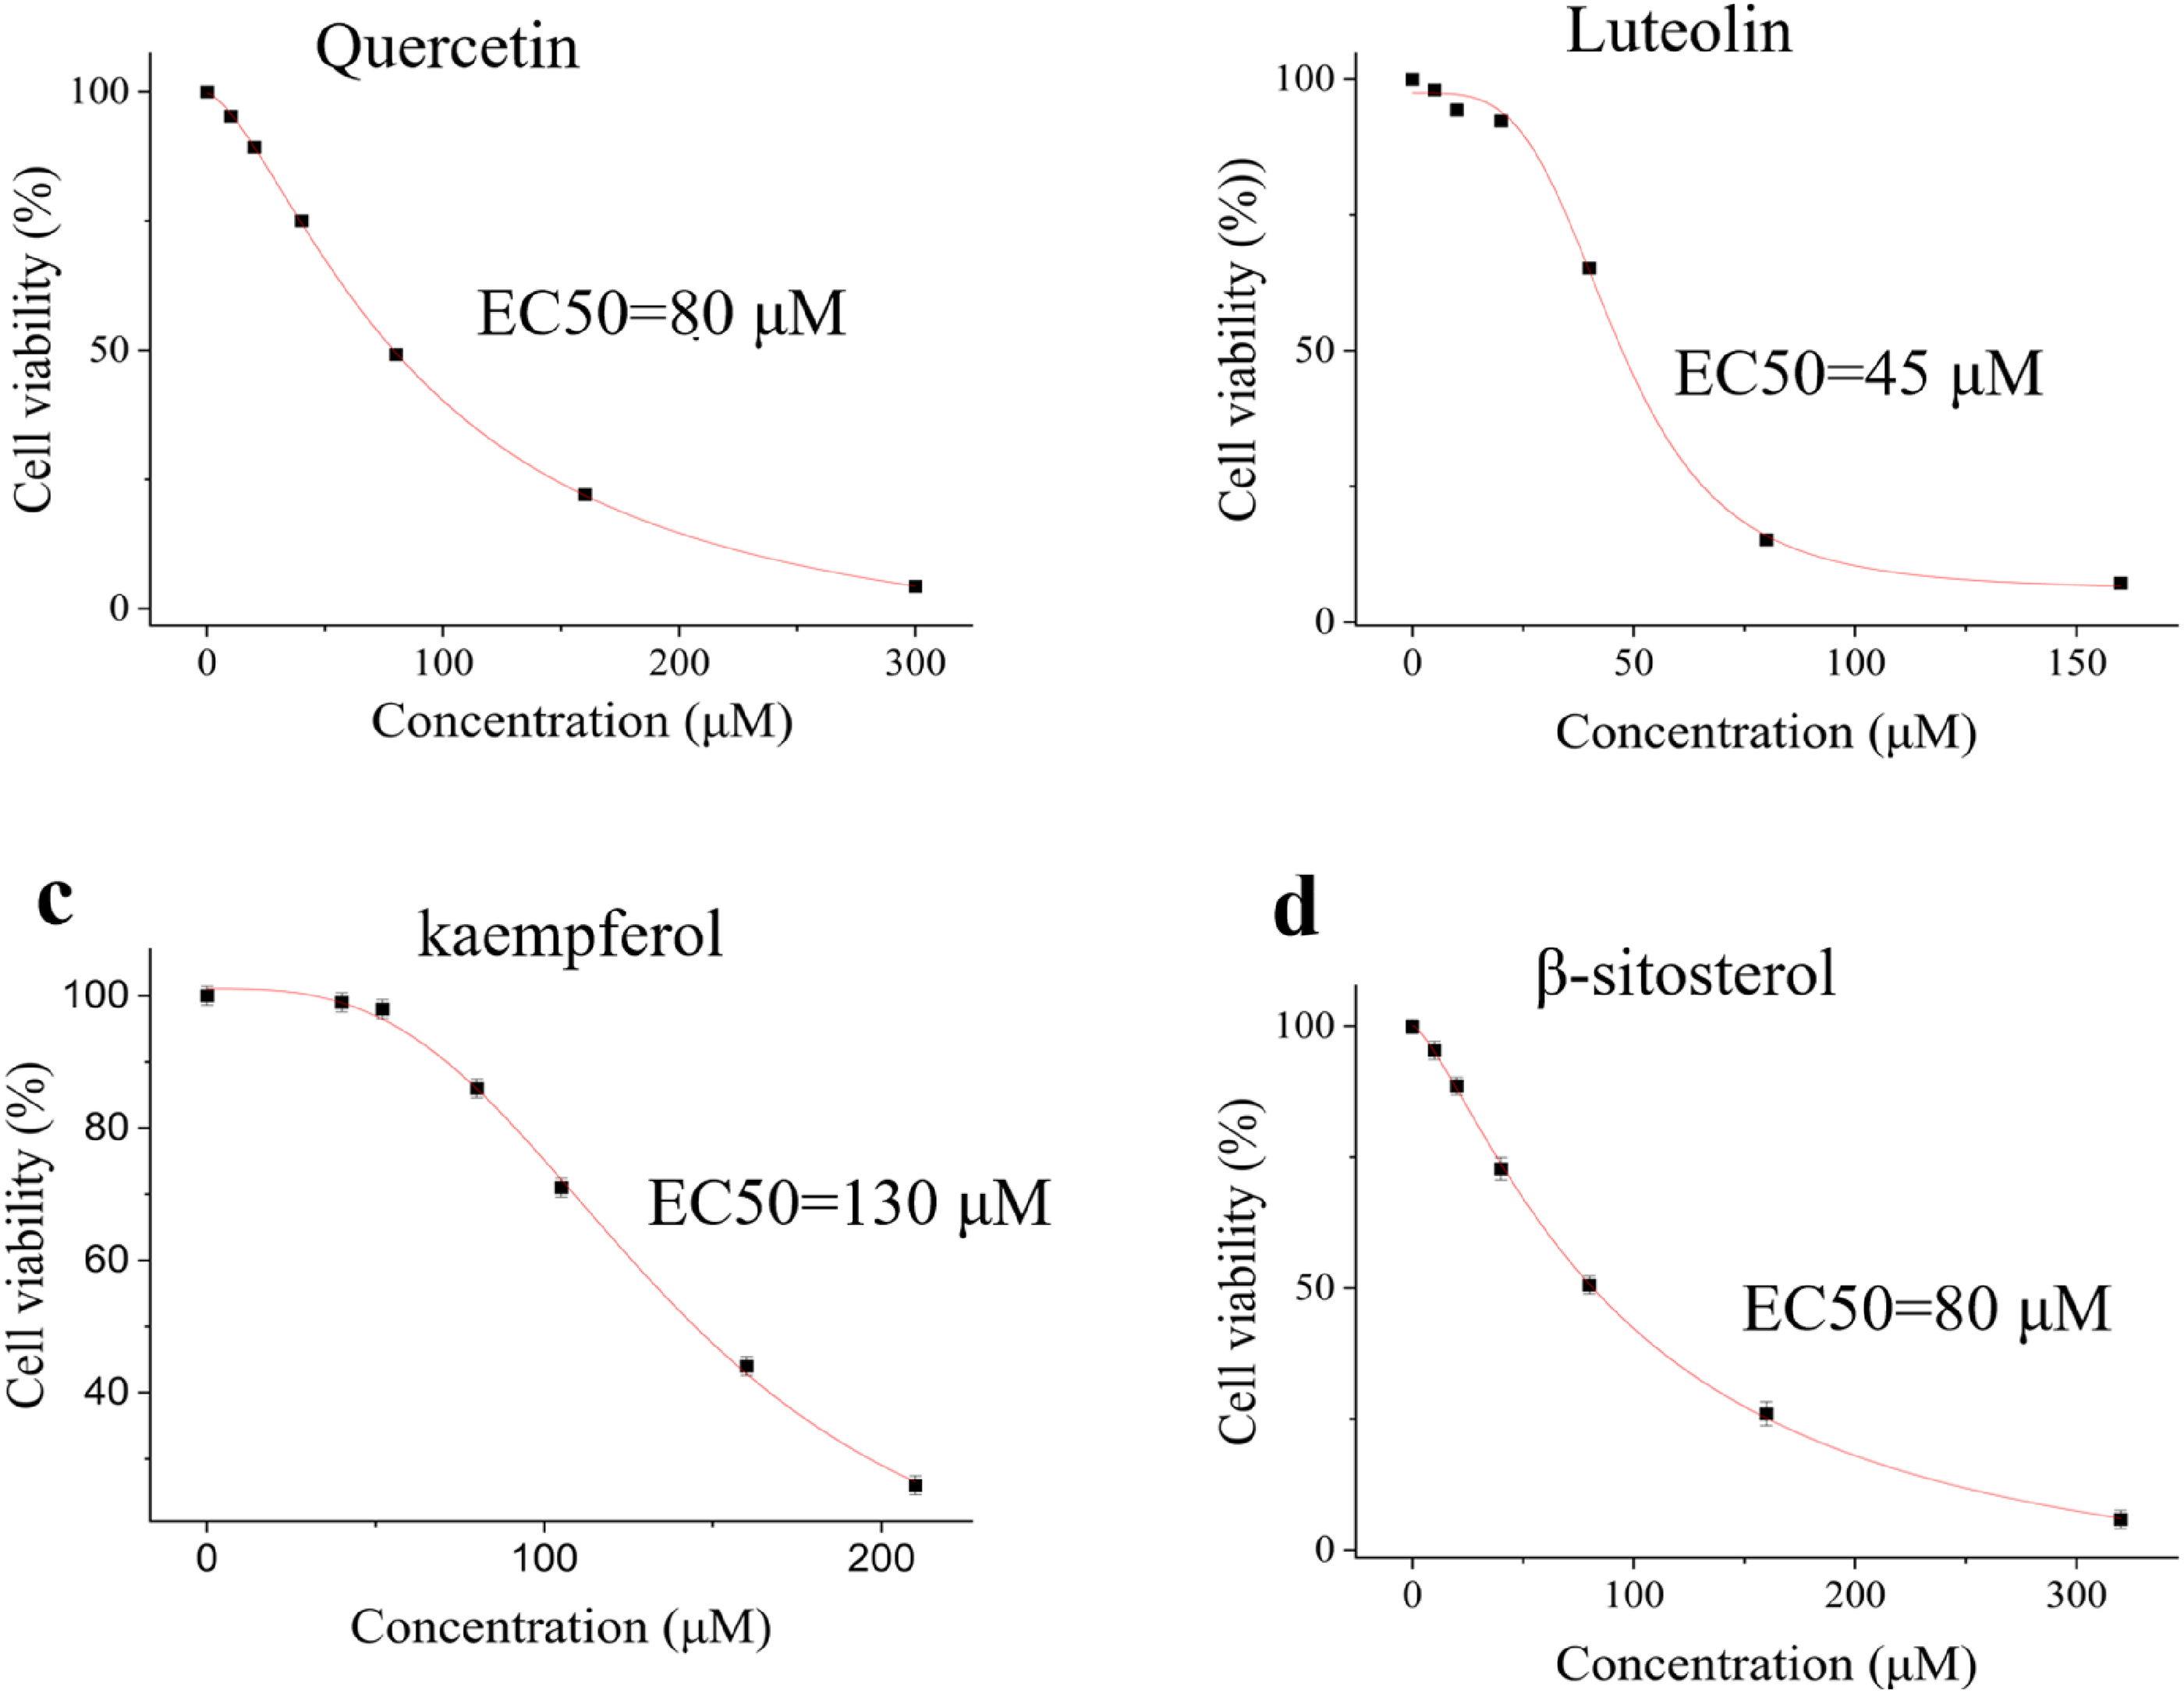
To evaluate both the cytotoxic effects on WPMY-1 cells and the pharmacological potency (EC50) effects of the four reference components on BPH-1 cells, we performed CCK-8 assays after 48 h of exposure to graded concentrations of each agent. To validate the assay's performance in our system, we confirmed the linear relationship between cell number and absorbance within the seeding density range used. Additionally, the Z’-factor of the assay was calculated to be 0.65, indicating a robust assay quality suitable for high-throughput screening. As shown in Figure 4a-4d, all the components exhibited a biphasic dose‒response relationship: cell viability initially increased with increasing concentrations up to 40 μM, followed by progressive inhibition at higher doses. Notably, the quercetin-, luteolin-, and kaempferol-treated groups maintained robust cell viability (>80%) even at their maximum tested concentrations (160 μM, 160 μM, and 320 μM, respectively). In contrast, β-sitosterol demonstrated markedly reduced tolerability, with viability declining to 71% at its highest administered dose (320 μM).

Cytotoxic effects of (a) quercetin, (b) luteolin, (c) kaempferol and (d) β-sitosterol on WPMY-1 cells.
EC50 is used early in the discovery process to evaluate the suitability and performance of drugs. In this study, we determined the EC50 values of four components to evaluate their biological activities. As demonstrated in Figure 5a-5d, the results revealed significant variations in potency among the tested components. Notably, luteolin had the strongest activity, with an EC50 value of 45 μM, followed by quercetin and β-sitosterol, which had moderate activity (EC50 = 80 μM). Paradoxically, kaempferol exhibited the lowest potency, with an EC50 value of 130 μM. The EC50 values ranged from 45 μM to 130 μM, reflecting the diverse pharmacological profiles of these components. Statistical analysis confirmed good reproducibility of the results, with all measurements showing low standard deviations (SD < 5% of the mean values). Given the cytotoxicity effect on WPMY-1 cells and the EC50 values of the 4 reference components, we designed orthogonal experiments to optimize the optimal concentration ratios of the 4 components.
EC50 values of (a) quercetin, (b) luteolin, (c) kaempferol and (d) β-sitosterol in BPH-1 cells.
Components’ Pharmacological Effects Optimization by RSM
This study evaluated the effects of 4 components—quercetin, luteolin, kaempferol, and β-sitosterol—on key biological responses, including the inhibition of cell viability, PSA levels, hormone production (E2 and DHT), and nitric oxide-related markers (NO and NOS). A total of 29 experimental trials were conducted, incorporating five replicate runs at the central point to ensure robustness. The experimental data from these trials are presented in Table S2 (Additional file). The regression coefficients derived from analysis of variance (ANOVA) are displayed in Table S3 (Additional file), highlighting the statistical significance (p < 0.05) or insignificance (p > 0.05) of each parameter's contribution to the observed outcomes.
To assess model validity, the coefficient of determination (R2) served as the primary indicator of fit quality. Additional statistical metrics generated through ANOVA, including error terms and confidence intervals, are compiled in Table S4 (Additional file), providing further insight into the reliability and precision of the predictive models.
The second-order polynomial model effectively captured the experimental data, as evidenced by remarkably high R2 values for inhibition (0.9700), PSA (0.9989), DHT (0.9409), E2 (0.9940), NO (0.9742), and NOS (0.9968). ANOVA further validated the model's robustness, showing statistically significant regression (p < 0.0001) and a nonsignificant lack of fit (p > 0.05) across all tested variables. The coefficients of variation (CVs) were minimal for inhibition (0.5139%), PSA (0.1258%) and NOS (0.9599%); moderate for DHT (2.45%) and E2 (2.69%); and comparatively high for NO (7.88%), reflecting consistent precision in most measurements. As detailed in Tables S3 and S4, the regression equations derived from the model reliably predicted all the experimental outcomes within the defined design parameters, underscoring its suitability for the study.
Table S2 presents the experimental results for the inhibition of cell viability and the PSA, DHT, E2, NO and NOS levels in BPH-1 cells. The degree of cell viability inhibition ranged from 82.7% ± 1.2% to 90.3% ± 0.6%, whereas the PSA, DHT, E2, NO, and NOS levels ranged from 866.3 ± 3.6 to 938.5 ± 2.9 ng/mL, 5.5 ± 0.1 to 7.0 ± 0.1 nM, 9.2 ± 0.4 to 23.8 ± 1.0 pM, 2.0 ± 0.2 to 5.0 ± 0.3 μM, and 1201.4 ± 14.3 to 1657.0 ± 3.0 U/L, respectively. The multi-response optimization was conducted with the goals of maximal cell viability inhibition, NO, and NOS levels, alongside minimal PSA, DHT, and E2 production. The overlay plot of the contour plots Figure 6 successfully revealed a feasible operating window where all constraints were met. The numerical optimization function predicted an optimal solution with a high overall desirability of D = 0.887. The corresponding optimal levels for factors quercetin, luteolin, kaempferol, and β-sitosterol were 81 μM, 46 μM, 129 μM, and 82 μM, respectively.
Overlay contour plot of the responses, with the red dashed vertical lines indicate the optimum concentration for each compound.
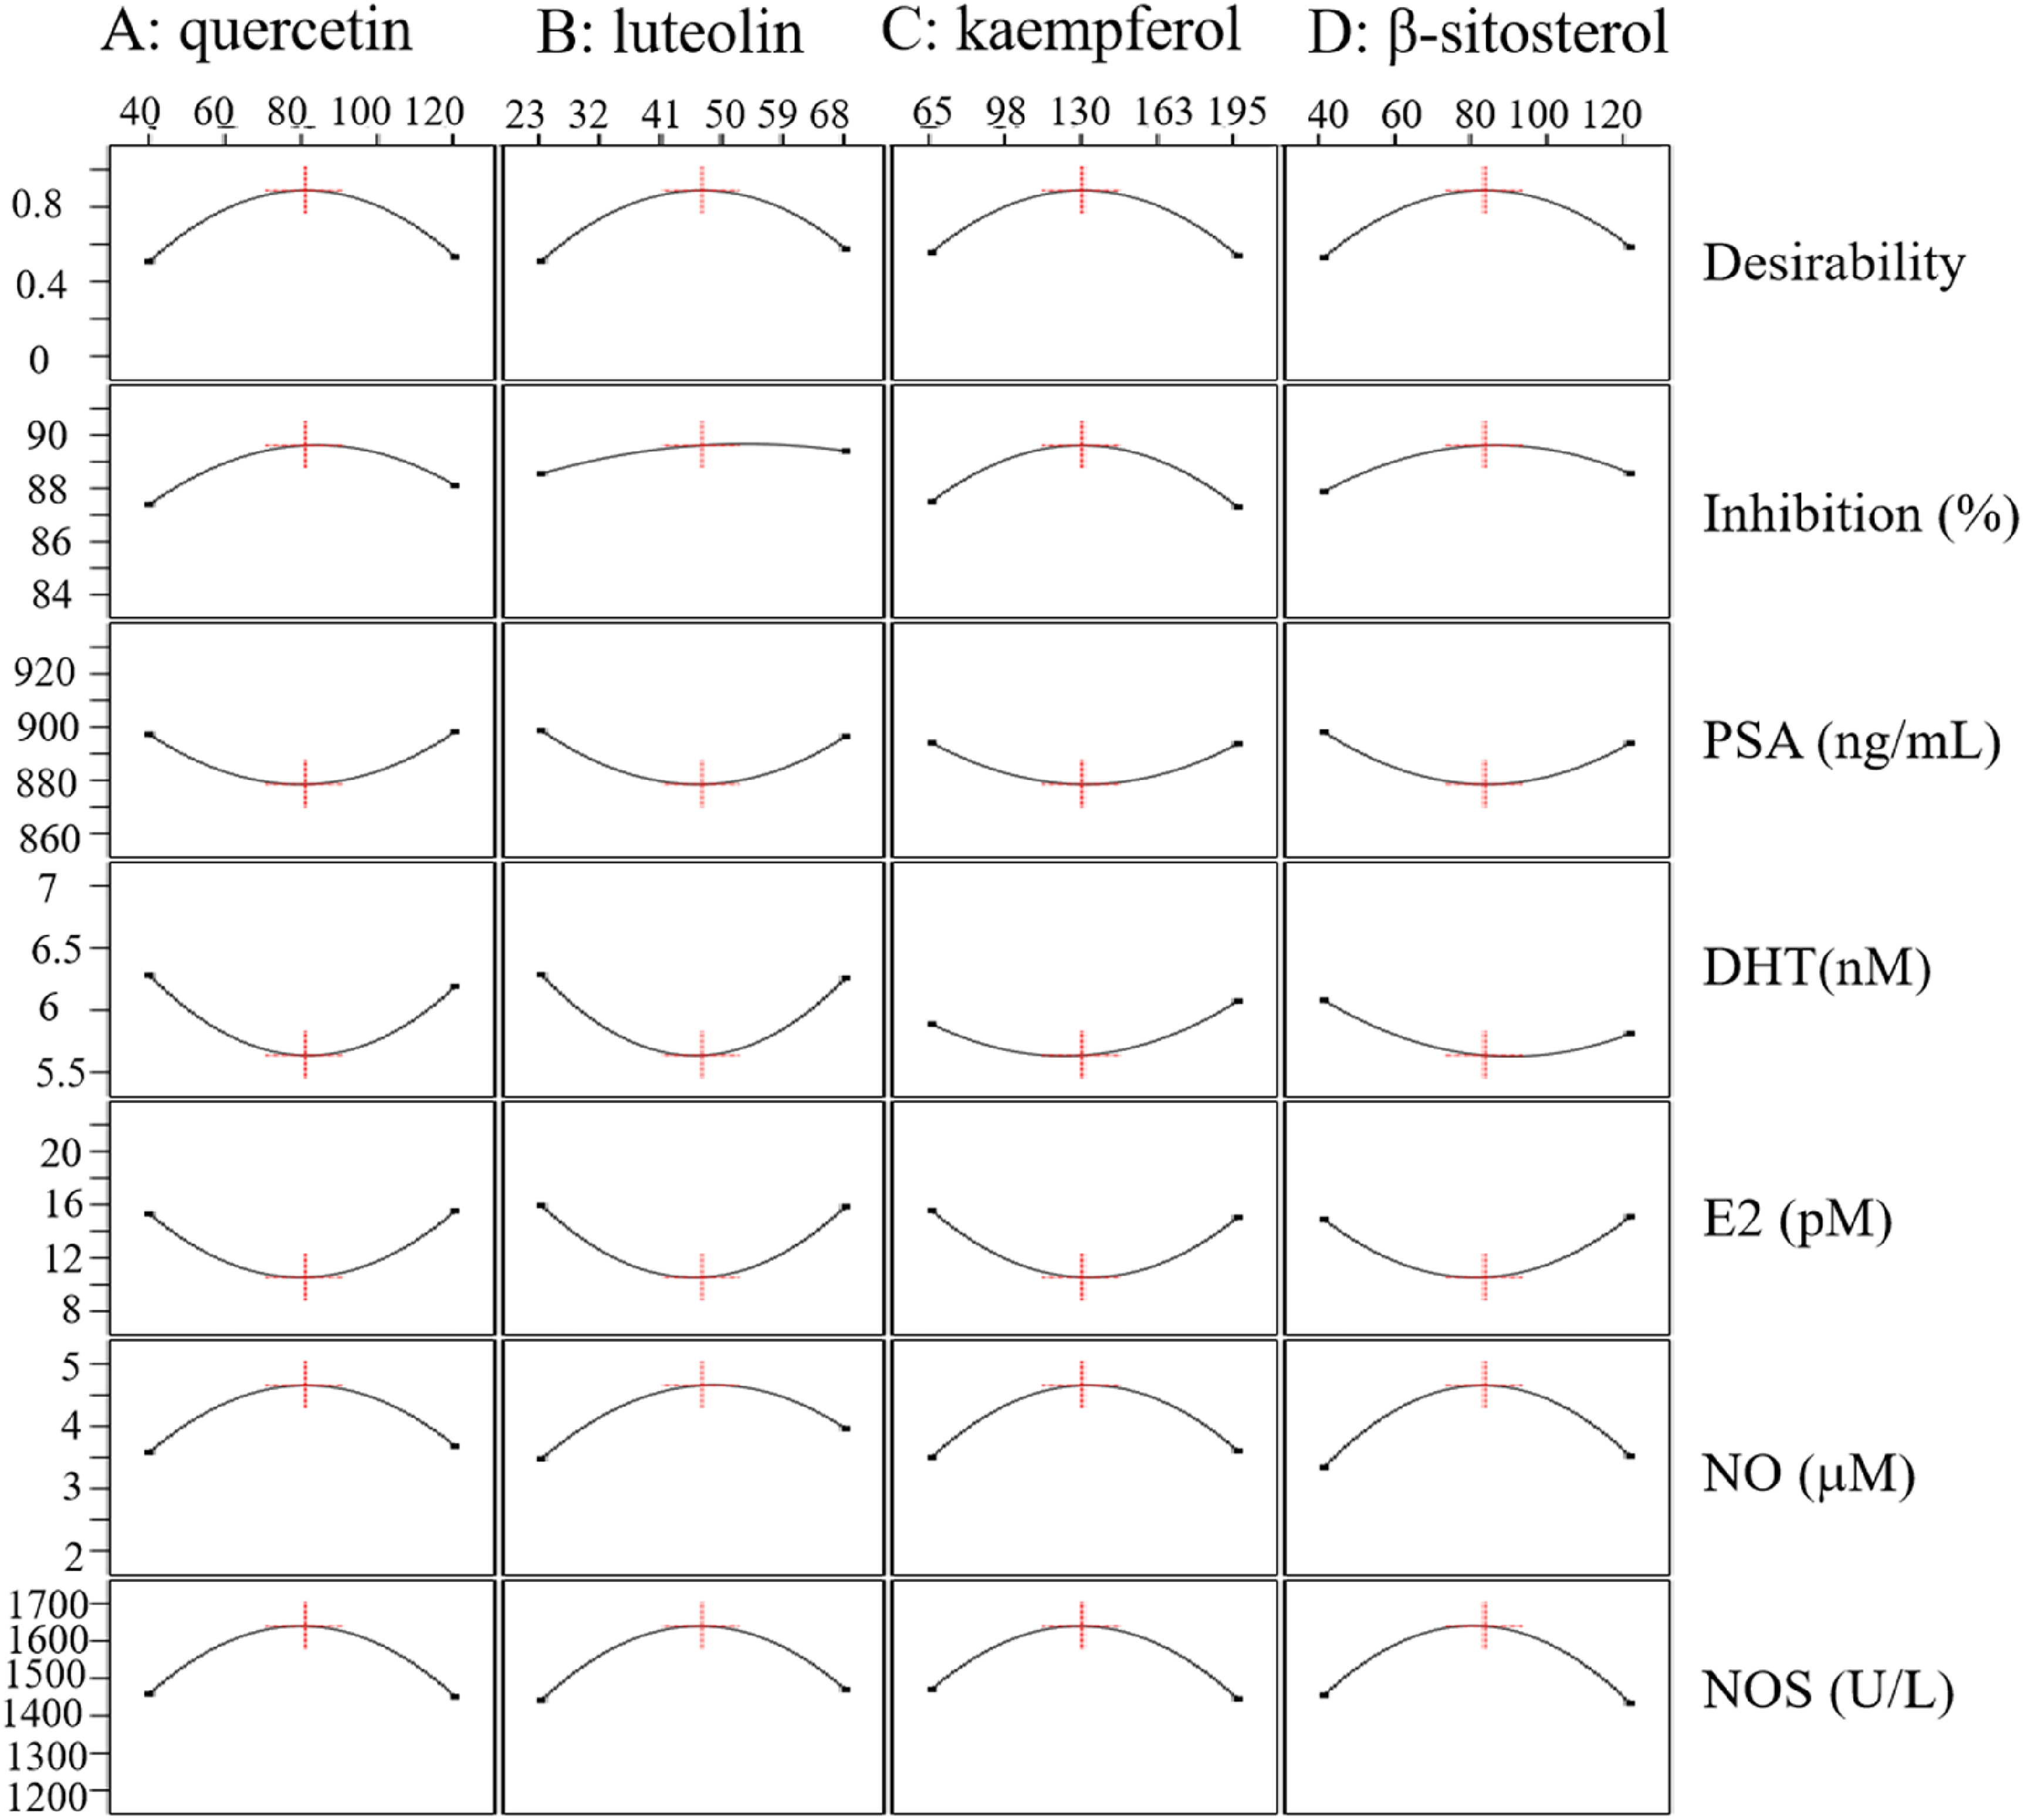
To evaluate the relative significance of the four factors on the six target characteristics, perturbation plots were generated Figure 7. As shown in Figure 7, for maximal NO, and NOS levels, alongside minimal PSA, DHT, and E2 production, quercetin, luteolin, kaempferol, and β-sitosterol exhibited strong quadratic effects, as indicated by their steep curvature; while for maximal cell viability inhibition, luteolin, kaempferol, and β-sitosterol were the most dominant variable.

Perturbation plot comparing the relative effects of all four independent factors (quercetin, luteolin, kaempferol, and β-sitosterol) on maximal cell viability inhibition, NO, and NOS levels, alongside minimal PSA, DHT, and E2 production, at the center point of the design space.
The dose-dependent effects of the individual components on the measured parameters are presented in Figures S1–S6, with corresponding statistical details provided in Table S4. Analysis of variance (ANOVA) confirmed that the quadratic terms of quercetin, luteolin, kaempferol, and β-sitosterol significantly impacted the responses of PSA, DHT, E2, NO, and NOS (p < 0.0001, Table S4). A non-monotonic, concentration-dependent relationship was observed for most parameters. For instance, cell viability was positively influenced by the linear terms of all compounds except kaempferol, while their quadratic terms exerted negative effects (Table S3, Figure S1). This pattern suggests an initial enhancement of activity with increasing concentration, which is subsequently reversed beyond a critical threshold, likely due to antagonistic effects at higher doses or cellular toxicity. This characteristic inverted U-shaped response was also evident in NO production, where linear terms were promotive and quadratic terms were inhibitory (Table S3, Figure S5). Conversely, several endpoints exhibited a U-shaped trend. The levels of PSA and DHT decreased initially but rebounded at higher concentrations (Table S3, Figures S2, S3). Similarly, E2 suppression was positively influenced by both linear and quadratic terms, resulting in a comparable U-shaped profile (Table S3, Figure S4). For NOS, all linear and quadratic terms had positive coefficients, indicating an initial increase followed by a decrease after an optimal point (Table S3, Figure S6).
Notably, significant two-way interaction effects were identified, highlighting the combinatorial complexity of the formulation. Key synergistic or antagonistic interactions were observed between the following pairs: quercetin and kaempferol, luteolin and kaempferol, kaempferol and β-sitosterol (for cell viability and DHT); quercetin and β-sitosterol, luteolin and kaempferol (for PSA); and luteolin and β-sitosterol (for NO and NOS).
The optimal formulation predicted by RSM was subsequently validated through experimental analysis. This formulation, consisting of quercetin (81 μM), luteolin (46 μM), kaempferol (129 μM), and β-sitosterol (82 μM), yielded results that were in excellent agreement with the model's predictions. Specifically, it demonstrated potent cell viability inhibition (89.75 ± 0.36%, deviations < 0.15%) and the targeted modulation of key biomarkers: PSA (867.70 ± 0.60, deviations <1.2%), DHT (5.59 ± 0.05, deviations <0.9%), E2 (9.61 ± 0.26, deviations <8.85%), NO (4.44 ± 0.19, deviations <4.66%), and NOS (1647.90 ± 8.21, deviations <0.37%). The significant effects observed across all measured parameters confirmed the reliability and robustness of the optimization model.
Discussions
The pathophysiology of BPH is characterized by multifactorial and multilayered complexity. Although the precise molecular pathogenesis remains to be fully elucidated, current research indicates that the development and progression of BPH involve multiple mechanisms, including hormonal dysregulation, cellular dyshomeostasis, and alterations in the microenvironment. These findings provide a theoretical basis for optimizing clinical diagnostic and therapeutic strategies. 12 The androgen signaling pathway is generally considered the core driving mechanism in the pathogenesis of BPH. This is because the proliferation and activation of prostatic stromal and epithelial cells are strictly dependent on the presence of testicular androgens. 13 As a potent androgen in the prostate, DHT diffuses across the membrane and binds to nuclear androgen receptors (ARs), inducing conformational changes in the receptor and recruiting coactivators (such as SRC-1 and AIB1) to form a ligand‒receptor‒cofactor complex. This complex specifically binds to the promoter regions of target genes (such as sequences related to the TMPRSS2-ERK signaling pathway) and, through chromatin remodeling mediated by histone acetyltransferases (such as p300), initiates the transcription of proliferation-related genes, including cyclin D1/CDK4, fibroblast growth factor 2 (FGF-2), and prostate-specific antigen (PSA). This gene expression regulatory network, by signaling pathways such as the MAPK/ERK and PI3 K/Akt/mTOR pathways, promotes a significant increase in the proliferation index of epithelial cells and the hypertrophy of stromal cells.14,15 Therefore, any imbalance in androgens affects the proliferation and death of prostate cells.16,17 This study utilized cell-based assays to investigate the therapeutic potential of four primary components for treating BPH. These findings suggest that these components alleviate BPH symptoms through a dual mechanism: lowering key hormone levels (PSA, DHT, and E2) and upregulating NO and NOS expression, both of which are associated with decreased inflammation.
TCM interventions for BPH have demonstrated unique therapeutic value, circumventing the multiple limitations of conventional treatments, such as the potential for urinary incontinence with surgical options and sexual dysfunction associated with standard medications. However, the key scientific challenge remains how to construct a bioinformatics framework linking “disease-syndrome-prescription” to achieve an organic integration of traditional theoretical terminology with modern molecular mechanisms. In systems biology, network pharmacology uniquely links TCM with modern pharmacology. It enables the construction of detailed, multilayered networks, providing a comprehensive understanding of how multicomponent TCM prescriptions achieve their therapeutic effects through diverse target interactions. 18 This study leverages network pharmacology to systematically analyze the major components of the herbal components used to treat BPH, aiming to optimize existing patented Chinese medicine prescriptions. Using “prostate hyperplasia” as the therapeutic indication, 28 approved prescriptions were selected from the Chinese Pharmacopoeia and the National Medical Products Administration database.
In our study, we identified 9 target proteins in 26 prescriptions, including TP53, AKT1, MAPK1, MAPK3, STAT3, JUN, SRC, HSP90AA1, and RELA. Carcinogenesis frequently involves early mutation of the TP53 gene, resulting in the production of a mutant p53 protein that abnormally accumulates within the cell. This accumulation is due to increased protein stability and is observed in both the nucleus and the cytoplasm.19,20 AKT1 can influence the AKT pathway, potentially mitigating the excessive growth of prostate cells and thereby alleviating symptoms of BPH.21,22 MAPK1 acts as a central hub in a crucial signaling pathway, integrating diverse biochemical signals to regulate cell proliferation and differentiation. It also plays a role in the development of BPH. 23 The MAPK3 gene encodes ERK1, a key component of a signaling cascade that regulates diverse cellular processes, including proliferation, adhesion, migration, and differentiation. 24 STAT3 plays a critical role in modulating genes involved in cellular growth and programed cell death. 25 For example, reduced STAT3 activity has been shown to suppress COX-2 expression. 26 In studies of BPH, elevated COX-2 levels correlate with increased cell division in prostatic tissue, suggesting a pathway through which persistent inflammation may contribute to prostate disorders. This interplay highlights how dysregulated inflammatory signaling, which is mediated by factors such as STAT3 and COX-2, could drive pathological changes in the prostate gland. 27 The Jun protein, commonly known as c-Jun, is a transcription factor encoded by a proto-oncogene and constitutes a member of the AP-1 transcription factor family. It is implicated in the regulation of cellular proliferation, differentiation, and apoptosis. Its aberrant expression has been correlated with various diseases, including cancer, inflammatory diseases, and autoimmune conditions. 28 The SRC family of proteins possesses multiple conserved domains that facilitate interactions with various receptors and transcriptional coregulators. 29 The heat shock protein (HSP) family, a group of evolutionarily conserved molecular chaperones, is essential for maintaining cellular homeostasis and modulating immune responses. HSP90AA1, a stress-inducible member of this family, has been implicated in activating sustained inflammatory signaling within fibroblasts. This process fosters inflammatory responses, stimulates cytokine release, and recruits immune cells to affected tissues. 30 Emerging research further suggests that HSP90AA1 participates in cell cycle regulation, promoting unchecked cellular growth while suppressing differentiation pathways. Such dysregulation may enhance tumor aggressiveness and metastatic potential in cancers. 31 The RELA protein is a crucial member of the NF-κB family and is involved in the regulation of various cellular processes, such as immune responses, inflammatory reactions, and cell proliferation. 32
The analysis of 28 TCM prescriptions revealed 75 components, and 18 target genes associated with BPH treatment. Quercetin, luteolin, kaempferol, and β-sitosterol emerged as the key components based on their degree values. The natural flavonoid quercetin functions as an anti-inflammatory and antioxidant agent. 33 Given the established roles of inflammation and oxidative stress in BPH pathogenesis and development, the ability of quercetin to mitigate prostatitis is significant. 34 It achieves this by increasing antioxidant capacity and inhibiting NF-κB and MAPK phosphorylation, leading to reductions in bladder irritation and other symptoms. 35 NO, a short-lived diatomic signaling molecule, is integral to numerous physiological homeostatic processes. Within inflammatory contexts, it is notably involved in mediating vasodilation, promoting leukocyte adhesion to the vascular endothelium, and augmenting vascular permeability. The synthesis of NO is catalyzed by NOS, which converts L-arginine into L-citrulline. Quercetin treatment produced a concentration-dependent reduction in prostate size within a BPH rat model. This effect was accompanied by a dose-dependent decrease in androgen receptor signaling factor expression in both rat prostate tissue and LNCaP cells. Additionally, in BPH-1 cells, quercetin inhibited the activation of the PI3 K/AKT/mTOR pathway triggered by IGF-1. 36 It modulated NO manufacturing through the induction of Nrf2-reliant HO-1 expression. 37 Luteolin, a key polyphenol characterized by the presence of oxygen functionality and two benzene rings, has been documented to exhibit a range of pharmacological properties, including anti-inflammatory, antimetastatic, antioxidant, and anticancer effects. 38 Research has indicated that luteolin can decrease the weight of the normal prostate in male mice and impede the proliferation of human prostate cancer cells both in vitro and in vivo. 39 Luteolin has been demonstrated to induce aortic ring relaxation and mitigate vascular lesions by modulating NOS activity, thereby enhancing NO production via the NOS-NO-soluble guanylate cyclase (sGC) signaling pathway. 40 Kaempferol, another flavonoid, shares anti-inflammatory properties with quercetin but also possesses antitumor capabilities. 41 Kaempferol has been shown to suppress human prostate cancer cells (DU145). 42 Phytosterols are micronutrients that are ubiquitously found in higher plants. 43 Kaempferol suppresses NF-κB signaling through a dual mechanism: it inhibits NF-κB activation, prevents its nuclear translocation, and consequently blocks its binding to the iNOS promoter region. 44 β-Sitosterol is the main phytosterol and displays antioxidant, anticancer and anti-inflammatory properties. 45 It may modulate membrane fluidity and signaling platforms, indirectly influencing NOS localization and activity, and has been reported to reduce liver injury, (BPH) and maintain normal blood cholesterol levels. 46 The primary goal of RSM was to identify the optimal conditions for the studied process. Optimizing the components concentration is essential for assessing the medicinal potential of phytochemicals. Although higher concentrations may enhance pharmacological activity, the optimal concentrations vary according to the phytochemical and desired effects, as demonstrated in previous studies. This study revealed that a specific combination of quercetin (80 µM), luteolin (46 µM), kaempferol (129 µM), and β-sitosterol (82 µM) – at a molar ratio of 1:0.5625:1.625:1 (relative to β-sitosterol = 1) – strongly inhibited BPH cell growth, decreased BPH-related hormone levels (PSA, DHT, and E2), and increased the expression of inflammation-related indicators (NO and NOS). Experiments confirmed that the proportions of the 4 components in our prescriptions differ significantly from those found in the 26 existing traditional Chinese medicine prescriptions. These findings highlight a concentration-dependent biphasic relationship, where compound efficacy peaks at intermediate doses. Synergistic or antagonistic interactions between phytochemicals critically modulate cellular responses, underscoring the need for optimized dosing strategies in therapeutic applications. Based on this observation, we hypothesize that optimizing these 26 prescriptions according to the ratios we have identified could potentially enhance their efficacy substantially. An untargeted LC-MS/MS-based metabolomic profiling of all 26 prescriptions, coupled with multivariate statistical analysis, would provide a far more comprehensive chemical fingerprint and could help identify other bioactive constituents correlated with efficacy.
It is crucial to contextualize these findings within the limitations of our approach. First, while network pharmacology provided a systems-level starting point, its reliance on database completeness (TCMSP, TCMIP) means potentially bioactive compounds with less annotation may be overlooked. Our multi-source validation aimed to mitigate this. Second, molecular docking, despite validation (RMSD < 2.0 Å), remains a static approximation of binding and does not capture full target dynamics or intracellular conditions. Third, our identification of the four “key” components prioritizes network centrality and cross-prescription frequency—a robust strategy for identifying major hubs, but one that may not capture all contributing compounds. The activity of the other 71 identified active compounds is not discounted and warrants future study.
RSM model intentionally focused on the interaction network among these four components. The complex background of other prescription constituents was treated as a constant matrix. This simplification allowed us to test a core hypothesis: Can optimizing the ratio of these four widely-shared components, irrespective of the full herbal matrix, yield significant efficacy gains? Potential interactions with unmeasured components or higher-order synergies are encompassed within the model's residual variance, a necessary simplification for this proof-of-concept study.
Conclusion
In conclusion, this study provides in silico and in vitro evidence supporting the application of a network pharmacology-guided approach to identify and optimize key quality components from TCM prescriptions for BPH. The network pharmacology analysis revealed that 28 Chinese medicine prescriptions for BPH commonly contain 112 traditional Chinese herbal ingredients, encompassing 596 components (75 of which are active). The key components identified were quercetin, kaempferol, luteolin, and β-sitosterol, which docked well with 9 core target molecules. The specific combination of quercetin, luteolin, kaempferol, and β-sitosterol, formulated according to a precise molar ratio (1:0.6:1.6:1), exerts significant therapeutic effects. Response surface optimization revealed that an optimal combination of these 4 components effectively inhibited BPH cell growth, modulated the levels of key markers (PSA, DHT, and E2), and increased inflammatory factor expression (NO/NOS). These findings suggest that optimizing TCM prescriptions based on rational combinations of key components, within safe therapeutic limits, can substantially enhance their efficacy. However, this work only establishes a foundational proof-of-concept. To translate these findings, future research must: (1) Expand the chemical scope by incorporating more candidate bioactive compounds into predictive and optimization models; (2) Elucidate the in vivo mechanisms and pharmacokinetic (PK) interactions of the optimized combination using animal models of BPH, addressing how these components interact systemically; and (3) Conduct direct comparative efficacy studies pitting the optimized ratio against the original, clinically used TCM prescriptions and standard drugs to robustly assess any therapeutic advantage. Consequently, our results offer valuable insights for refining TCM quality standards, suggesting critical quality markers, and paving the way for the development of novel, more effective TCM therapies for BPH.
Supplemental Material
sj-docx-1-npx-10.1177_1934578X261431537 - Supplemental material for Data Mining of Key Quality Components from NATCM- Registered BPH Prescriptions, Their Quantification and Activity Optimization
Supplemental material, sj-docx-1-npx-10.1177_1934578X261431537 for Data Mining of Key Quality Components from NATCM- Registered BPH Prescriptions, Their Quantification and Activity Optimization by Fengjiao Xu, Jianxia Wu, Huiwen Fang, Li Yang, Aili Qu, Huaxia Qin, Ting Liu, Jiande Li, Shaojian Zheng, Xiao Ruan and Qiang Wang in Natural Product Communications
Footnotes
Author Contributions
Conceptualization, data curation, methodology, software, and writing—original draft preparation, F.J.X., and J.X W.; validation, formal analysis, investigation, and visualization, L.Y. and A.L.Q.; supervision and writing— review and editing, S.J.Z, X.R. and Q.W. All authors have read and agreed to the published version of the manuscript.
Funding
This work was supported by the National Natural Science Foundation of China (grant number 32071509); Specially appointed experts for the third batch of “Talent Introduction Plan of Tianchi” in the autonomous region-NEW CICON Pharmaceutical Co., Ltd; Xinjiang Department of Science and Technology, Project of Innovative industrial clusters (2023LQ01003); Technology Bureau of Ningbo [grant numbers 2023Z204].
Declaration of Conflicting Interests
The authors declared no potential conflicts of interest with respect to the research, authorship, and/or publication of this article.
Data Statement
The data are contained within the article.
Supplemental Material
Supplemental material for this article is available online.
References
Supplementary Material
Please find the following supplemental material available below.
For Open Access articles published under a Creative Commons License, all supplemental material carries the same license as the article it is associated with.
For non-Open Access articles published, all supplemental material carries a non-exclusive license, and permission requests for re-use of supplemental material or any part of supplemental material shall be sent directly to the copyright owner as specified in the copyright notice associated with the article.