
Abstract
Objective
Mentha Crispa samples collected from Kien Giang province were systematically identified, and the extraction process was carefully optimized to enhance biological activity. This study focused on developing an extraction method with optimal parameters using response surface methodology, aiming to improve the overall quality of the extract while maximizing its polyphenol and flavonoid content.
Method
Mentha Crispa was extracted using the microwave-assisted method, with factors such as power, time, and ethanol ratio and solvent volume affecting the process. The biological activities were assessed using several methods, including the DPPH assay, ABTS assay, agar disk-diffusion method, and the Minimum Inhibitory Concentration (MIC) test, Egg Albumin Denaturation assay (EAD).
Results
The content of polyphenols and flavonoids was evaluated to base on the RSM with the optimal parameters from the model (time microwave at 1 min, power of 260 W, solvent-to-raw material ratio of 2 g/40 mL, ethanol concetration of 50%) of 925 (mgGAE).(gDW)−1 and 163.5 (mgQE).(gDW)−1 (R2= 0.999 and 0.997 > 0.75). The antioxidant capacity of the extract was found to be high with DPPH and ABTS results of 0.38 and 3.25 mg.mL−1. Besides, the antibacterial ability of the sample was also recorded at the minimum inhibitory concentration of Escherichia coli of 10 mg.mL−1 and Staphylococcus aureus of 7.5 mg.mL−1. In addition, the anti-inflammatory ability of the basil extract was recorded as 41.035% at a concentration of 1 mg/mL.
Conclusions
The study showed that the microwave-assisted extraction method has shown outstanding time-saving ability. The extraction conditions were optimized to ensure high flavonoid and polyphenol content, with good activity. It can be seen that Mentha Crispa extract has great potential for application in the medical field.
Introduction
In Vietnam, Mentha crispa L. has long been used in traditional medicine, cuisine and is widely grown in many different regions (based on information from Botany Research and Development Group of Vietnam). 1 Mentha crispa L., belongs to the classification of Mentha spicata var crispa, genus Mentha, family Lamiaceae. Lamiaceae is a family of 260 genera and 7000 species that grow in many different agro-climatic conditions. Genus Mentha L. includes 42 species, hundreds of subspecies, 15 hybrids, and different cultivars.2,3 In addition to its traditional food flavoring agent, M. spicata is also known for its traditional medicinal uses, especially for treating colds, coughs, asthma, fever, obesity, jaundice, and digestive problems. 4
Mentha crispa contains flavonoids and polyphenols with valuable biological properties such as antioxidant, anti-inflammatory, antibacterial and the ability to prevent chronic diseases. 5 Spearmint essential oil has been shown to reduce bad cholesterol levels and help regulate blood pressure, contributing to improved cardiovascular health.3,4,6 M. crispa has been studied extensively for its therapeutic effects in the treatment of giardiasis, 7 its potent antiproliferative activity in tumor cell lines, although the effect decreased after storage, 8 and its antioxidant and antifungal activities (in vitro, in situ) of peppermint essential oil (Mentha spicata var. crispa), 5 antibacterial, antidiabetic, cytotoxic. 4 In the study of Le Van Nhat Hoai, the polyphenol content was determined to be 247.25 ± 0.71 (mg GAE/gDW) of raw materials from Long An, Vietnam and the antioxidant capacity was determined with an IC50 value of 1.24 ± 0.01 (mg/mL). 9 In addition, Caffeic acid, Syringic acid, Luteolin, Chlorogenic acid, Rosmarinic acid, Luteolin-7-O-glucoside, Salvianolic acid B are the main components in the extract.9,10 With active ingredients such as menthol, menthone, and flavonoid compounds, mint is not only used in the food industry but also in pharmaceuticals, cosmetics, and health care products. However, the development of mint products often encounters problems in the processing and effective utilization of this raw material.
Environmental conditions can significantly affect the content of active compounds in Mentha crispa. However, studies on the effects of harvesting conditions, processing methods, and storage conditions on the active compounds in Mentha crispa were still limited. 9 Optimizing the extraction process from Mentha crispa with the support of microwaves has important practical and scientific significance. This study not only helps to fully exploit Mentha crispa raw materials, reduce waste, but can also create products with higher value from this herb. This not only contributes to increasing the economic value of Mentha crispa but also reduces dependence on imported raw materials and enhances sustainable development in the herbal industry.
Experimental
Pretreatment and Chemicals
Sigma-Aldrich of the US was a supplier of products such as Folin & Ciocalteu's phenol reagent (2N), DPPH (2,2-Diphenyl-1-picrylhydrazyl, ≥ 95%), ABTS (2,2′-Azino-bis (3-ethylbenzothiazoline-6-sulfonic acid) diammonium salt, ≥ 98%), L-Ascorbic acid (Vitamin C, ≥ 99%), Amoxicillin. Xilong of the China was a supplier of products such as Sodium Carbonate (Na2CO3), Aluminum chloride (AlCl3), Potassium acetate (CH3COOK), Methanol (CH3OH), Potassium peroxydisulfate (K2S2O8), Sodium Chloride (NaCl). Himedia of the India was a supplier of products such as Peptone powder; Yeast Extract Powder; Agar powder. Bacterial strains including Staphylococcus aureus (S. aureus) NRRL B-313, Escherichia coli (E. coli) NRRL B-409 were preserved on Luria - Bertani (LB) agar blocks at 4 oC. Mentha crispa plants (MC) were purchased from gardens in Giong Rieng town, Giong Rieng district, Kien Giang province. MC was washed, dried at 65 °C for 24 h, ground into fine powder and stored in a desiccator at room temperature.
Isolate DNA and Run PCR to Amplify the ITS Region
The raw materials of Vietnamese basil were purchased from gardeners in Giong Rieng town, Giong Rieng district, Kien Giang province. The raw materials were picked fresh from the tree, washed, drained and stored in zip bags at 25 oC to ensure the freshness of the sample. Leaf samples were separated using a modified CTAB method. 11 The samples were incubated with extraction buffer at 65 °C for 30 min (0.1 g of sample in 1 mL of buffer). The supernatant was then centrifuged at 10,000 rpm for 10 min. Next, the supernatant was mixed with a PCI solution (phenol:chloroform:isoamyl – 25:24:1, v/v) at a 1:1 ratio (v/v), and the mixture to centrifuge at 12 000 rpm for 15 min at 4 °C. The supernatant was collected and mixed with a CI solution (chloroform:isoamyl – 24:1, v/v) at a 1:1 ratio (v/v), then centrifuged again at 12 000 rpm for 15 min at 4 °C. The resulting supernatant was combined with an equal volume of isopropyl alcohol and incubated for 15 min at −20 °C. To collect the precipitate, the mixture was centrifuged at 12 000 rpm for 15 min at 4 °C. The precipitate was washed with 70% ethanol (repeated 3 times), allowed to dry completely at room temperature, and then dissolved in 50 μL of nuclease-free water. Finally, the total DNA content was measured using a Nanodrop machine
Microwave-Assisted Extraction Method
The extraction procedure was carried out based on the research of Geow's group.12–14 The MC extract was extracted by conventional soaking method and microwave-assisted soaking method. 1 g of MC powder was extracted by Ethanol solvent with the volume of 10-30 mL and Ethanol: Water ratio 0%–98% (v/v) in microwaved at different microwave times (0 min, 1 min, 2 min, 3 min) and with microwave powers (120 W, 250 W, 380 W, 500 W). Then, the sample was soaked for 30 min and filtered through Whatman No.1 filter paper. The obtained extract was stored in cold conditions at 2-10 oC for use in subsequent analytical experiments.
Method for Determining Total Polyphenol and Flavonoid Content
Total phenolic and flavonoid content were determined through the Folin – Ciocalteu and method in Sitthichai study. 15 Post-reaction absorbance was measured at 760 nm for polyphenols and 415 nm for flavonoids using a UV-Vis spectrophotometer. Experiments were conducted according to the research of Thi Truc Phuong Nguyen. 16 Gallic acid and quercetin were used as reference standards, with results expressed as mgGAE/gDW for gallic acid and mgQE/gDW for quercetin.
Evaluate Antibacterial Ability
To prepare the culture medium, LB-Miller agar medium (g/L) was made with 10 g peptone, 5 g yeast extract, 5 g NaCl, 20 g agar, and 1 L water. LB-Miller medium (g/L) contained 10 g peptone, 5 g yeast extract, 5 g NaCl, and 1 L water. The components were stirred until dissolved, transferred to a 2L laboratory bottle, and sterilized with a JEIOTECH ST-50G autoclave. Investigating the antibacterial ability of DLCP extract using the Agar disk-diffusion method. MIC is the lowest concentration capable of inhibiting the growth of microorganisms. Experiments were conducted according to the research of Thi Truc Phuong Nguyen. 16
Evaluate Anti-Inflammatory Activity
The anti-inflammatory activity of the extract was studied by R.Gomathi by in vitro egg albumin denaturation assay.
17
A 5 mL aliquot of egg albumin (0.2 mL), extract, control sample (sodium diclofenac) (2 mL) and phosphate buffer at pH 6.4 was prepared. The entire mixture was heated for 5 min at 70 °C before cooling for 15 min at room temperature and the absorbance of the solution was measured at 660 nm using a UV-vis spectrophotometer. The percentage of denaturation activity of the prepared fruit extract was measured using the following formula:

DPPH and ABTS•+ Free Radical Scavenging Ability
In vitro antioxidant activity was evaluated using the ascorbic acid standard by the 1, 1-diphenyl-2-picrylhydrazyl radical scavenging method (DPPH captures the hydrogen groups of the antioxidant) and ABTS•
Physicochemical Properties
Results
Botanical Identification
The raw samples of Vietnamese basil (Figure 1 (A)) were sent to ATGC Co., Ltd for analysis and identification. The raw materials of Vietnamese basil were identified and identified using the method of plant identification using DNA barcodes. The analysis processes included DNA isolation, PCR analysis, sequencing and molecular identification. The DNA concentration was determined to be 1200.4 ng/uL, which was amplified in the ITS (Internal transcribed spacer) region, as shown in Figure 1 (B) and (Appendix I, Figure S1). The PCR product sample was sent for 2-way Sanger sequencing (ITS5F and ITS4R, similar primer pairs to PCR), and the consensus sequence Blast results (Appendix I, Table S1). The BLAST sequence results were checked against the Genebank database with the highest similarity result with the species Mentha spicata and Mentha suaveolens with a similarity rate of 100% (Appendix I, Figure S2). The sample is identified based on the ITS region as Mentha crispa.

Image of Raw Materials (A) and Electrophoresis Results of PCR Products on 0.8% Agarose Gel (B).
After being purchased, processed and dried, the basil plant produces basil powder. The color value and basic quality parameters of basil are shown in Table 1. The quality of the medicinal powder is evaluated based on the Vietnamese Pharmacopoeia V. 23 The raw powder is determined to be a coarse powder when the dry material is finely ground and more than 95% of the particles pass through a sieve number 2000. The raw powder is determined based on the powder size and sieve standards in the Vietnamese Pharmacopoeia V. 23 The color of basil powder is evaluated through the L*a*b* value. The color space value (The Commission Internationale de l'éclairage Lab color space - CIELAB color space) is recorded as L* (52.01), a* (−2.5), b* (11.64). Based on the color space and L*a*b* values, the powder sample was determined to be moss green (Reseda green). The moisture content of the powder was recorded at 4.25% and is shown in Table 1. This shows that the powder was completely dry with a low moisture content of <10%. The total ash, soluble ash, and insoluble ash values were also calculated with values of 9.44%, 5.28%, and 0.96%, respectively. In addition, the qualitative compounds (including polyphenols, flavonoids, saponins, tannins, alkaloids) showed the presence of polyphenols, flavonoids, and tannins mainly (Appendix I, Figure S3).
Quality Indicators of Basil Powder.

Factors Affecting the Extraction Process
The polyphenol and flavonoid contents are significantly affected by the extraction conditions. Therefore, the influencing factors such as microwave time, solvent ratio, microwave power and extraction solvent volume will be evaluated. The evaluation experiments were repeated 3 times at the condition of raw material content of 2 g. The influence of ethanol ratio and solvent volume is shown in Figure 2. The ethanol ratio was evaluated from 0% to 98% corresponding to absolute ethanol 98o. TPC and TFC contents changed significantly when ethanol was present. In which, TPC content increased from 37.46 ± 1.32 mgGAE/gDW to 79.41 ± 0.17 mgGAE/gDW and TFC increased from 4.26 ± 0.01 mgQE/gDW to 13.67 ± 0.01 mgQE/gDW when the ethanol percentage increased from 0% to 50%. The effect of ethanol ratio on TPC content (P = 1.68 × 10⁻²³) and TFC (P = 3.90 × 10⁻¹⁹) was statistically significant after ANOVA analysis with P value < .05. Regarding solvent volume, TPC content still tends to increase when solvent volume increases. The highest recorded TPC content is 90.02 ± 0.64 mgGAE/gDW and still tends to increase if the volume continues to increase. Meanwhile, TFC reaches the highest content of 14.43 ± 0.002 mgQE/gDW at a volume of 20 mL. The effect of solvent volume on TPC content (P = 2.63 × 10⁻¹⁷) and TFC (P = 7.10 × 10⁻⁹) was statistically significant after anova analysis with P value < .05. For a comprehensive evaluation, the solvent volume value was selected as one of the major influencing factors to evaluate the RSM model with the recorded evaluation conditions from 40 mL to 60 mL.

Effect of Ethanol Concentration (A) and Solvent Volume (B).
The effects of microwave time and power on polyphenol and flavonoid contents are shown in Figure 3. Microwave time points were evaluated from 0 min to 4 min. The results showed that polyphenol and flavonoid contents tended to increase with increasing time from 0 min (Polyphenol: 95.44 ± 0.54 mgGAE/gDW; Flavonoid: 12.98 ± 0.36 mgQE/gDW) to 1 min (Polyphenol: 105.47 ± 0.006 mgGAE/gDW; Flavonoid: 18.95 ± 0.04 mgQE/gDW). When the time increased to 2 min, the TPC content (107.06 ± 0.01 mgGAE/gDW) continued to increase while the TFC content (17.24 ± 0.001 mgQE/gDW) began to decrease. The effect of microwave time on TPC and TFC was analyzed by Anova with a P value <.05, showing that the two factors TPC (P = 2.63 × 10⁻¹³) and TFC (P = 3.55 × 10⁻¹⁰) were statistically significant. Microwave power was evaluated at the following levels: 120 W, 250 W, 380 W, 500 W. The results showed that the polyphenol and flavonoid content tended to increase when the power increased from 120 W (Polyphenol: 111.56 ± 0.48 mgGAE/gDW; Flavonoid: 20.41 ± 0.17 mgQE/gDW) to 250 W (Polyphenol: 121.01 ± 0.87 mgGAE/gDW; Flavonoid: 21.23 ± 0.46 mgQE/gDW). TPC and TFC content gradually decreased when the power increased above 250 W. The effect of microwave time on TPC and TFC was analyzed by Anova with P value <.05, showing that the two factors TPC (P = 1.80 × 10⁻¹⁸) and TFC (P = 5.43 × 10⁻¹¹) were statistically significant.
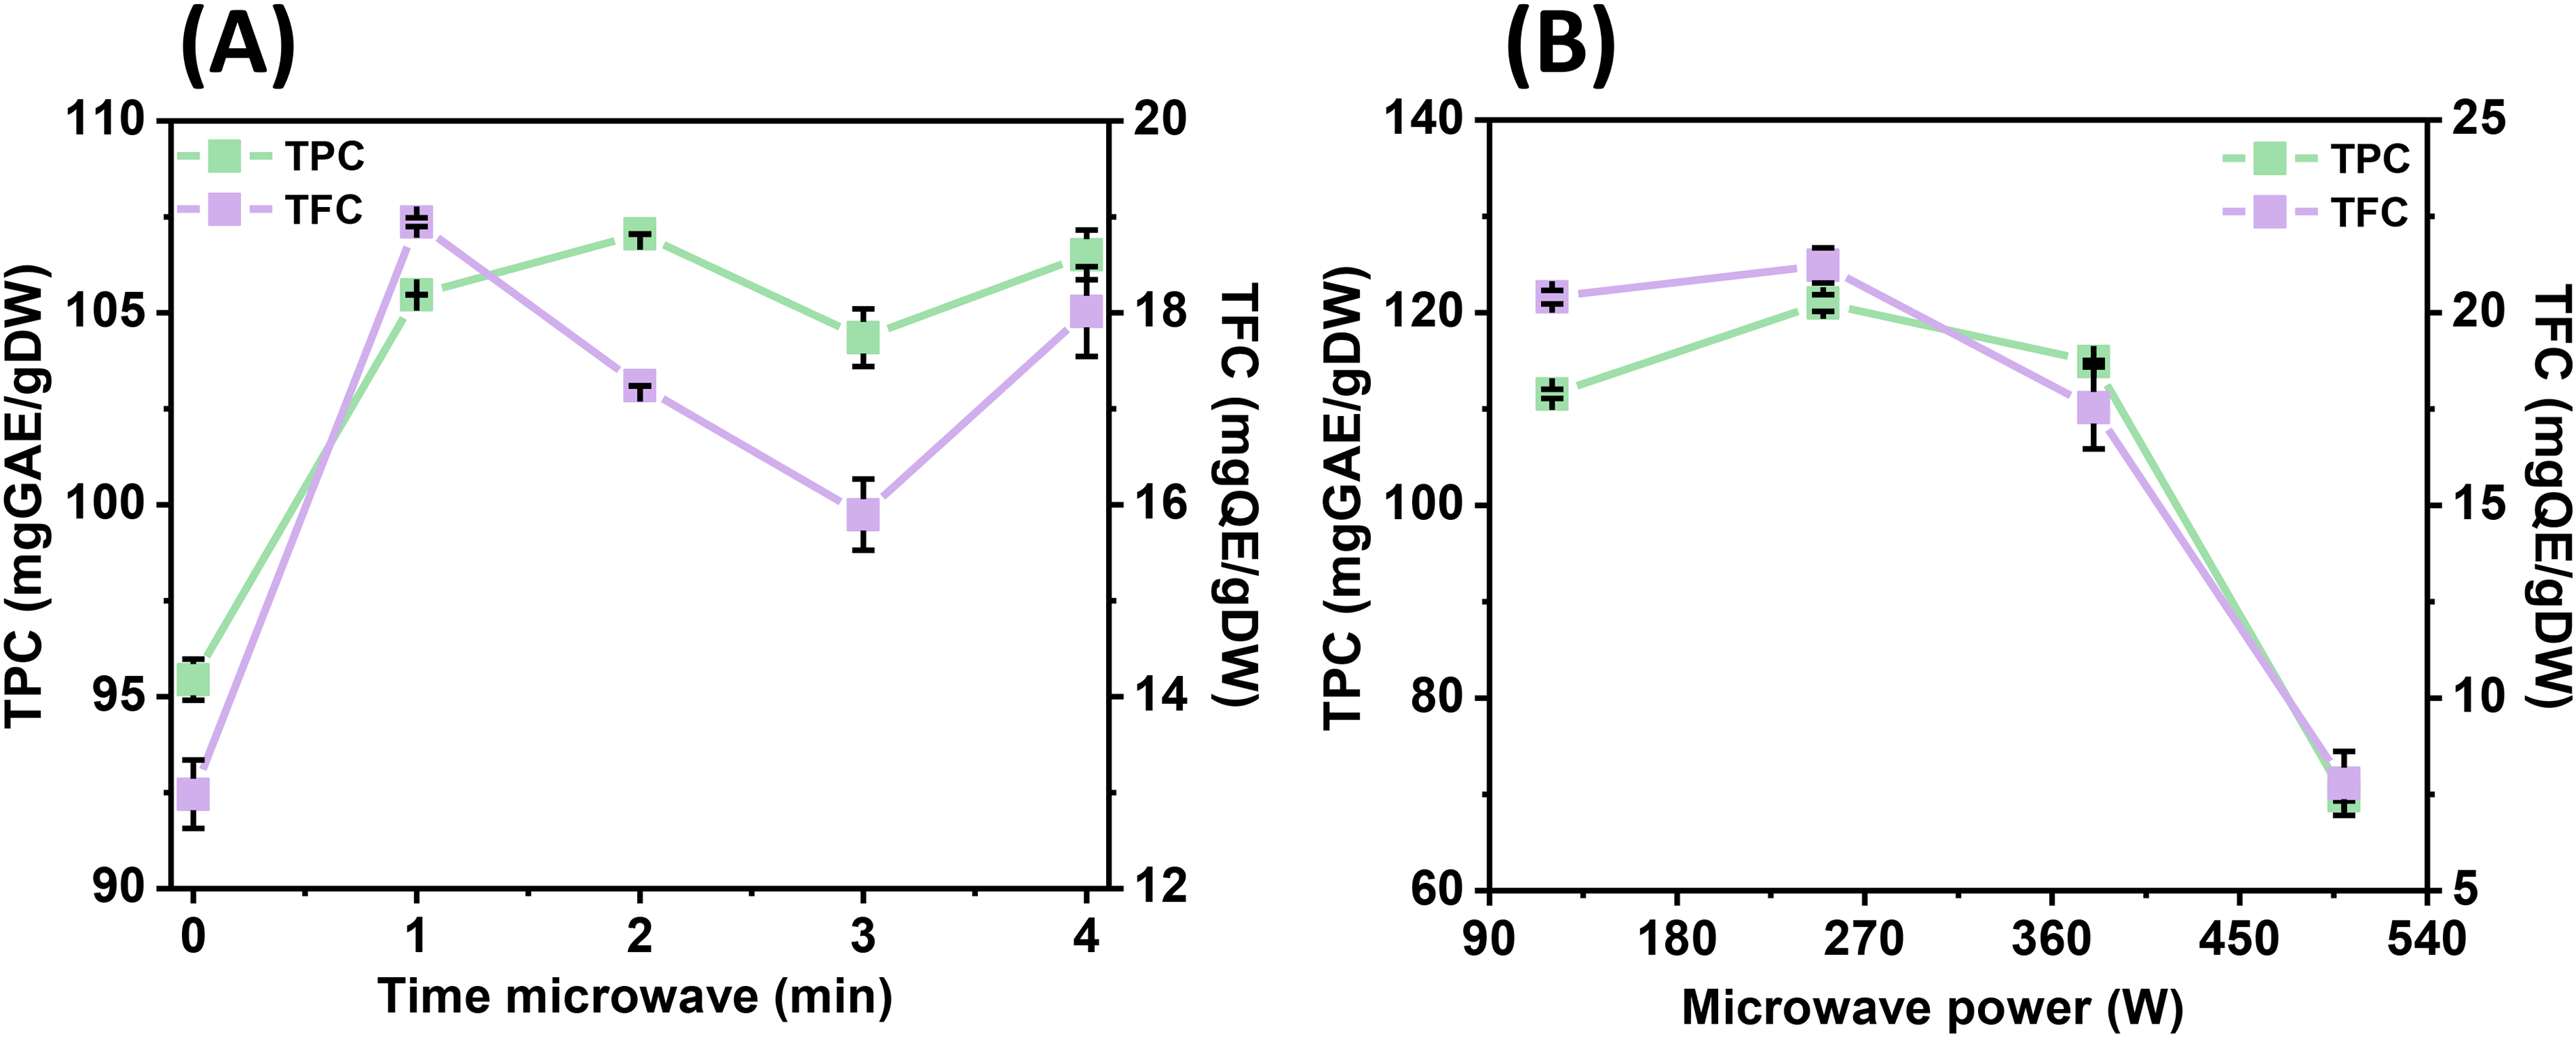
Effect of Time (A) and Microwave Power (B).
Optimizing Extraction Conditions
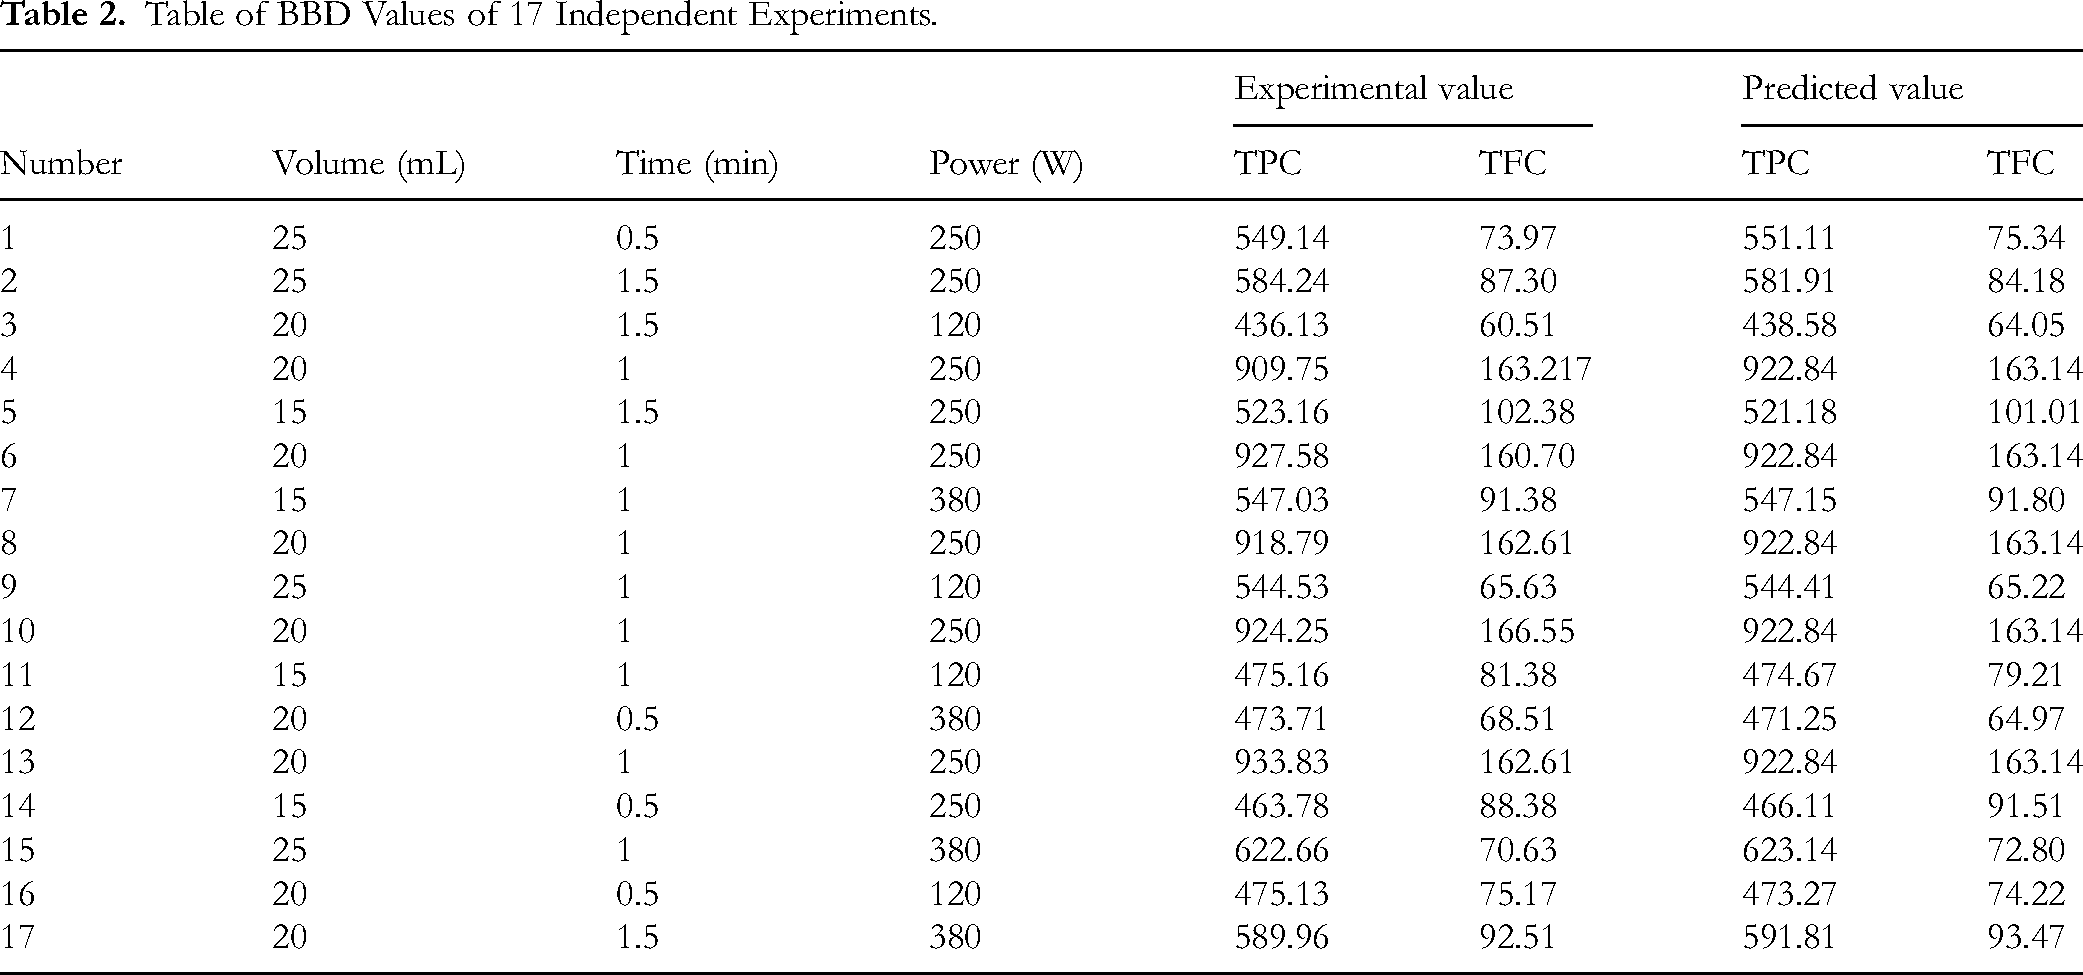
From the best adsorption conditions, the RSM model was built based on the central values and boundary values. Based on Box-Benken design (BBD), the experimental results evaluated the polyphenol and flavonoid content of the extract. From the RSM matrix, a total of 17 experiments were performed. After many times of evaluating the model and adjusting the parameters, the value range was performed according to Table 2.
Table of BBD Values of 17 Independent Experiments.
From the RSM model, the results obtained include: the quadratic equation of the model, residual value charts, line and 3D charts between factors, and variance analysis table. The quadratic equation describing the correlation between the response factor (y) and the independent variables is defined as follows:

The data of the analysis of variance and ANOVA for the regression equations are presented in Tables 3 and 4. The significance of the regression models is determined by the correlation coefficient (R2), P and F values. In general, the smaller the P value and the larger the F value, the more it proves the statistical significance of the model. The model is effective when P < .05, the model is ineffective when P > .05. A P value less than .05 proves the statistical significance of the effective factors (95% confidence level). The results of the ANOVA analysis show that the model is statistically significant (P < .05), the regression coefficient of the model R2 = 0.9994 and 0.9970 > 0.75 shows that the model is compatible with the experiment. The standard error of the model has a value < 10% of the total error, showing that the model is compatible with the experiment. In which, the Lack of fit value of the model is Polyphenol = 38.09; Flavanoid = 59.97 showing that the difference is not statistically significant > 0.05.
Variance Analysis of the Mathematical Model.

ANOVA Values of RSM Model.

From the practical experiments, the residual value charts were produced. It can be seen that the experiments are all distributed independently of each other (Appendix II, Figure S1 & S2). From there, the RSM model was used to optimize the experimental conditions. Looking at Figure 4 and Figure 5, the surface response chart can also see that the highest point of the model gives the optimal value of the material. After the experimental process and using the RSM model, it can be seen that the polyphenol content has a convergence point at the volume from 17 to 23 mL, time from 0.7 to 1.3 min, and power from 185 to 315 W. The surface plots and 3D models both show the optimal region of the evaluation model. The interaction between factors shows convergence in the 3D figure. For the flavonoid content, the convergence point is at the volume from 15 to 23 mL, time from 0.7 to 1.3 min, and temperature from 185 to 315 W.

Line Graph and Surface Plot of Polyphenol Content.
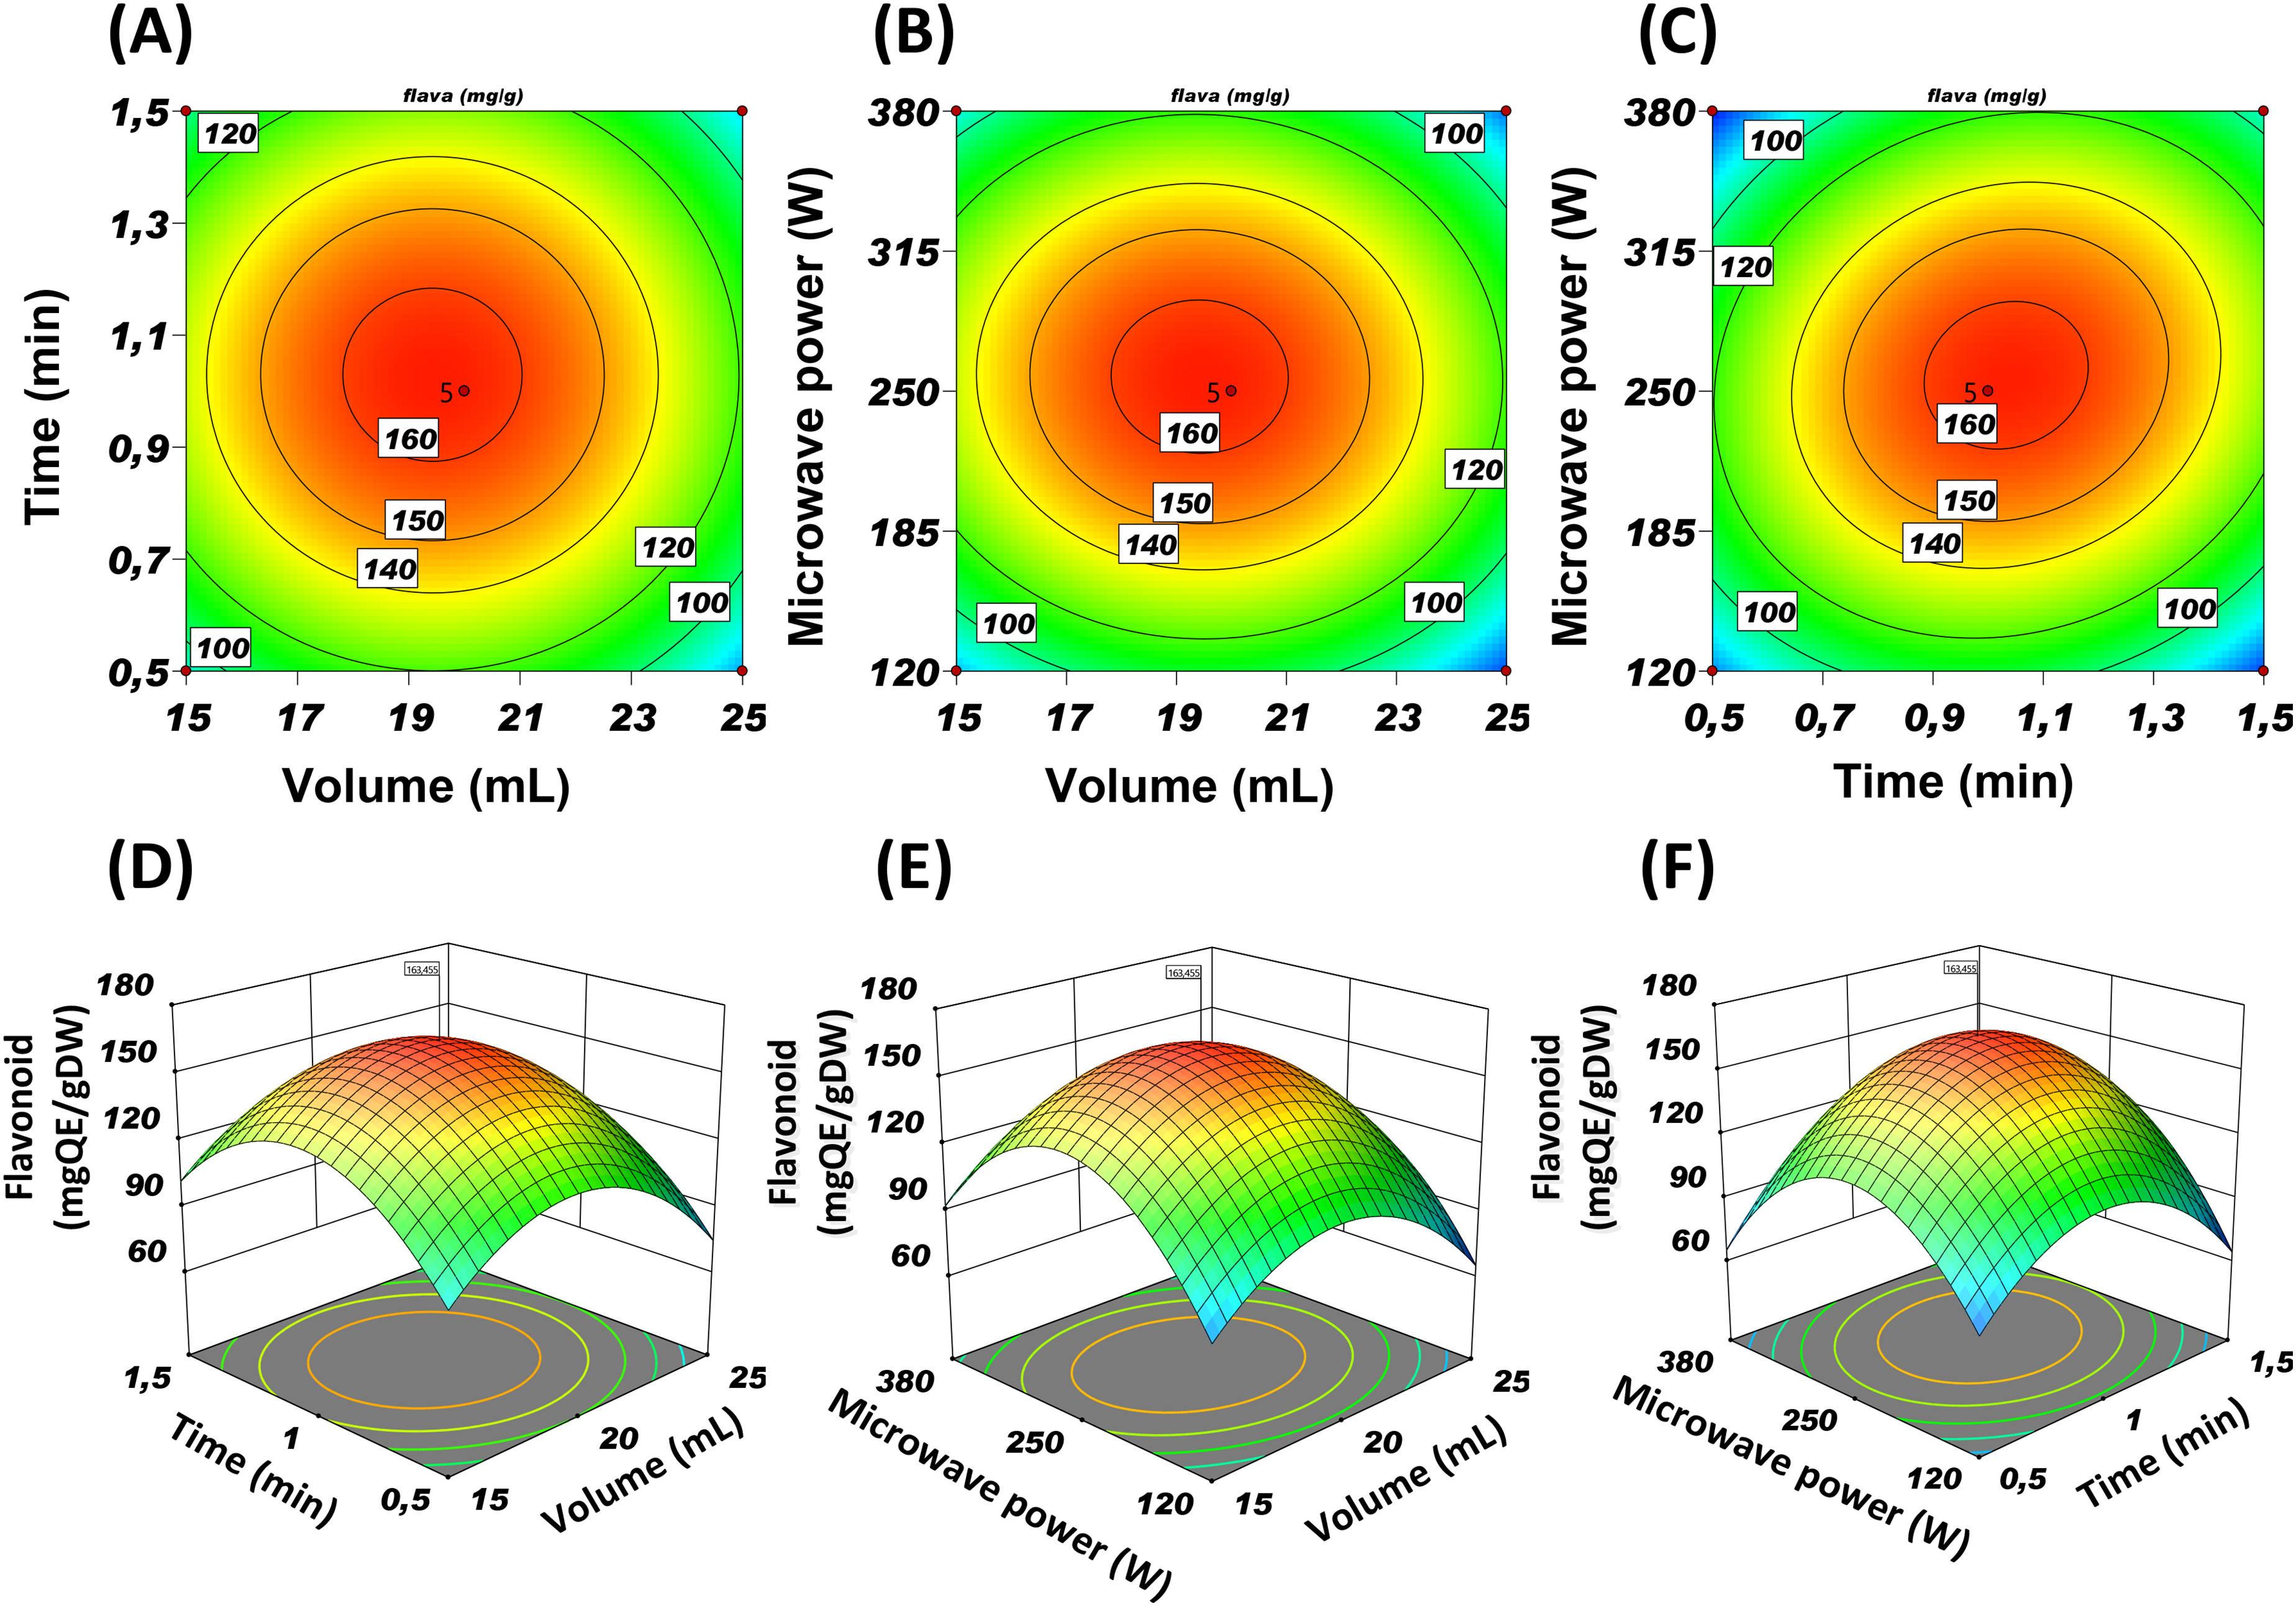
Line graph and Surface Plot of Flavonoid Content.
The optimal values will be calculated and selected based on the optimal area from the influencing factors. From Figure 6, the optimal values of polyphenol and flavonoid content are clearly shown with the most optimal values. The conditions recorded at 1 min, volume 20 mL, power 260 W for polyphenol and flavonoid content predicted from the model are 925 mgGAE/gDW and 163.5 mgQE/gDW.

Optimal Values from the RSM Model.
Antibacterial Ability
The extract of MCP was extracted with parameters optimized from the evaluation conditions of time 1 min, volume 20 mL, power 260 W gave the best polyphenol and flavonoid content. The concentrated MCP extract had a thick black-green color (Figure 7). The results of Antibacterial zones and MIC were shown in Figure 7 and Table 5. The MCP extract was prepared at concentrations of 1 and 5 mg/mL. The antibacterial circle results showed that for E. coli and S. aureus strains, there was no antibacterial circle at concentrations of 1 and 5 mg/mL

Antibacterial Zones of E. coli (A) and S. aureus (B) at Concentrations of 1 and 5 mg/mL.
MIC Evaluation of E. coli and S. aureus of MCP Extract.
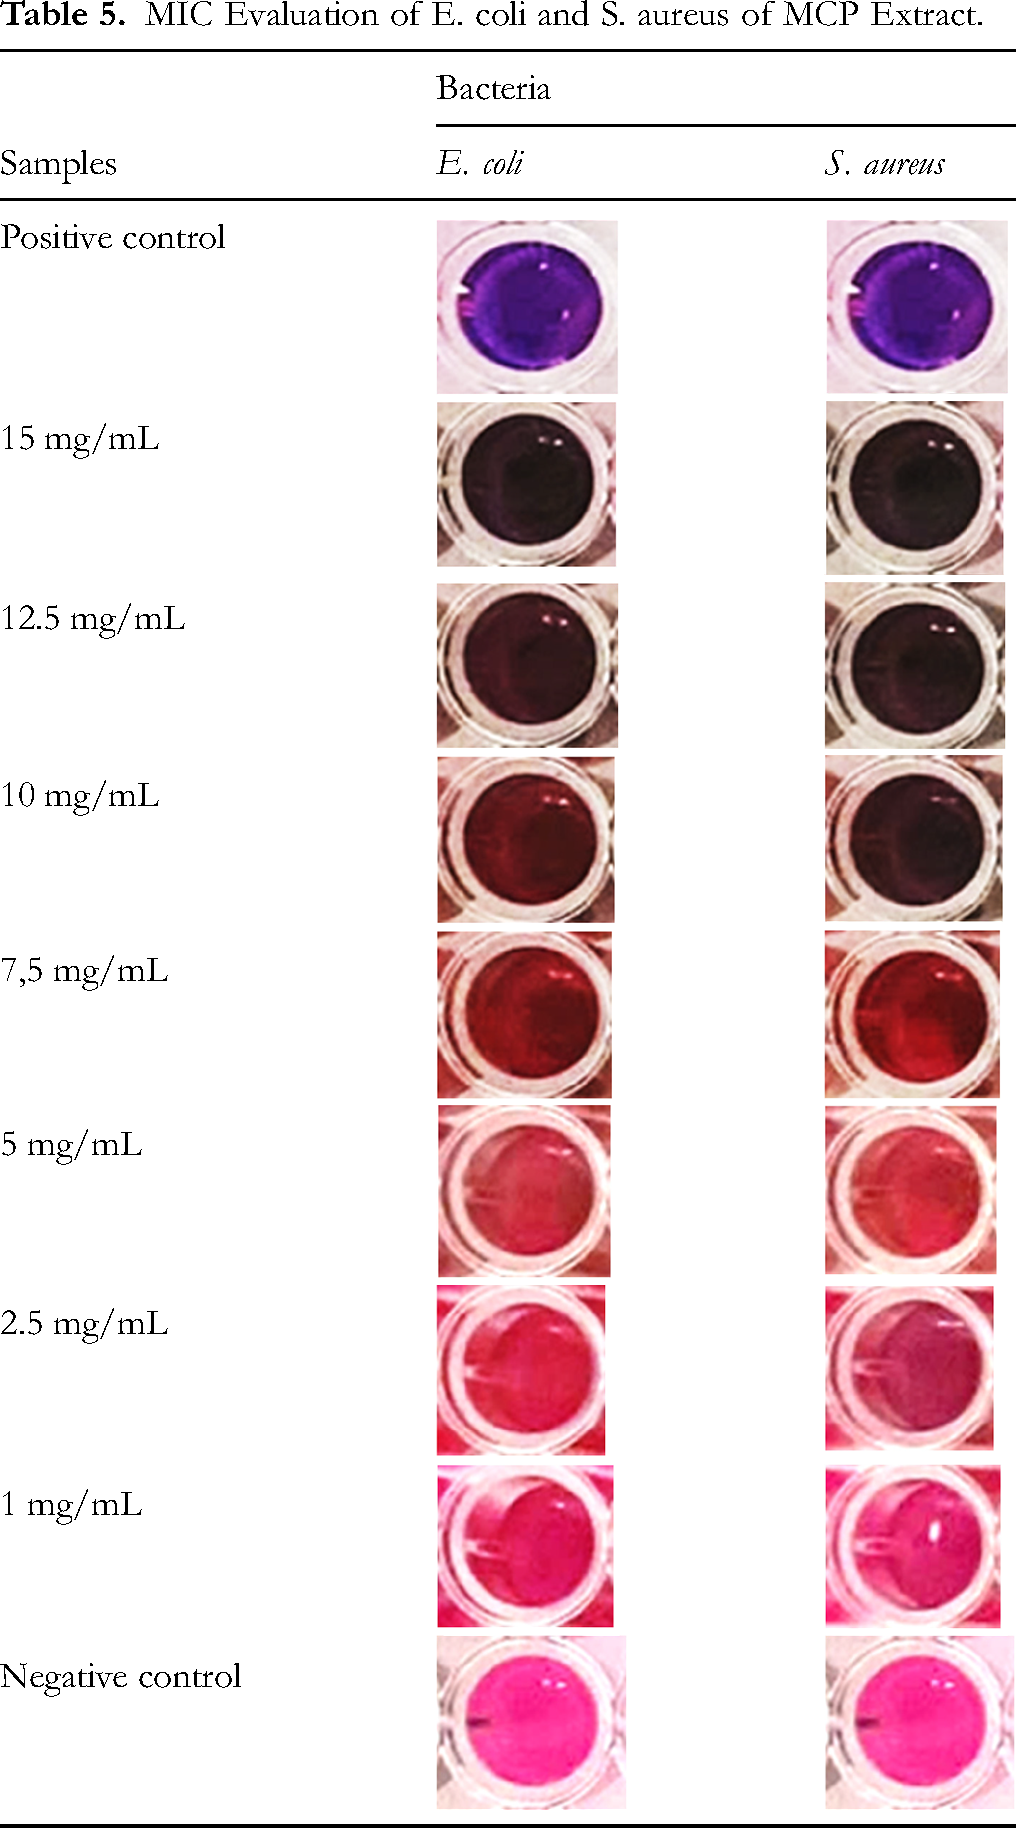
The minimum inhibitory concentration was evaluated and shown in Table 5. The sample was evaluated on two bacterial strains, E. coli (gram negative) and S. aureus (gram positive), representing gram negative and gram positive bacteria. The evaluated sample included a positive control (chloramphenicol antibiotic + bacteria), a negative control (water + bacteria), and an extract (15 mg/mL - 1 mg/mL). For the E. coli strain, the solution was dark purple, fading when reaching a concentration of 10 mg/mL. The solution turned pink at a concentration of 5 to 1 mg/mL, equivalent to the negative control sample, showing no ability to inhibit bacteria. This shows that at concentrations of 10 and 7.5 mg/mL, the bacteria in the sample are still partially inhibited. For S. aureus, the solution has a deep purple color, gradually fading when reaching a concentration of 7.5 mg/mL. The solution turns pink when at a concentration of 5 to 1 mg/mL, equivalent to the negative control sample, showing no ability to inhibit bacteria. This shows that at a concentration of 7.5 mg/mL, the bacteria in the sample are still partially inhibited.
Antioxidant Capacity
The antioxidant capacity of the MCP extract was evaluated by the ABTS and DPPH methods. The results of the standard curve showing the correlation between vitamin C concentration and antioxidant capacity were shown in (Appendix III, Figure S1 & S2). The ability to scavenge DPPH free radicals increases gradually with concentration as shown by the results of evaluating the antioxidant capacity of vitamin C and the MCP extract. The antioxidant capacity of vitamin C increased gradually from 12.43% to 88.79%. The DPPH free radical scavenging efficiency of vitamin C was lowest (12.43 ± 2.68%) at a concentration of 0.0004 mg/mL and the reduction efficiency reached over 50% at a concentration of 0.0035 mg/mL at 60.72 ± 7.48%. The ability to scavenge ABTS free radicals increased gradually from 16.93% to 99.85%. The ABTS free radical scavenging efficiency of vitamin C was lowest (16.93 ± 2.04%) at a concentration of 0.005 mg/mL and the reduction efficiency reached over 50% at a concentration of 0.015 mg/mL at 55.87 ± 0.65%. The antioxidant effect of MCP extract was determined based on the DPPH free radical neutralization efficiency. The antioxidant results were shown in Table 6. MCP extract gave an IC50 value of ABTS of 3.25 mg/mL and DPPH of 0.38 mg/mL.
IC50 Values of DPPH and ABTS Free Radical Scavenging Methods.

Anti-Inflammatory Activity
The results of the anti-inflammatory evaluation were shown in Table 7, showing that the percentage of inhibition of diclofenac is 93.54% and that of the basil extract is 41.035%. This shows that the anti-inflammatory ability of the extract was 2 times lower than that of Diclofenac.
Percentage of Anti-Inflammatory Inhibition of Basil Extract.

Comparison with Other Studies
To get an overview of the potential of MCP, the study results are compared with other studies and shown in Table 8. The results showed that the polyphenol content of different plant varieties ranged from 4 to 247 mg/g. In this study, the extract extracted by the microwave-assisted maceration method recorded a higher polyphenol content than other studies, proving that the optimisation of extraction conditions using the RSM model is effective. In addition, the antioxidant capacity was also recorded at 0.33 mg/mL. The antibacterial ability was also recorded similarly compared to other studies. The results showed that the extract or essential oil from the methane family had the best antibacterial ability against two strains of microorganisms, Staphylococcus aureus and Escherichia coli.
Results of MCP Extract with Other Studies.

(-) no value recorded
Discussion
Based on previous research, Mentha crispa was hybridized from two closely related species, Mentha spicata x Mentha suaveolens. 30 The DNA isolation and PCR process were performed using the CTAB method with some modifications. 11 The ITS is a region located between the rRNA coding genes (18S rRNA, 5.8S rRNA, 28S rRNA) in the nuclear genome of an organism. This is a fairly common region in the identification of organisms such as fungi and plants. 31 Because the ITS belongs to the nuclear genome, recombination of the gene segment between the parent and the parent will occur. This leads to the sample sequence being a mixture of both M. spicata and M. suaveolens. The sample is identified based on the ITS region as Mentha crispa. The results showed that the insoluble ash content of the raw powder was low. This shows that the material has a fairly high content of organic compounds that can be dissolved in water and some other solvents.
The studies used a variety of methods, including distillation, maceration, and microwave, as well as different solvents.10,27–29,32 In this study, the extract extracted by the microwave-assisted maceration method recorded a higher polyphenol content than other studies, proving that the optimisation of extraction conditions using the RSM model is effective. This shows good antioxidant capacity and similar results have been recorded in other studies. 10
This showed that the presence of ethanol promoted the extraction of a large amount of polyphenol compounds. However, TPC and TFC content decreased when the ethanol percentage increased from 50% to 98%. In the study of Dan-Ni Zhao, the effect of solvent concentration was also shown that at a ratio above 40% ethanol, the TFC content in the extract sample was the highest. 33 This showed that the presence of too much ethanol hindered the extraction of polyphenol compounds. In Destandau's study, it was also shown that the ratio between alcohol and water solvents also had a certain effect on the release of organic compounds into the solvent by microwave-assisted method. 34 This shows that solvent volume has a great influence on the separation process of polyphenols and flavonoids in the basil plant. In the study of Le Van Nhat Hoai, basil extract was best extracted at a solvent-to-material ratio of 1/20. In which, a higher solvent/material ratio increases the mass transfer rate due to the larger difference in concentration between the solid matrix and the common phase of the solvent. 28 This can be assumed that the microwave time caused the temperature in the sample to increase, affecting the TFC content in the extracted sample. It can be seen that the time from 1 to 2 min gave the highest polyphenol and flavonoid content. This is thought to be due to the high power leading to increased microwave heat causing polyphenol and flavonoid compounds to decompose during the extraction process. Therefore, the microwave time from 1 to 2 min and the microwave power of 250 W are chosen as one of the major influencing factors to evaluate the RSM model. It can be seen that the microwave power of 250 W gave the highest polyphenol and flavonoid content. In the study of Sara Hedayati, the microwave-assisted method was performed based on two mechanisms: (1) the electrophoresis of electron and ion molecules, which creates an electric field for particle movement, and (2) dipole rotation, due to the alternating movement of polar molecules. These two phenomena promote the release of energy, the moisture inside the cell wall interacts with the MW field, leading to an increase in temperature in the sample vessel, accelerating the rate of damage to the broken plant tissue and its content being released into the surrounding solvent in Hedayati's study. 35 This makes the microwave time and power greatly affect the extraction process of organic compounds in basil powder.
The surface plots and 3D models both show the optimal region of the evaluation model. The interaction between factors shows convergence in the 3D figure. In which, the single-factor results all show that the factors have an effect on the polyphenol and flavonoid content. However, the influence between the two factors on the polyphenol and flavonoid content showed that microwave time and power had a great influence on the polyphenol and flavonoid content. Although they had a more or less influence on TPC and TFC, the factors also showed a clear trend of increase and decrease and the optimal region of the conditions. From there, the optimal values were selected based on the line graph and surface graph. With the above conditions, the possibility of conducting the experiment is predicted to be 97.6% feasible. Therefore, the experiment was repeated 3 times with optimal conditions. The results recorded for the first experiment: polyphenol = 913 mgGAE/gDW, flavonoid = 161 mgQE/gDW; Experiment 2: polyphenol = 930 mgGAE/gDW, flavonoid = 165 mgQE/gDW, experiment 3: polyphenol = 920 mgGAE/gDW, flavonoid = 163 mgQE/gDW. The experimental results showed that the prediction model was very compatible with the experiment.
The MCP extract had a moisture content of 12%. The extract was re-evaluated for polyphenol and flavonoid content and other activities such as antibacterial, antioxidant and anti-inflammatory. Antibacterial ability was an important value in evaluating the biological activity of basil extract. Antibacterial ability was performed based on qualitative (resistance circle on agar plate) and quantitative (Minimum Inhibitory Concentration, MIC) methods. This shows that the concentration of the extract may not be enough to demonstrate antibacterial ability. Therefore, the extract would be evaluated for minimum inhibitory concentration at concentrations above 5 mg/mL. The results showed that the positive control sample was blue and the negative control sample was dark pink. The evaluated samples changed from purple to pink as the concentration of the extract decreased. MIC evaluation results showed that basil extract had better antibacterial ability against gram-positive bacteria than gram-negative bacteria when the minimum inhibitory concentration of E. coli was 10 mg/mL and S. aureus was 7.5 mg/mL.
After studying the polyphenol and flavonoid content of the MCP, the next step was to investigate and evaluate the antioxidant activity. These findings will be useful in the evaluation and standardization of the quality of the MCP extract. The antioxidant activity was demonstrated by the donation of a hydrogen atom by the antioxidant to reduce the purple DPPH free radical to the yellow DPPH-H, which was determined by measuring the photometrically at 517 nm. The fact that antioxidants have been reported to be able to scavenge ABTS•+ via the donation of a hydrogen atom (5), as well as via electron transfer (13) or even a combination of both mechanisms (10), was determined by measuring the photometrically at 734 nm.36–38 It can be seen that the minimum 50% inhibitory concentration of the MCP extract from the ABTS method has a higher concentration value than the DPPH method, corresponding to lower activity. In the study of author Hoai Nhat, it was shown that the antioxidant capacity of MCP was 3.83 mg/g (DPPH) and 2.84 mg/g (ABTS) respectively. 39 In the study of Doman, it showed a similar antioxidant capacity result of 200 ug/mL by the DPPH method. 40 In addition, according to Gonçalves’ study, MCP has an antioxidant capacity of 60.88%. 41 It can be seen that MCP extract has good antioxidant potential.
In the extract of MCP, there are some flavanone compounds, so the anti-inflammatory ability was an important value. The anti-inflammatory ability was evaluated by the percentage of inhibitory activity of the sample compared to the standard sample of Diclofenac. Measure the absorbance at 660 nm, the blank sample was water, buffer and albumin. In a study of the anti-inflammatory potential of Mentha piperita on Murine macrophage cell line RAW 264.7 stimulated with LPS. Reducing the LPS-induced production of NO, TNF-a, and IL-6 compared with treated control. 42 This suggests that further studies are needed for the anti-inflammatory potential of Mentha crispa. This shows that the extract of the basil has anti-inflammatory ability. Studies on the anti-inflammatory ability of Methan plants are still quite limited. Anti-inflammatory studies focus mainly on mint (Mentha spicata). This is a shortcoming and a gap that has not been fulfilled. In-depth studies on the anti-inflammatory ability will help open up the potential applications of Methan plants.
Conclusion
The raw materials of mint were purchased from gardens in Giong Rieng town, Giong Rieng district, Kien Giang province. The raw materials of mint were sent to ATGC Company Limited for analysis and identification. The collected mint was identified as a plant with the scientific name Mentha crispa by the method of plant identification using DNA barcodes. The study has shown the good efficiency of microwave-assisted extraction method combined with the optimization of extraction conditions by RSM method in obtaining TPC, TFC. RSM model optimized extraction conditions of 2 g/40 mL, time of 1 min, power of 260 W, and using 50% ethanol solvent with TPC (925 mgGAE/gDW) and TFC (163.5 mgQE/gDW), respectively. Besides, it still ensures the biological activities that the methanogens bring. There is still little research on the anti-inflammatory ability of MPC extracts. This is a gap for researchers to focus on, when methane extracts have been widely applied in many fields.
Supplemental Material
sj-docx-1-npx-10.1177_1934578X251382334 - Supplemental material for Applying Response Surface Methodology to Optimize Microwave-Assisted Extraction Process from Mentha Crispa in Vietnam
Supplemental material, sj-docx-1-npx-10.1177_1934578X251382334 for Applying Response Surface Methodology to Optimize Microwave-Assisted Extraction Process from Mentha Crispa in Vietnam by Vy Khanh Nguyen, Thien Hien Tran, Quoc Toan Tran, Hong Nhan Le Thi and Bich Ngoc Hoang in Natural Product Communications
Footnotes
Acknowledgements
We acknowledge Nguyen Tat Thanh University, Ho Chi Minh City, Vietnam for supporting this study.
Ethical Approval
Ethical Approval is not applicable for this article.
Statement of Human and Animal Rights
This article does not contain any studies with human or animal subjects.
Statement of Informed Consent
There are no human subjects in this article and informed consent is not applicable.
Author Contributions
Writing-original draft preparation B.N.H and K.V.N.; data curation L.T.H.N. and K.V.N.; methodology T.T.H. and T.Q.T; writing-review and editing B.N.H. All authors have assented to the manuscript's published version.
Funding
The authors disclosed receipt of the following financial support for the research, authorship, and/or publication of this article: This research was fund by a grant from the Science and Technology Development Foundation of Nguyen Tat Thanh University with code (2025.01.58/HĐ-KHCN).
Declaration of Conflicting Interests
The authors declared no potential conflicts of interest with respect to the research, authorship, and/or publication of this article.
Data Availability
Data included in article/Supplemental material/referenced in article.
Supplemental Material
Supplemental material for this article is available online.
References
Supplementary Material
Please find the following supplemental material available below.
For Open Access articles published under a Creative Commons License, all supplemental material carries the same license as the article it is associated with.
For non-Open Access articles published, all supplemental material carries a non-exclusive license, and permission requests for re-use of supplemental material or any part of supplemental material shall be sent directly to the copyright owner as specified in the copyright notice associated with the article.