
Abstract
The root of a ginseng-like plant named Codonopsis javanica is a valuable ingredient in folk medicine with diverse biological properties and has been used in treatments for various diseases, including leukemia, inflammation, and hepatitis. This study aimed to optimize various parameters related to the extraction process of C. javanica root (CJR) with respect to total phenolic content (TPC), total flavonoid content, and antioxidant activities of the obtained CJR extract. We first performed a series of single-factor investigations taking drying conditions and different extraction parameters such as material size, extraction solvent, solvent concentration, extraction temperature, material/solvent ratio, extraction cycle, and stirring speed as varying factors. Then, a response surface methodology procedure was adopted with a central composite design to optimize further the extraction process in order to maximize the TPC. We found that the use of convection drying at 70 °C for 8 hours gave the extract with the highest TPC and antioxidant activities. Optimal extraction parameters were found as follows: ethanol with a concentration of 56.0% as the solvent, material-to-solvent ratio of 1/38.0 g/mL, extraction time of 67.2 minutes, material size ≤0.5 mm, temperature 60 °C, through 1 extraction cycle, and with a stirring speed of 300 rpm. Under the optimized conditions, the experimental value for TPC was 2.9 mg gallic acid equivalent (GAE)/g dry weight (DW), which is reasonably close to the value predicted by the model (2.8 mg GAE/g DW). The half-maximal inhibitory concentration (IC50) values determined by the 2,2-diphenyl-1-picrylhydrazyl and 2,2′-azino-bis(3-ethylbenzothiazoline-6-sulfonic acid free radical tests of the CJR extract obtained under optimal conditions were 1042.3 and 299.0 µg/mL, respectively.
Codonopsis javanica (Blume) Hook.f. & Thomson, known as “Đẳng Sâm” in Vietnamese, has been known for its abundance in active ingredients, and its medicinal value is comparable with that of ginseng species.
1,2
Flavonoids that have been identified in C. javanica include chrysoeriol-7-O-β-
Evaluation of the pharmacological effects of C. javanica root (CJR) extract in mouse models has been the focus of many studies. Chen et al demonstrated that the extract of CJR reduces blood insulin and lipid peroxidation in the insulin-resistant rat model, created by exposing mice to fructose for a long time.
8
In another study, a polysaccharide isolated from C. javanica was shown to have an effect on anemia-brain reperfusion in mouse models.
9
Similarly, the positive effect of C. javanica polysaccharide has been confirmed in Alzheimer’s-induced brain damage of mice induced by
To date, a number of studies involving recovery processes from well-documented species of Codonopsis have been attempted, such as C. lanceolata 16 and C. pilosula. 17 However, despite pharmacological values for C. javanica, investigations that deal with the extraction process of active ingredients from this species have been scarce. In this study, we optimized the extraction process by considering a wide range of processing parameters, including drying conditions, material size, extraction solvent, solvent concentration, extraction temperature, material/solvent ratio, extraction cycle, and stirring speed. Desirable outcomes were selected such as total phenolics content (TPC), total flavonoids content (TFC), and antioxidant activity of the obtained extract. The results were expected to contribute to the refinement of extraction processes of medicinal plant materials in general and with CJR in particular.
Results and Discussion
Effect of Drying Process Parameters on CJR Extraction
Moisture is an important factor affecting the preservation of raw materials. High humidity promotes the growth of bacteria, mold, and insects and causes materials to degrade with prolonged preservation. In addition, moisture also affects the extraction efficiency of plant organic compounds. In this investigation, we selected the optimal drying conditions by evaluating the moisture content and TPC of the CJR after being dried. The drying was carried out using conduction and convection at different drying times.
Conduction drying
Humidity and TPC of materials obtained after conduction drying with various parameters are shown in Figures 1 and 2. The results showed that a longer drying time seemed to associate with a lower moisture content of the material, and the evaporation rate was also greatly accelerated when the drying temperature increased from 50 °C to 70 °C (Figure 1). According to the Vietnamese Pharmacopeia Fifth Edition (DDVN 5), the required humidity for Đẳng Sâm (CJRs) to be usable in medicinal applications is <15%, which corresponded to the humidity obtained at 18 hours, 12 hours, and 8 hours, respectively, at temperatures of 50 °C, 60 °C, and 70 °C, respectively. The TPC of the material also tended to increase with prolonged drying time and lower humidity. However, prolonging the drying time past a certain point will cause humidity and TPC to reverse (Figure 2). This can be explained by the weakened link between water and protein and other water-forming components of the material caused by lowered humidity. The movement of the solvent into the material is therefore hindered, slowing down the diffusion process and lowering extraction efficiency. High humidity also presents difficulties in splitting the materials and reducing the material contact area with the solvent. However, excessively long drying time may cause the active ingredients in the material to oxidize, reducing overall product quality. Based on the survey results, we selected a suitable drying condition of 70 °C for 10 hours.

Effect of drying time (hours) and temperature (°C) on raw material moisture of Codonopsis javanica root dried with conduction drying.

Effects of drying time (hour) and temperature (°C) on the total phenolics content of Codonopsis javanica root dried with conduction drying.
Convection drying
In this investigation, the drying and extraction conditions for the evaluation of TPC content were similar to those for conventional drying. The reported results also share some similarities with those in the conventional drying method. To be specific, longer convection drying was found to lower the moisture content of the material, and elevated drying temperature apparently accelerated the evaporation rate (Figure 3). However, due to the continuous air circulation in the drying instrument, materials dried by convection drying required a lower drying time to attain the same humidity to that required by the conduction drying method. Referencing to the humidity standard (≤15%), we found that this level of humidity was attained after 12 hours, 8 hours, and 8 hours, respectively, at temperatures of 50 °C, 60 °C, and 70 °C, respectively. Similar to the previous investigation, the TPC of the material also tended to increase as drying was prolonged and decrease during a very long drying time (Figure 4). Based on the survey results, we selected the convection drying method with suitable drying conditions of 70 °C for 8 hours to conduct the following investigations.

Effect of drying time (hour) and temperature (°C) on raw material moisture of Codonopsis javanica root dried with convection drying.
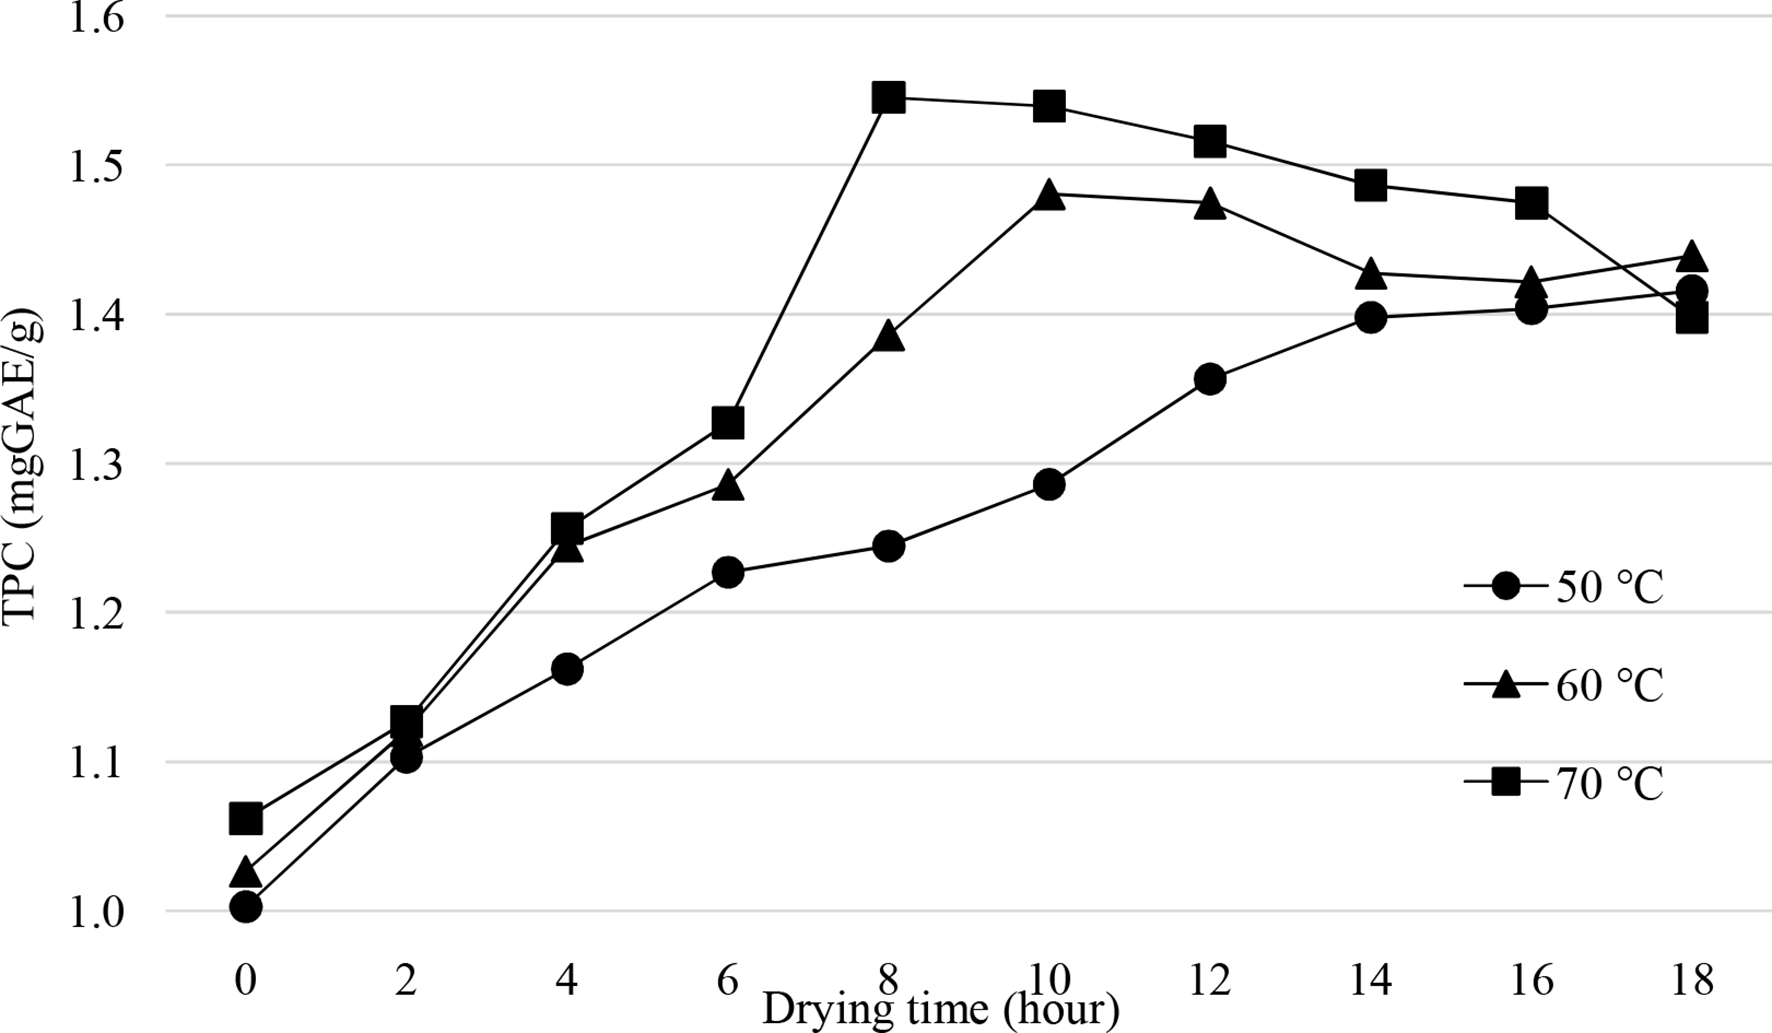
Effects of drying time (hour) and temperature (°C) on the total phenolics content (TPC) of Codonopsis javanica root dried with convection drying.
Effect of Material Size on TPC, TFC, and Antioxidant Activities of CJR Extract
Along with the material’s moisture content, the size of the powdered material is also a factor that influences the extraction process. Figure 5 presents TPC, TFC, and antioxidant activities, expressed by 2,2′-azino-bis(3-ethylbenzothiazoline-6-sulfonic acid (ABTS), with respect to different material sizes: ≤0.5 mm; 0.5-0.1 mm; 1-1.5 mm, and 1.5-2 mm. Overall, a small material size led to increased TPC, TFC, and ABTS values.

Effect of material size (mm) on Codonopsis javanica root extraction efficiency. ABTS, 2,2′-azino-bis(3-ethylbenzothiazoline-6-sulfonic acid; TPC, total phenolics content; TFC, total flavonoids content.
The relationship could be explained by the mass transfer area per unit volume of extract, which is altered by different material sizes. Specifically, the mass transfer area increases with decreasing material size, and as the material is broken down, more cells are broken, accelerating compound release. Based on the results of the survey, we selected the appropriate material size of smaller than 0.5 mm, corresponding with TPC, TFC, and ABTS values of 1.9 mg of gallic acid equivalent (GAE)/g dry weight (DW), 1.6 mg of quercetin equivalent (QE)/g DW, and 2.2 mg of ascorbic acid equivalent (AAE)/g DW, respectively, for further experiments.
Effect of Solvent on CJR Extraction Process
The choice of solvent may affect the type and quantity of the extracted compounds because the solubility of the compounds is greatly influenced by the polarity of the solvent used. The results showed that TPC, TFC, and ABTS could be largely determined by the solvent. The highest values were attained when extracting with 50% methanol, followed by 50% ethanol, 50% acetone, water, ethyl acetate, and n-hexane (Figure 6). This result suggested that the polarity of the solvent had a great influence on the extraction efficiency due to the medium to high polarity of polyphenols and flavonoids, causing them to be easily soluble by versatile solvents such as either ethanol or methanol. Compared with methanol, ethanol is a less toxic solvent and is commonly used in food processing and preservation. In addition, outcomes attained by using ethanol (TPC of 1.9 mg GAE/g DW, TFC of 1.5 mg QE/g DW, and ABTS of 2.2 mg AAE/g DW) were not significantly lower than those achieved by using methanol. Thus, based on the survey results, we selected ethanol as the solvent to extract CJR materials in further experiments.

Effect of solvent on Codonopsis javanica root extraction efficiency. ABTS, 2,2′-azino-bis(3-ethylbenzothiazoline-6-sulfonic acid; TPC, total phenolics content; TFC, total flavonoids content.
Effect of Solvent Concentration on CJR Extraction Process
The concentration of the solvent would greatly affect the extraction efficiency obtained since the increased polarity of a diluted solvent contributes to enhanced yields of polarizing antioxidant compounds. Current results showed that TPC, TFC, and ABTS all increased when the ethanol concentration increased from 0% to 60%. Afterward, increasing the ethanol concentration further caused all indicators to decrease (Figure 7). The degree of polarization of the solvent depends on the dielectric constant and the hydrogen bond value, both of which of water are higher than those of ethanol. Therefore, depending on the ratio, the ethanol-water mixture will have different polarities. The results showed that the extracted polyphenol and flavonoid components in CJR were affected by the concentration of the ethanol solution. Raising the concentration of ethanol from 0% to 60% caused TPC, TFC, and ABTS to rise significantly. However, results obtained from 80% ethanol were not considerably improved in comparison with those from 60% ethanol; the use of pure ethanol as the solvent caused noticeable degradation in all indicators. Based on the results of the survey, 60% ethanol was selected as the appropriate solvent to extract CJR. TPC, TFC, and ABTS values at this concentration were 2.1 mg GAE/g DW, 1.6 mg QE/g DW, and 2.4 mg AAE/g DW, respectively.

Effect of ethanol concentration (mg/g) on Codonopsis javanica root extraction efficiency. ABTS, 2,2′-azino-bis(3-ethylbenzothiazoline-6-sulfonic acid; TPC, total phenolics content; TFC, total flavonoids content.
Effect of Temperature on CJR Extraction Process
Another factor that may affect the extraction efficiency and biological activity of the extract is the extraction temperature because it increases the solubility and diffusion of compounds, reduces solvent viscosity, and facilitates the mass transfer and solvent penetration into cells. The results showed that increasing the temperature led to improved TPC, TFC, and ABTS values (Figure 8). Accordingly, the TFC and ABTS reached the highest values of 1.8 mg QE/g DW and 2.6 mg AAE/g DW, respectively, at a temperature of 60 °C. The TPC peaked at 2.4 mg GAE/g DW at 70 °C, but, in comparison with the TPC obtained at 60 °C, the TPC difference was marginal. As the temperature increased past 70 °C, the antioxidant activity of the extract degraded significantly, achieving an ABTS content of 2.4 mg AAE/g DW at 80 °C. The relationship could be explained by the decomposition of thermally sensitive compounds at very high heat levels, which reduces extraction and economic efficiency due to loss of energy. In this investigation, 60 °C was selected as the suitable temperature for the extraction process.
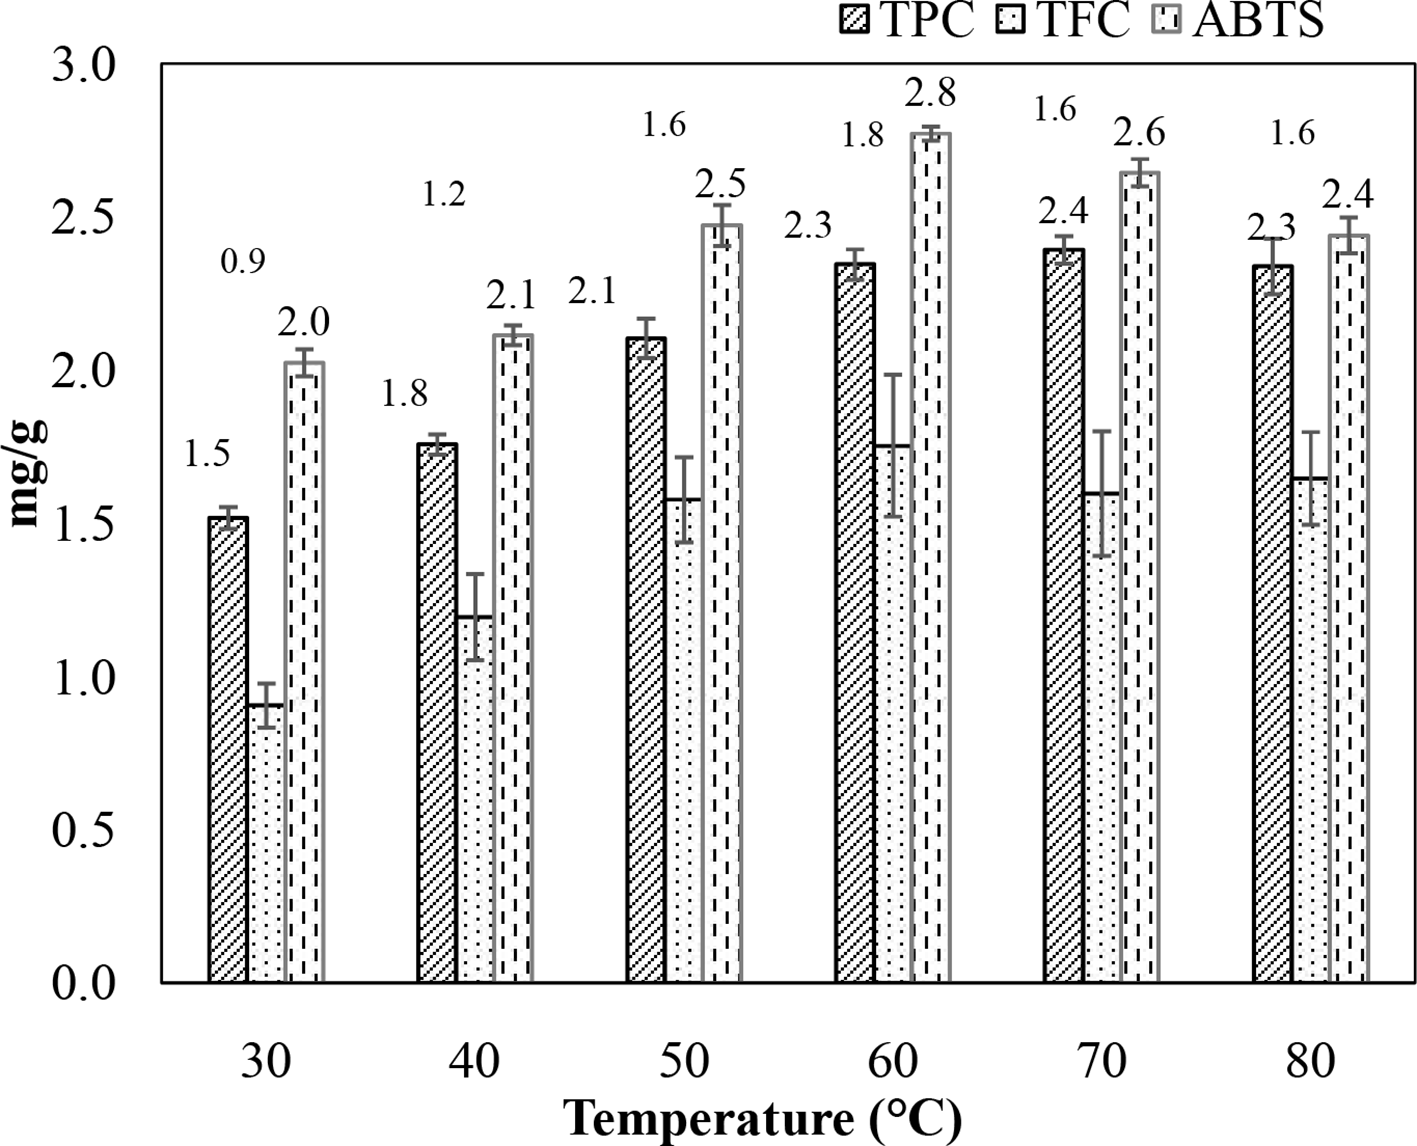
Effect of temperature on Codonopsis javanica root extraction efficiency. ABTS, 2,2′-azino-bis(3-ethylbenzothiazoline-6-sulfonic acid; TPC, total phenolics content; TFC, total flavonoids content.
Effect of Extraction Time on CJR Extraction Process
Similar to extraction temperature, extraction time is also a factor that not only affects the extraction efficiency but also the cost and quality of the obtained extract. Figure 9 presents the effect of extraction duration on TPC, TFC, and ABTS of the product. It was found that as the duration was prolonged from 15 to 60 minutes, TPC, TFC, and ABTS values were also improved and reached the highest levels of 2.5 mg GAE/g DW, 1.9 mg QE/g DW, and 2.8 mg AAE/g DW, respectively, with a duration of 60 minutes. The concentration of phenolic compounds tended to decrease as the extraction time was extended further past 60 minutes. The decomposition of compounds is in part responsible for this phenomenon. In addition, a long extraction time may also cause evaporation of the solvent. Therefore, an extraction time of 60 minutes was selected for the extraction process.
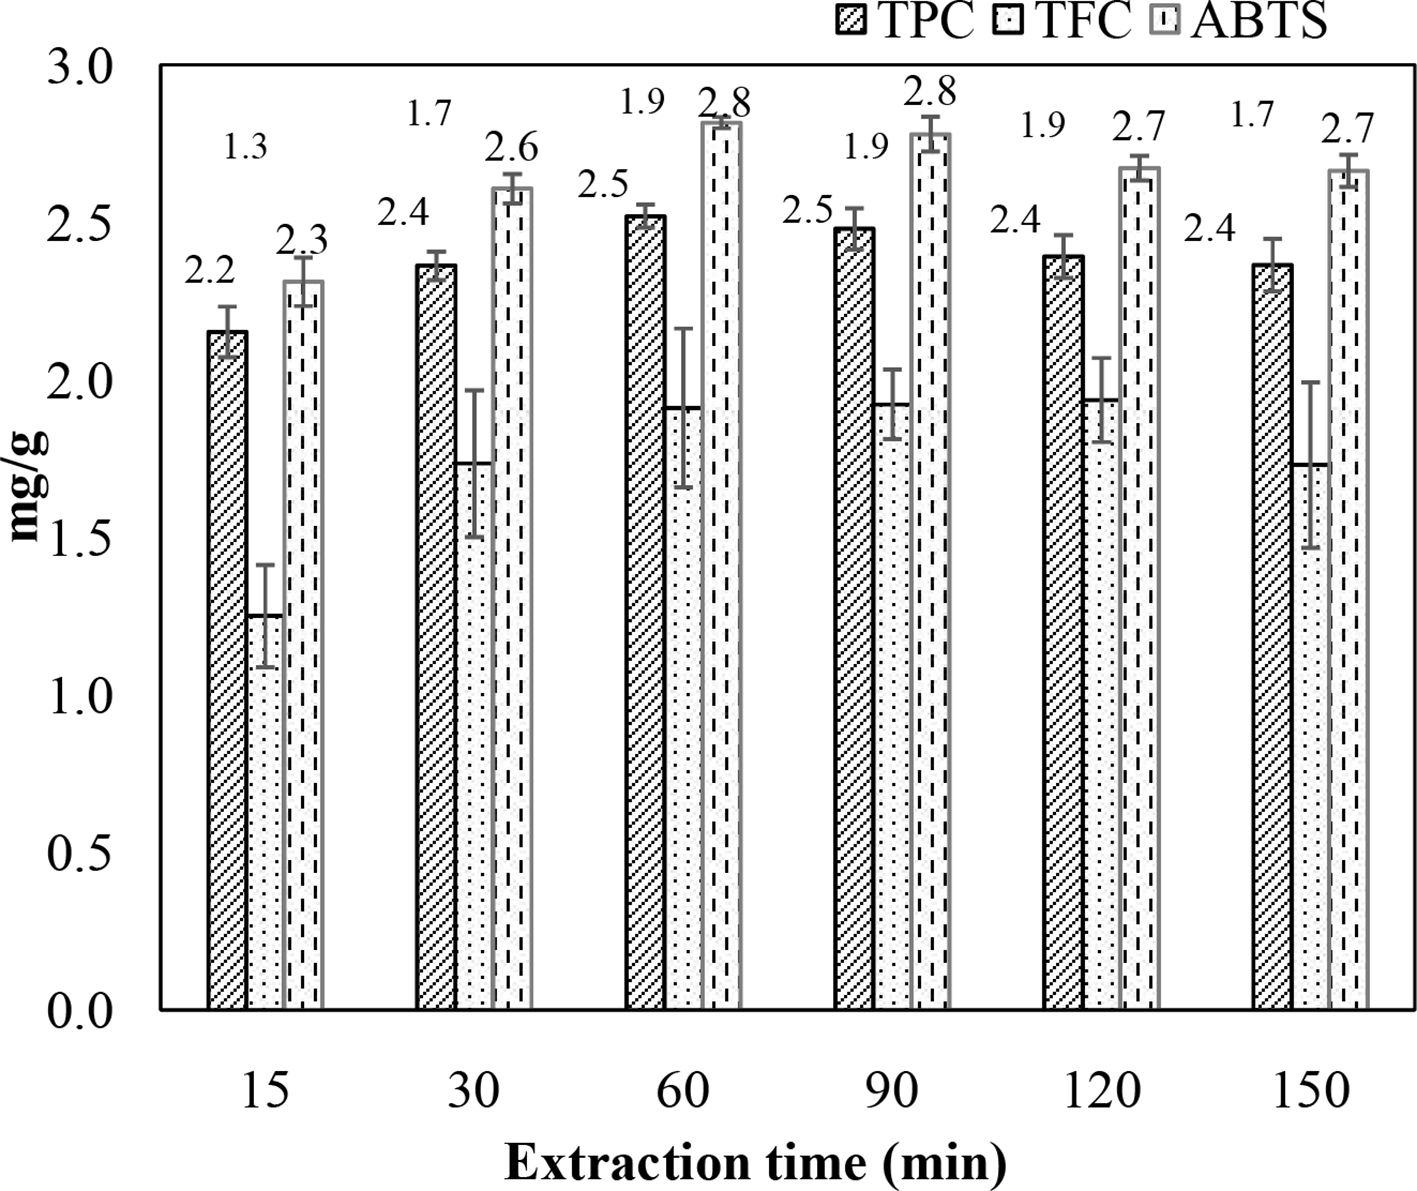
Effect of extraction time (min) on Codonopsis javanica root extraction efficiency. ABTS, 2,2′-azino-bis(3-ethylbenzothiazoline-6-sulfonic acid; TPC, total phenolics content; TFC, total flavonoids content.
Effect of Material/Solvent Ratio on CJR Extraction Process
The quantity of solvent used to material might also affect the dissolution of compounds and thus extraction efficiency. It was found that TPC, TFC, and ABTS of the obtained extract seemed to be positively correlated with the material/solvent ratio. However, as the ratio increased past a certain level, the 3 indicators ceased to increase significantly and started to decrease gradually when an excessive amount of solvent was used (Figure 10). At the ratio of 1/40, values for TPC and ABTS peaked at 2.8 mg GAE/g DW and 3.0 mg AAE/g DW, respectively. The highest value for TFC was achieved at the ratio of 1/50, at 2.7 mg QE/g DW. While an insufficient amount of solvent could be detrimental to the dissolution and extraction efficiency of polyphenols from cells, an excessive amount of solvent might not contribute to higher extraction efficiency of polyphenols since the balance between the phases has already been attained. These results are in accordance with the principle of mass transfer, indicating that mass transfer is largely determined by concentration gradient between solids and solvents, and an increase in the amount of solvent could both promote the diffusion and increase the likelihood of contact between components and the solvent, resulting in improved extraction efficiency. However, the content of biologically active ingredients will not continue to increase once a balance has been reached. 18 Therefore, based on the results of the survey, we selected an appropriate material/solvent ratio of 1/40 (g/mL) for extraction.

Effect of material/solvent ratio on Codonopsis javanica root extraction efficiency. ABTS, 2,2′-azino-bis(3-ethylbenzothiazoline-6-sulfonic acid; TPC, total phenolics content; TFC, total flavonoids content.
Effect of Number of Extraction Cycles on CJR Extraction Process
The number of feasible extraction cycles is also an important factor to justify the economic efficiency of the established extraction process. The results showed that the cumulative TPC increased when the number of extraction cycles increased from 1 to 3 (Figure 11). However, the improvement was not significant. Specifically, after 3 extraction cycles, the cumulative TPC was 2.9 mg GAE/g DW, which is only 3.4% higher compared with the TPC attained after the first extraction. Similar trends could be observed with TFC and ABTS antioxidant activity. This can be explained as follows. Since extraction is the process of molecular diffusion, the substance needs to dissolve in the solvent and diffuse from the cell. As such, the extraction is completed when a balance is achieved between the intracellular and extracellular concentrations of the bioactive components. Carrying out additional extraction cycles cannot cause the extraction efficiency to improve significantly due to the depletion of substances remaining in the material and might diminish economic efficiency. From the reported results, a 1-cycle extraction is suitable for extracting antioxidant compounds from the CJR.

Effect of number of extractions on Codonopsis javanica root extraction efficiency. ABTS, 2,2′-azino-bis(3-ethylbenzothiazoline-6-sulfonic acid; TPC, total phenolics content; TFC, total flavonoids content.
Effect of Stirring Speed on CJR Extraction Process
The effect of agitation speed on the extraction efficiency of antioxidant compounds in CJR is shown in Figure 12. It was shown that compared with no stirring, stirring induced higher TPC, TFC, and ABTS. Specifically, with a stirring speed of 300 rpm, TPC, TFC, and ABTS peaked at 2.9 mg GAE/g DW, 2.3 mg QE/g DW, and 3.0 mg AAE/g DW, which are higher than those obtained without agitation by 11.8%, 10.7%, and 11.2%, respectively. This is in accordance with the study of Mohamad et al, which articulated that since the solute moved toward the outside through the diffusion or capillary process, agitation of the solution might lead to an increase in the mass transfer coefficient, which reduces the size of the boundary layer surrounding the material and impairs the extraction process. 19 Therefore, we selected 300 rpm stirring speed for the process of extracting CJR.

Effect of stirring speed (rpm) on Codonopsis javanica root extraction efficiency. ABTS, 2,2′-azino-bis(3-ethylbenzothiazoline-6-sulfonic acid; TPC, total phenolics content; TFC, total flavonoids content.
Optimization of TPC of the CJR Extract via RSM
In previous exploratory surveys, optimal values for various process parameters were determined with respect to maximal TPC, TFC, and antioxidant activities of the obtained CJR extract. We then proceeded to carry out a response surface methodology (RSM) procedure to account for the effect of the interaction of process variables on TPC. We selected 3 parameters (solvent concentration, solvent/material ratio, and extraction time) to establish the RSM model. Table 1 presents independent factors and their corresponding levels. Each experiment was conducted independently, randomly, and designed by a possible combination of 3 elements with 5 different levels (–α, –1, 0, +1, and +α). Moreover, to identify experimental errors, 6 repetitive experiments at the central location were conducted. The obtained experimental data were then used to fit a second-order function taking TPC as the dependent variable.
Experimental Layout Matrix Encodes Independent Variables.

The combinations of experimental conditions generated by Central Composite Design and their corresponding responses are shown in Table 2.
Experimental Matrix Table and Results of Determining Total Polyphenol Content (mg GAE/g DW) of CJR Extract.

Abbreviations: Abbreviations: DW, dry weight; GAE, gallic acid equivalent; TPC, total phenolics content.
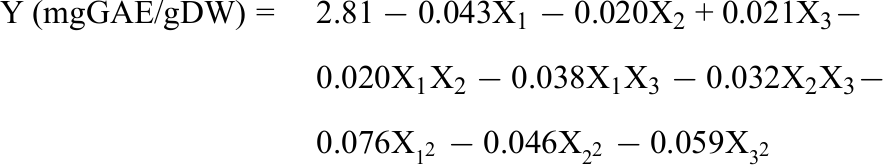
Experimentally, the obtained TPC ranged from 2.5 ± 0.056 to 2.8 ± 0.088 mg GAE/g DW. The current results indicated that all 3 extraction factors had a significant influence on the TPC. This is also consistent with the general trend of the process of extracting bioactive compounds from plant materials. Accordingly, extraction factors such as temperature, time, solvent/material ratio, and solvent concentration all affected the extraction of bioactive compounds from materials, including group polyphenols. 20 The estimated quadratic function produced by the Design-Expert software is as follows.
Analysis of variance test was performed to develop and evaluate the compatibility of the achieved model. The results are presented in Table 3. A model is considered statistically significant when: P > F value of the model <0.0001; adequate precision (AP) used to guide design spaces of greater than 4.0; Lack of fit (LOF) values reflecting the fragility of data must be statistically insignificant (P > 0.05) and high R 2 values (>0.8). 21 Considering the above criteria, the quadratic model in this study satisfied all four criteria with P < 0.0001; AP = 20.8; LOF = 0.05 and R 2 = 0.98. In addition, a number of other factors were also used to evaluate whether the model is fully compatible with experimental results based on prediction and actual value plots and charts. Accordingly, the data in Figure 13 have shown that the model had a good correlation when the focal points were in a straight line and the distribution of the experimental points was random.
Analysis of Variance Test for the Effects of Extraction Factors on the Target Function.

SD = 0.0213; R² =0.9778.

Experimental: predicted value graph (A) and random distribution of 20 experiments (B).
The influence of the 3 factors on polyphenol extraction efficiency is described by three 3-dimensional surface response graphs (Figure 14): the red region represents the highest TPC extraction efficiency, while the green area shows lower results. Each chart has an optimal region, which suggests that the surveyed variables interacted with each other and affected the overall polyphenol recovery efficiency. Increasing the value of ethanol concentration, solvent/material ratio, and extraction time would lead to an increase in the value of the target function. However, increasing the concentration beyond the optimal value was not beneficial, and this reduced the obtained TPC content. Previously, several studies on extraction of antioxidants from herbs have shown that temperature, time, and solvent/material ratio had a great influence on polyphenol content and antioxidant activity of extracts, in which each different material source required different temperature, time, and optimal solvent/extraction ratio. 22
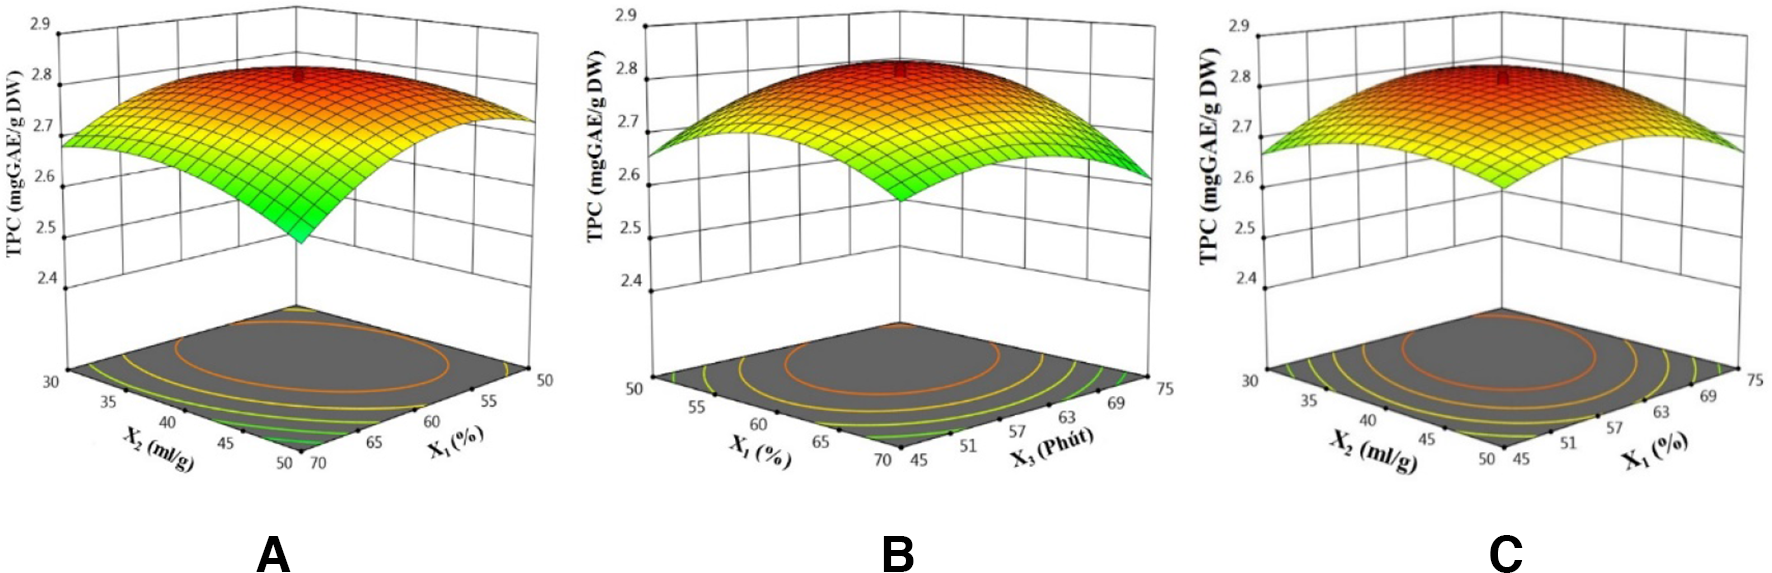
Chart of influence of factors (X1, X2, X3) on the objective function Y.
Optimization of the obtained function with respect to maximal TPC yielded the following optimal values: X 1 = 56.0 (%), X 2 = 38.0 (mL/g), and X 3 = 67.2 (min), corresponding with optimal TPC of 2.8 mg GAE/g DW. Confirmation experiments were carried out in triplicate using the above optimal conditions, resulting in polyphenol content of 2.9 ± 0.071 mg GAE/g DW, which was approximately 2.6% higher, as compared with the TPC predicted from the model.
Antioxidant Activity of CJR Extract
2,2-Diphenyl-1-picrylhydrazyl (DPPH) and ABTS free radical scavenging are the 2 most commonly used in vitro analyses for the evaluation of the antioxidant activity. 23 Many previous studies have also shown that there is a strong correlation between polyphenol content and antioxidant activity. 24 The antioxidant activity of CJR was assessed by 2 methods of reducing DPPH and ABTS free radicals. To compare the antioxidant activity of CJR extract with commercial antioxidants such as ascorbic acid and Trolox (a synthetic antioxidant similar to vitamin E, but capable of dissolving in oil and water), the half-maximal inhibitory concentration (IC50) value was calculated. IC50 is the concentration of antioxidants at which 50% free radical DPPH or ABTS are removed under experimental conditions. The used CJR extract sample was obtained with the following optimal conditions: material size ≤0.5 mm, extraction solvent ethanol 56.0%, extraction temperature 60 °C, extraction time 67.2 minutes, ratio of solvent/raw materials 1/38.0 g/mL, 1 cycle of extraction, and stirring speed of 300 rpm. The results are shown in Figure 15.
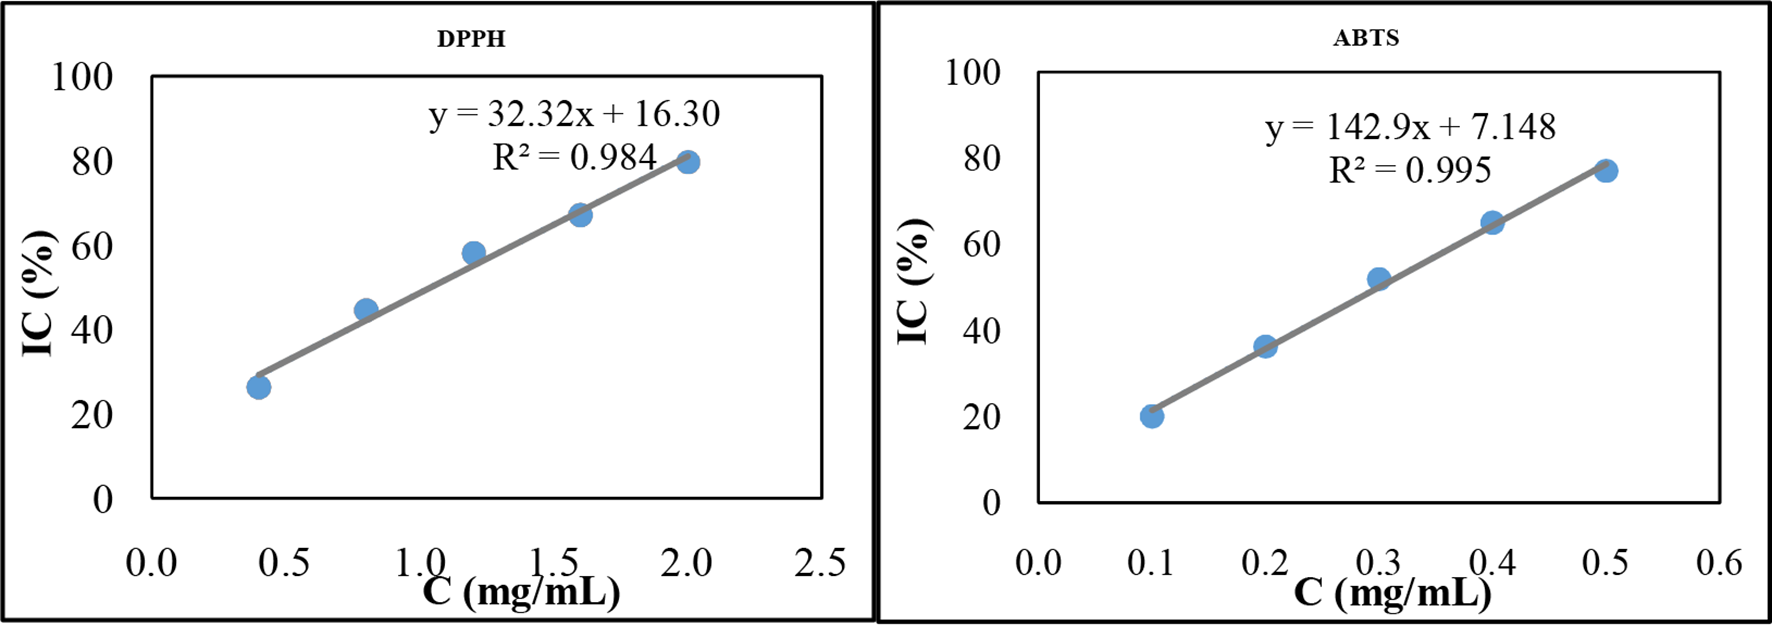
Antioxidant activity of Codonopsis javanica root extract on DPPH and ABTS models. ABTS, 2,2′-azino-bis(3-ethylbenzothiazoline-6-sulfonic acid; DPPH, 2,2-diphenyl-1-picrylhydrazyl; IC, inhibitory concentration.
The DPPH and ABTS free radical tests of the CJR extract gave IC50 values of 1042.3 and 299.0 µg/mL, respectively. Compared with antioxidant activities of vitamin C determined using DPPH (3.1 µg/mL) and ABTS free radical tests (2.5 µg/mL), the antioxidant activities of the CJR extract were 341 times and 119 times lower, respectively. A low IC50 value indicates the strong ability to capture free radicals and vice versa. The above results suggest that CJR extract possesses moderate antioxidant activities and would contribute to providing scientific data of the CJR in medicinal applications. 25
Conclusion
The present study has attempted to optimize the TPC, TFC, and antioxidant activities of CJR extract by performing a series of single-factor investigations, followed by RSM. A wide range of drying conditions and extraction parameters were taken into account. The following optimal conditions were obtained: material size of ≤0.5 mm, ethanol as solvent at a concentration of 56.0%, extraction temperature of 60 °C, extraction time of 67.2 minutes, ratio of solvent to raw materials 1/38.0 (g/mL), and a stirring speed of 300 rpm in 1 extraction cycle. The results of the antioxidant activity evaluation of CJR might potentially contribute to elucidate its applications to the treatment of diseases related to free radicals.
Materials and Methods
The Pretreatment Process of CJR
CJR, collected in Kontum Province, Vietnam, were carefully packed and transported on the same day, then processed according to the procedure in Figure 16.
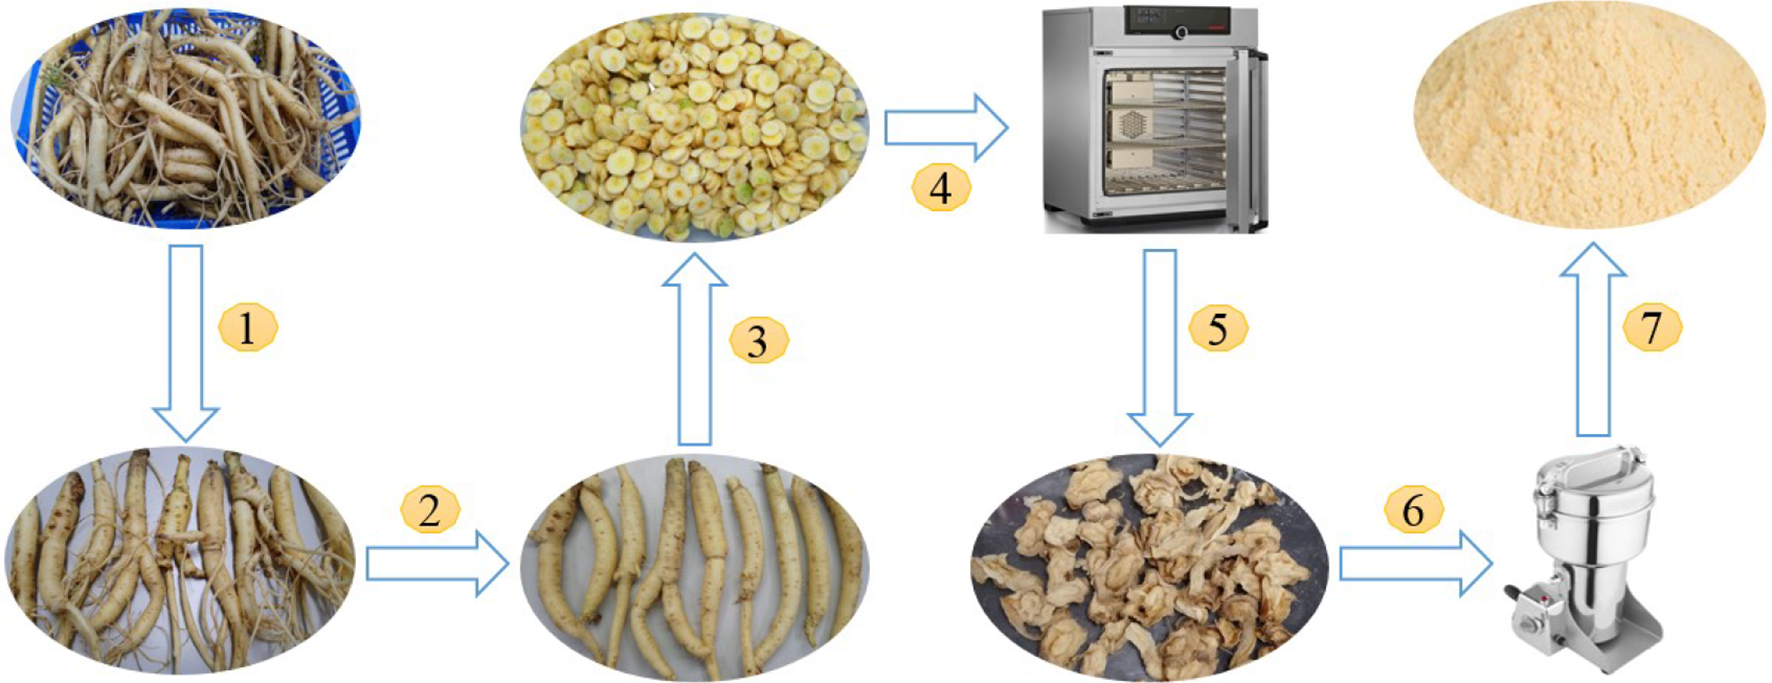
Preliminary processing of Codonopsis javanica root material before extraction.
First, CJRs were washed and allowed to dry. (1) Undamaged roots of uniform size were selected. (2) Then, rootlets, leftover stems, and nodules on the bulb were removed. (3) The trimmed roots were sliced into 1-3 cm thick slices, which were (4) subjected to drying in an appropriate dryer. (5-7) After being dried, the materials were broken down in a mechanical grinder to an appropriate size, stored in sealed plastic bags, and protected from exposure to light.
Drying of CJR
We conducted the drying step using 2 methods, (1) conduction drying (using Universal Oven UN110) and (2) convection drying (using CE JSOF-150 Forced Convection Oven) under allowable conditions. The moisture content of the samples after drying was assessed according to DDVN 5 (Appendix 12.16). TPC and moisture content were selected as outcomes in this investigation. The following extraction conditions were applied: extraction time of 30 minutes, extraction temperature 50 °C, concentration of ethanol 50%, single extraction, stirring speed of 300 rpm, material/solvent ratio of 1/20 g/mL, and material size of 1 mm.
Extraction Process of CJR
Solvent extraction was carried out under reflux to afford the dried CJR extract. First, 10 g of powdered roots was transferred into a round-bottom flask, followed by the addition of an appropriate solvent at an appropriate material/solvent ratio. The flask was connected to a glass condenser and heated by a heating mantle with a magnetic stirrer. After a certain time has elapsed, the obtained mixture was filtered to remove solid residue, and the filtrate was subjected to rotary evaporation at 50 °C and 120 rpm until the solvent had completely evaporated. The obtained dried extract was then stored in dark vials at 4 °C. The following extraction conditions were employed in the initial survey (effect of drying parameters): 50% ethanol solvent, extraction time of 30 minutes, 1/20 material/solvent ratio g/mL, temperature of 50 °C, and stirring speed of 300 rpm. Extraction runs were performed in triplicate to obtain the means and SDs.
Determination of TPC
TPC was determined by the Folin-Ciocalteu method based on the description of Singh. First, the sample solution was diluted to the appropriate concentration. Then, 0.5 mL of the diluted sample solution was taken and transferred into a test tube. Afterward, 2.5 mL of 10% Folin-Ciocalteu solution was added, and the mixture was homogenized using a vortex mixer. The solution was allowed to stand for 5 minutes, then 2 mL of 7.5% sodium carbonate solution was added and shaken well. The solution was then incubated at room temperature in the dark for 1 hour. The optical absorbance was measured at 765 nm using an ultraviolet-visible (UV-Vis) spectrophotometer. Gallic acid was used as the standard. The polyphenol content is expressed in mg GAE/g of extract. 26
Determination of TFC
TFC was determined following Singh. 27 First, the obtained extract was diluted to the appropriate concentration. Then 0.5 mL of the diluted sample solution was taken into a test tube, and 0.1 mL of 10% aluminum chloride solution was added. Following that, 0.1 mL of 1 M potassium acetate solution and 4.3 mL of distilled water were added to the solution, which was then shaken well and placed in the dark for 30 minutes. Finally, the optical absorption at 415 nm was measured using a UV-Vis spectrophotometer. Quercetin was used as a standard. The TFC is expressed as µg QE/g extract.
Optimization Using RSM
From the results of the initial surveys, 3 important factors were selected to carry out an RSM procedure taking TPC as the dependent variable. The selected experiment design was Central Composite Design, and the experimental matrix was built using Design-Expert 11.0 software. 28 -31
Antioxidant Activity of CJR Extract
Test for radical scavenging activity using the DPPH method
The extract was first diluted to a reasonable concentration. Then 0.5 mL of the diluted sample was taken into a test tube. The control sample was ethanol (99.5%). DPPH solution (1.5 mL; OD 517 nm = 1.1 ± 0.02) was added to the test tube, which was then allowed to stand in the dark for 30 minutes. Optical absorbance was measured at 517 nm on a UV-Vis spectrophotometer. Vitamin C (ascorbic acid) was used as the reference standard. 32
DPPH free radical scavenging activity (IC%) was determined by the following formula:

where AbsC is the optical absorbance of the control sample and AbsT is the optical absorbance of the sample.
The result is reported based on the IC50 value, which is the concentration at which the sample removes 50% of DPPH free radicals.
Radical scavenging activity using the ABTS method
The free radical solution ABTS was prepared by adding 10 mL of ABTS solution, 7.4 mM, into 10 mL of potassium persulfate solution, 2.6 mM, and incubating in the dark for 24 hours, then diluting with ethanol and adjusting the absorbance of the solution to 1.1 ± 0.02 at a wavelength of 734 nm. The extract was diluted to the appropriate concentration. Then, 0.5 mL of the diluted sample extract was taken into a test tube. The control sample was ethanol (99.5%). Afterward, 1.5 mL of ABTS solution (OD 517 nm = 1.1 ± 0.02) was added to a test tube, which was placed in the dark for 30 minutes. Optical absorbance was measured at 734 nm using a UV-Vis spectrophotometer. Vitamin C was used as the reference standard. 33 The scavenged ABTS content is expressed as mg AAE/g DW.
The free radical scavenging activity of ABTS (IC%) was determined by the following formula:

where AbsC is the optical absorbance of the control sample and AbsT is the optical absorbance of the sample.
The result is reported based on the IC50 value, which is the concentration at which the sample removes 50% of the ABTS free radicals.
Footnotes
Acknowledgments
We would like to thank Kon Tum Department of Science and Technology, Kon Tum Province, Vietnam, for the funding and Nguyen Tat Thanh University, Ho Chi Minh City, Vietnam, for providing us with the facilities required to perform this work. We are also grateful for the materials provided by Mr Le Van Thanh at Research, Application and Science and Technology Services Center in Kon Tum Province.
Declaration of Conflicting Interests
The author(s) declared no potential conflicts of interest with respect to the research, authorship, and/or publication of this article.
Funding
The author(s) received no financial support for the research, authorship, and/or publication of this article.