
Abstract
Introduction
The human skin is a complex organ that is the first line of defense to protect our body from external environmental damage.1,2 Due to direct contact with the environment, the skin often faces various challenges such as dryness, chapping, trauma, infection, UV damaged, oxidation, and so on.3,4 Therefore, the maintenance of skin health, the improvement and treatment of skin diseases are important development areas in the medical and beauty industry, which have important social significance and high economic value.5–7
Ginseng is a natural and non-toxic herb that is rich in a variety of active ingredients such as saponins, polysaccharides, amino acids, vitamins and trace elements. 8 Many studies have confirmed that lots of water-soluble ginseng extracts have good potential functions in skin care, including promoting skin fibroblast growth and collagen production, strong antioxidant effect, anti-free radical damage, removing melanin, increasing skin nutrition, improving skin radiance and vitality, etc9–18 In fact, the GS containing multiple ingredients can synergistically exert a variety of skin care effects, compared to the monomeric active substance extracted from ginseng.14–18 And the extraction process is simpler and the cost is much less. However, since the GS is composed of a variety of biological macromolecules, it is difficult for such active substances to penetrate into the skin through the skin barrier. Also, it is difficult for them to be absorbed in large quantities by the cells inside the skin. It makes the application of herbal ginseng extracts in the field of skin care a big hindrance. A study showed that ginseng could significantly reduced serum levels of reactive oxygen species (ROS) and methane dicarboxylic aldehyde (MDA). Simultaneously, it enhanced total glutathione content and boosted the activity of glutathione reductase (GSH-Rd). 16 Zhou et al found that the ginsenoside Rg1 effectively counteracts premature senescence in fibroblasts caused by 8-MOP combined with UVA exposure. 17 Both ginsenoside Rg1 and Rb1 have been demonstrated the capability to disrupt key pathways involved in accelerating aging. Notable protective effects of these ginsenosides have been observed in mitigating UV-induced growth inhibition and nucleolar damage in Hacat cells. 18
At present, effective drug delivery systems based on nanotechnology have been widely developed around the world, and many the related drugs have been successfully marketed.19–30 This is because the nanoparticles in the delivery system (such as liposomes, micro micelles, nanoparticles, and nanovesicles, etc) can easily penetrate into cells and be internalized in large quantities through their unique particle size and surface properties.21,22 Among them, the low biological-toxicity liposomes (LPs), original as the cell membrane model, have developed much into drug delivery systems in wide clinical applications.23–25 Liposomes can encapsulate both hydrophobic molecules and hydrophilic molecules to delivery multiple types of drugs. 26 Some studies have shown that the particle size and surface charge of the liposomes can be controlled by adjusting the preparation parameters. 27 It can improve the transport and penetration ability, and the bioavailability of the loaded drug in the liposomes toward skin.28,29 Therefore, in the fields of medicine and cosmetics, the low-toxicity liposomes have a wide range of application prospects. 30 However, up to now, there are few such studies. The application of nanoscale liposomes mostly stays in the field of medicine.
A hybrid hydrogel refers to a composite material formed by combining different types of polymer networks or integrating functional components such as nanoparticles, liposomes, or bioactive molecules. This combination aims to synergistically enhance the material's mechanical properties, functionality, and application potential.31–33 The development of new hybrid hydrogels with multiple functions such as moisturizing, antibacterial, and repair has attracted extensive attention in the field of skin health research. 34 Their unique internal porous structure and huge specific surface area can carry and precisely deliver a variety of active substances. Changing the composition and ratio can effectively adjust the hybrid hydrogels’ mechanical properties, moisturizing properties, antibacterial properties, control the release of loaded active substances, and so on.35,36 And the hydrogel dressing can provide a stable environment that is very conducive to skin maintenance and repair, and ultimately achieve the purpose of skin care and repair. 37 The design of biocompatible multifunctional hydrogel can meet a wide range of skin care needs and has great potential in the field of skin care.
Here, a novel multifunctional hybrid hydrogel (GS-LPs@Hy) encapsulating natural ginseng extract in liposomes has been prepared (Scheme 1). The active ingredient was extracted from natural herbal ginseng (GS) and then encapsulated in liposomes (GS-LPs). The optimal GS loading amount in the GS-LPs was determined by measuring the encapsulation efficiency (EE) and cell proliferation activity. Subsequently, the reaction concentrations of the main components of the hybrid hydrogel matrix (Hy) were optimized, including the polyvinyl alcohol (PVA), hyaluronic acid (HA), gelatin (Gel), and carboxymethyl chitosan (SCS) and the GS-LPs. The prepared GS-LPs@Hy exhibited significant proliferative effects on Hacat cells and HDF-α cells, high scavenging activity against DPPH, and effectively inhibited melanin production in B16F10 cells. Animal experiments using a UV-induced skin damage model also demonstrated that the GS-LPs@Hy has excellent repair and therapeutic effects on damaged skin.
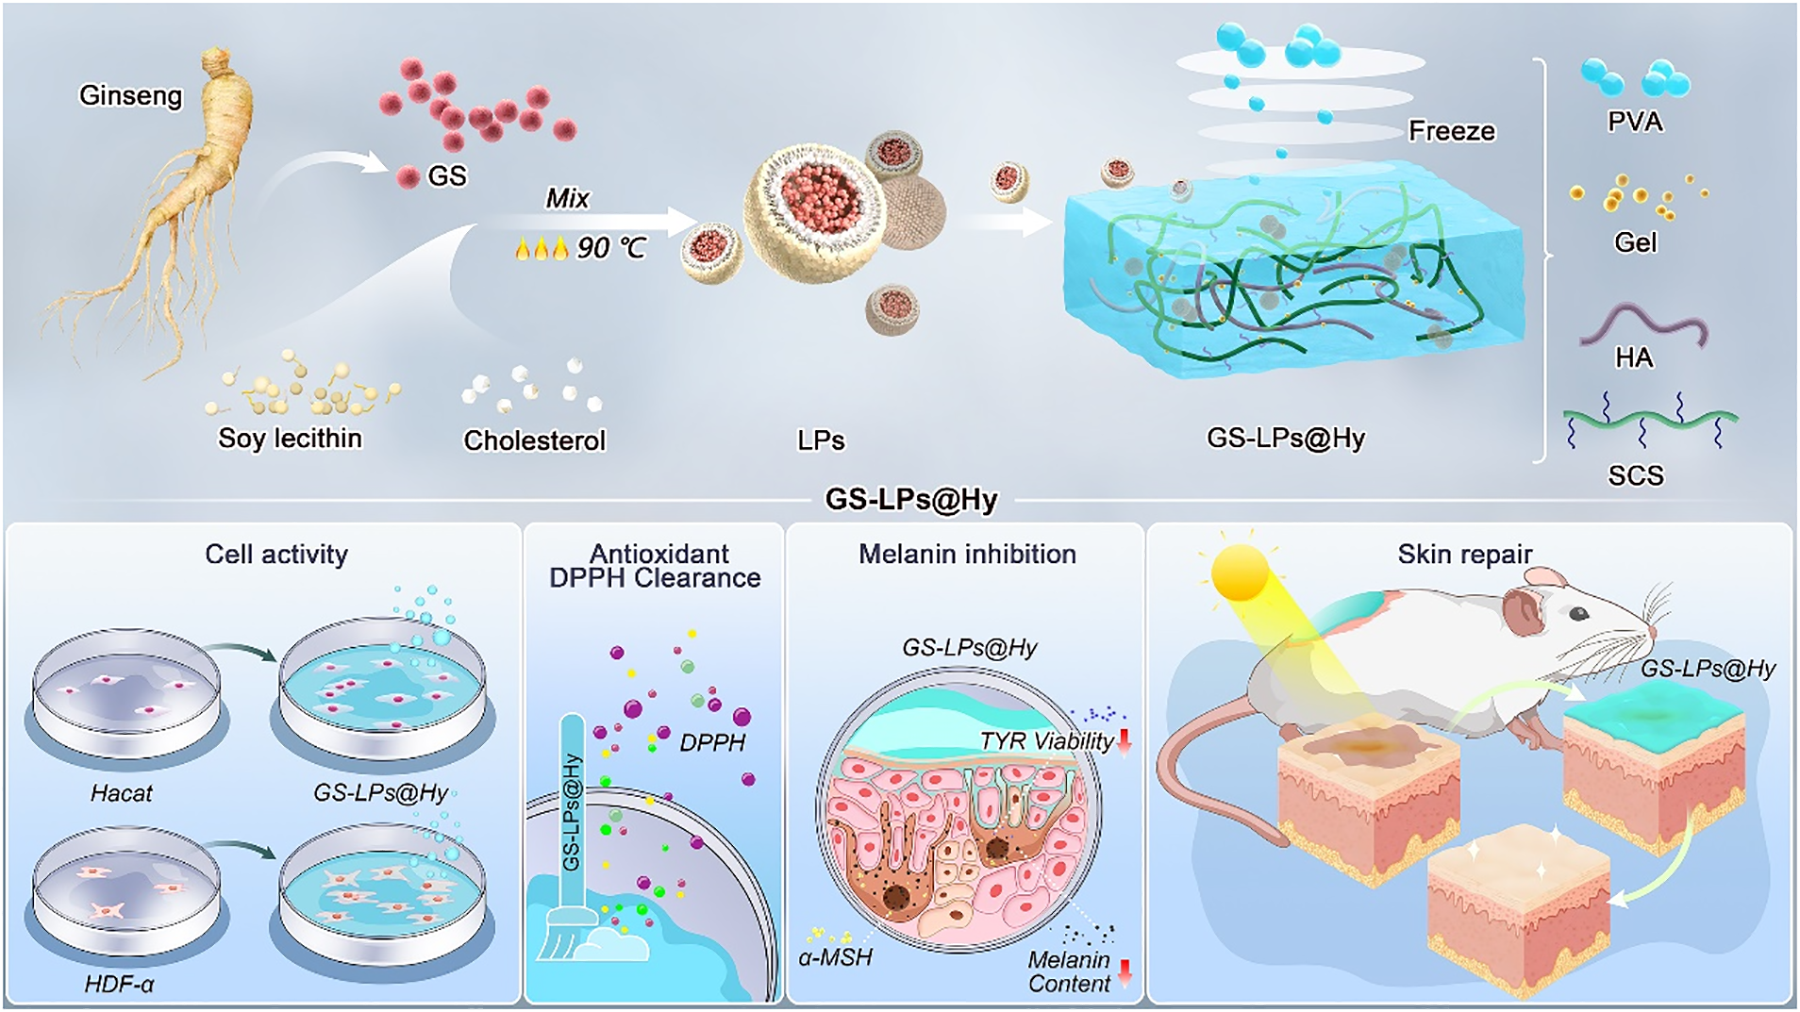
The Synthetic Process and Active Application of the GS-LPs@Hy.
Methods
Device and Materials
FDU-2110 freeze dryer (Shanghai airland instrument Co., Ltd), VECTOR33 FTIR spectrometer (Bruker), Infinite 200 Pro microplate reader (Tecan), WP-UP-JY-40 ultrapure water machine (Sichuan water treatment equipment Co., Ltd), ME104 electronic balance (Mettler Toledo), C-MAG HS7 temperature-controlled magnetic stirrer (IKA company), LC-20AT high-performance liquid chromatograph (Shimadzu company), Kendro CO2 constant temperature incubator (Thermo company), SW-CJ-2FD double single-sided purification bench (Suzhou purification equipment Co., Ltd), MiniSpin Plus ultra-high-speed centrifuge (Eppendorf company), YXQ-LS-75G autoclave (Shanghai boxun industrial Co., Ltd), CIC XSP-C204 inverted electron microscope (Leica company), Transmission electron microscopy (TEM) Tecnai GI F20 U-TWIN (Philips-FEI, Netherlands), Scanning Electron Microscope (SEM) Hitachi Regulus8100, (ZEISS, Germany).
Soy lecithin, cholesterol, polyvinyl alcohol (PVA), gelatin (Gel), carboxymethyl chitosan (SCS), hyaluronic acid (HA) and levodopa were purchased from Shanghai yuanye biotechnology Co., Ltd; Ginseng was purchased from Changchun yishengtang deer industry Co., Ltd; Methanol, acetonitrile and formic acid (chromatographically pure) were purchased from Fisher; Dulbecco's modified eagle medium (DMEM) medium, phosphate buffer solution (PBS), 0.3% trypsin(-)EDTA, fetal bovine serum and bispecific antibody solution were purchased from BI; DMSO for cells was purchased from Sigma; CCK-8 cytotoxicity kit was purchased from Wuhan boshide company; BCA protein concentration kit was purchased from Shanghai biyuntian biotechnology Co., Ld.
Extraction and Characterization of the GS
Ginseng of 3 years (purchased from Changchun yishengtang deer industry Co., Ltd) was clean and cut, and 20.0 g was ground into powder and added in 200 mL deionized water. The mixed solution was heated to 100 °C and stirred for 1.5 h. Added another 200 mL deionized water and repeated two times. 38 The mixture was let to room temperature and filtrated with gauze. The filtrate was heated for 30 min to concentrate. After filtration with filter paper, the concentrate was collected, and the GS lyophilized powder was obtained after lyophilization at −45 °C for 4 d by a freeze dryer.
Configured the mixed solvent (chloroform: ethyl acetate: methanol: water volume ratio = 15: 50: 30: 10) and set under 4 °C overnight. Then the lower layer solution was served as the developing agent for thin-layer chromatography (TLC) experiment. GS lyophilized powder of 0.1 g was placed in a 10 mL volumetric flask of methanol as the sample solution to be tested. The ginsenoside standards Rg1, Rg3, Rb1, and Re were added with methanol to prepare a 2.0 mg/mL control solution, respectively. Pipetted 2 μL of each solution and placed them on the same silica gel thin layer plate. The thin layer plate was set in the above developing agent, and then removed and dried. Sprayed with 10.0% sulfuric acid-ethanol solution on the thin layer plate and heated it at 105 °C until the spots on it were clear. Then the GS sample and standards were examined under UV light of 365 nm.
Determination Substances by High Performance Liquid Chromatography
The four ginsenoside standards Rg1, Rg3, Rb1, and Re were weighed and prepared into a mixed control solution with a concentration of 0.2 mg/mL. GS lyophilized powder of 30.0 mg was dissolved in 10 mL methanol as the sample solution to be measured. HPLC test: the column was AlltimaTM C18 column (250 × 4.6 mm, 5 μm), the detection wavelength was 203 nm, the flow rate was 1 mL/min, the injection volume was 10 μL, and the column temperature was 25 °C. Phosphoric acid aqueous solution with a concentration of 0.1% was used as mobile phase A and acetonitrile was used as mobile phase B. The gradient elution was 0 ∼ 30 min, 19.0% A and 81% B; 30 ∼ 35 min, 19.0 ∼ 24.0% A and 81 ∼ 76% B; 35 ∼ 60 min, and 24.0 ∼ 40.0% A and 76 ∼ 60% B.
The EE of the GS-LPs below was determined by the similar method.
Preparation of the LPs
According to the traditional liposome synthesis method,39,40 soybean lecithin of 3.0 g and cholesterol of 0.4 g were added to 12 mL ethanol. The mixture was stirred at room temperature until the solid was completely dissolved. Then the temperature was raised to 90 °C. After 20 min, the pure LPs was obtained after the ethanol was completely volatilized.
Preparation of the GS-LPs
Take the preparation of GS12.5%-LPs as an example.
Soybean lecithin of 3.0 g and cholesterol of 0.4 g were added into 12 mL ethanol and stirred at room temperature for 30 min, as the ethanol phase. GS of 0.4 g was added into 5 mL deionized water, and stirred at 55 °C until completely dissolved, as the aqueous phase. The ethanol phase was quickly injected into the aqueous phase. Then the mixture was raised to 90 °C, and was stirring for 30 min until the ethanol was completely volatilized. The brownish-yellow GS12.5%-LPs sample was obtained and stored at 4 °C.
The preparation procedure of GS20.0%-LPs, GS16.7%-LPs, GS10.0%-LPs, and GS8.3%-LPs was almost the same, but with different mass ratio of GS.
Determination of the Optimal Encapsulation Efficiency of the GS-LPs
GS-LPs aqueous solution of 2 mL at a concentration of 10 mg/mL was added to a volumetric flask, and methanol was added to bring the volume to 10 mL. The HPLC test method above was used to determine the GS content of it as the total dose (W1) in LPs. GS-LPs aqueous solution of 2 mL at a concentration of 10 mg/mL was placed in an ultrafiltration centrifuge tube (MW 10000 Da) and centrifuged at 4000 rpm for 30 min. Collected the lower liquid in the centrifuge tube, added it into the other volumetric flask, and added methanol to bring the volume to 10 mL. The HPLC test method above was used to determine the GS content of it as the unencapsulated free dose (W2) in LPs.
Calculated the EE of the GS-LPs by the formula below:

W1, the total GS contentW2, the unencapsulated free GS content
Effect of GS, LPs, and LPs Containing Different Content of GS on Cell Proliferation
The Hacat cells were cultured in an incubator (37 °C, 5% CO2) to logarithmic growth phase and seeded into 96-well plate (cell density: 4.0 × 10³ cells/well). Incubated for 12 h to allow the cells to attach the 96-well plate. Discarded the cell culture medium and added 200 μL of complete medium containing different concentrations of GS (0, 50, 100, 150, and 200 μg/mL) per well. Cultured the cells for 48 h and discarded the cell culture medium. The cell counting Kit-8 (CCK-8) method was used to determine the cell proliferation activity: Added 100 μL of complete medium containing 10.0% cell CCK-8 to each well, and incubated in the incubator for 40 min. Then measured the absorbance per well the at 450 nm with a microplate reader.
The effects of LPs, GS20.0%-LPs, GS16.7%-LPs, GS12.5%-LPs, GS10.0%-LPs, and GS8.3%-LPs on the proliferation of the Hacat cells were determined by the same method.
The effects of GS, LPs, GS20.0%-LPs, GS16.7%-LPs, GS12.5%-LPs, GS10.0%-LPs, and GS8.3%-LPs on the proliferation of the HDF-α cells were determined by the same method.
TEM Test of the GS-LPs
Dropped 20 μL GS-LPs aqueous solution at a concentration of 1 mg/mL on an ultra-thin carbon film. Dropwise added phosphotungstic acid negative staining solution (2.0%, pH = 7.0) on the carbon film and set it dry. The morphology was then observed and photographed by a TEM.
Simulated Release Assay of the GS in GS-LPs and GS-LPs@Hy in vitro
GS-LPs of 0.5 g was diluted with PBS to 5 mL and transferred into a dialysis bag. The dialysis bag was placed in a beaker containing 800 mL of PBS buffer (pH of 5.5), under stirring at 37 °C.41,42 Absorbed 2 mL of the release solution outside the dialysis bag at 0.5, 1, 2, 4, 8, 12, 24, and 48 h. Added 2 mL of PBS buffer at the same time. Each solution outside was filtered with a 0.22 μm microporous membrane. The content of GS was then detected by the UV-Vis at 203 nm.
The same method was used to determine the simulated release of the GS from the GS-LPs@Hy in vitro.
Antioxidant Activity Assay of the GS-LPs and the GS-LPs@Hy
The scavenging activity of the GS-LPs against free radicals was determined using the 2,2-diphenyl-1-pyridylhydrazine (DPPH). 43 DPPH powder of 3.9 mg was dissolved in absolute ethanol and prepared into a 1.00 mM DPPH stock solution. DPPH stock solution (400 μL), distilled water (400 μL), and absolute ethanol (800 μL) were mixed and sonicated into a 0.25 mM DPPH working solution. Aqueous solutions of GS-LPs at different concentrations (10, 20, 30, 40, and 50 mg/mL) were configured. In a 96-well plate, 100 μL of GS-LPs solution of different concentrations and 100 μL of DPPH working solution were added as the experimental group A1. Different concentrations of GS-LPs (100 μL) and 75% ethanol (100 μL) were added as the control group A2. Added 100 μL of DPPH working solution and 100 μL of 75.0% ethanol as a negative control group A3. The absorbance of each group at 510 nm was detected at room temperature after 30 min in dark.
Calculated the DPPH clearance of different concentrations of the GS-LPs:

The same method was used to determine the clearance of DPPH by the GS-LPs@Hy.
Detection of the Melanin Content and TYR Viability of the B16F10 Cells After GS-LPs@Hy Administration
Introduced 0.5 g GS-LPs@Hy in a beaker and added 5 mL of deionized water. After soaking for 24 h, the release solution of GS-LPs@Hy active substance was obtained, and the concentration of the release solution was calculated.
Extracted the total protein of the B16F10 cells. B16F10 cells in logarithmic growth phase were seeded in 6-well plates at a cell density of 8.0 × 10⁴ cells/mL. After 24 h of incubation, each 1 mL of GS-LPs@Hy release solution (0, 50, 100, 150, and 200 μg/mL) was added. Removed the cell medium and replaced with cell medium containing α-MSH (0.3 μM), and cocultured for 48 h. Removed the cell medium and rinsed twice with PBS. Cells were collected after trypsinization. Added 50 μL of cell lysate and lysed at 4 °C for 1 h. After centrifugation at 12000 rpm for 20 min, 5 group of the upper lysate and the lower cell precipitation were then collected. The protein concentration in the lysate was detected by BCA.
Dopa oxidation method was used to detect the TYR activity of the B16F10 cells. The above 5 groups of cell protein lysates of 80.0 μg total protein and 80 μL of 5.00 mM levodopa were added to 96-well plates. Supplemented with PBS buffer to 200 μL in each well. Incubate at 37 °C for 30 min. The absorbance value at 492 nm was detected with a microplate reader and the TYR activity of B16F10 cells was then calculated.
Alkaline lysis method was used to detect the melanin content in the B16F10 cells. NaOH (containing 10.0% DMSO) of 50 μL at a concentration of 1.00 mol/L was added to each of the above 5 groups of cell precipitation. Heated in a water bath at 80 °C for 1 h. The absorbance value at 405 nm was detected by a microplate reader. The melanin content of the B16F10 cells was then calculated.
Stability Tests of the GS-LPs
pH Stability Test
GS-LPs solution (10.0 wt%) was mixed with equal volumes of PBS buffer of different pH (1, 2, 3, 4, 5, 6, 7, 8, 9, 10, 11, 12, 13, and 14), respectively. After 30 min, 200 μL of each GS-LPs solution was added to the 96-well plate. The absorbance of the solution per well was determined by a microplate reader at 450 nm. According to the formula A = -lgT (A is absorbance and T is transmittance), the transmittance of each GS-LPs solution under different pH condition was calculated, which was then used to evaluate the pH stability of the GS-LPs.
Temperature Stability Test
Took 13 of the same 10 mL solution of the GS-LPs (10.0 wt%). One sample was randomly selected and placed at room temperature as the control. Six samples were randomly placed in an electrically heated incubator at 40 °C, and the remaining six samples were placed in a refrigerator at −20 °C. One sample was taken out at 2, 4, 6, 8, 12, and 24 h. Compared with the control sample, observed each sample for thinning, discoloration, delamination and turbidity. The absorbance of each sample was then determined with a microplate reader at 450 nm. According to the formula A = -lgT (A is absorbance and T is transmittance), the transmittance of each GS-LPs solution under different temperature was calculated, which was then used to evaluate the temperature stability of the GS-LPs. 44
Stability of the GS-LPs solution (10 wt%) under 90 °C from 0 to 30 min was also performed as above method.
Time Stability Test
Sealed GS-LPs solutions (20 mL) with different mass fractions (∼ 10.0-0.5 wt%) were stored at room temperature for 1–180 d. Observed each sample for thinning, discoloration, delamination and turbidity at the 1, 3, 7, 14, 30, 90, and 180th. According to the formula A = -lgT (A is absorbance and T is transmittance), the transmittance of each GS-LPs solution under different time was calculated, which was then used to evaluate the time stability of the GS-LPs. 44
The Preparation of the GS-LPs@Hy
PVA (∼ 1.0-3.5 wt%), Gel (∼ 0.2-1.0 wt%), HA (∼ 1.0-2.0 wt%), SCS (∼ 0.1-0.2 wt%), and GS-LPs (∼5.0-15.0 wt%) were placed in a beaker, and 5 mL of deionized water was added. The beaker was heating at 90 °C and stirring for 30 min, until the solid completely dissolved and became sol. It was removed and placed in a grinding tool and frozen at −20 °C for ∼ 6–24 h to prepare the GS-LPs@Hy.
Screening of the HA Concentration
Under fixed conditions (PVA ∼ 2.5 wt%, Gel ∼ 0.5 wt%, and SCS ∼ 0.2 wt%), different Hy with different mass fractions of HA (∼ 1.0-2.0 wt%) was prepared. The prepared Hy was weighed and recorded at 0, 1, 2, 3, 4, 5, 6, 7, and 24 h at room temperature. Calculated the moisture retention rate of the different Hy, according to the formula: moisture retention rate (%) = m0 – m / m0 (m0 is the Hy mass at 0 h, m is the Hy mass at other time).
Screening of the SCS Concentration
Under fixed conditions (PVA ∼ 2.5 wt%, HA ∼ 1.4 wt%, and Gel ∼ 0.5 wt%), different Hy with different mass fractions of SCS (0, 0.1, 0.15, and 0.2 wt%) were prepared. S. aureus (ATCC25923) was transferred from LB solid medium to LB liquid medium in an erlenmeyer flask. Set the erlenmeyer flask under a shaker (37 °C, 200 rpm) for 8 h to reach logarithmic growth stage of S. aureus. Fully coated the LB solid culture medium in petri dishes with S. aureus. Different Hy with a diameter of 0.5 cm and pure SCS aqueous solution (2 mg/ mL) were placed in the middle of the S. aureus coated LB solid medium and incubated in a 37 °C incubator. After 24 h, photographs were taken and the size of the inhibition zone in the middle of LB solid medium was measured.
The Effects of Different GS-LPs@Hy on the Proliferation of the Hacat Cells and HDF-α Cells
Soaked 1.0 g of the GS-LPs(5%)@Hy, GS-LPs(10%)@Hy, and GS-LPs(15%)@Hy in 5 mL of sterile water for 24 h. The hydrogels were removed, the concentration of each immersion solution was determined and diluted with sterile water to different concentrations (50, 100, 150, and 200 μg/mL). The Hacat cells were cultured in an incubator (37 °C, 5.0% CO2) to logarithmic growth phase and seeded into 96-well plate (cell density: 4.0 × 10³ cells/well). Incubated for 12 h to allow the cells to attach the 96-well plate. Discarded the cell culture medium and added 200 μL of complete medium containing different concentrations of soaking substance (0, 50, 100, 150, and 200 μg/mL) per well. Cultured the cells for 48 h and discarded the cell culture medium. The CCK8 method was used to determine the cell proliferation activity: Added 100 μL of complete medium containing 10.0% CCK-8 to each well, and incubated in the incubator for 40 min. Then measured the absorbance per well the at 450 nm with a microplate reader.
The effects of GS-LPs(5%)@Hy, GS-LPs(10%)@Hy, and GS-LPs(15%)@Hy on the proliferation of the HDF-α cells were determined by the same method.
SEM Test of the GS-LPs@Hy
Prepared the Hy according to optimal synthesis condition (PVA ∼ 2.5 wt%, Gel ∼ 0.4 wt%, HA ∼ 1.4 wt%, and SCS ∼ 0.2 wt%) and the GS-LPs@Hy according to optimal synthesis condition (PVA ∼ 2.5 wt%, Gel ∼ 0.4 wt%, HA ∼ 1.4 wt%, SCS ∼ 0.2 wt%, and GS-LPs ∼ 10.0 wt%), respectively. Lyophilized the hydrogels at −45 °C for 4 days by a freeze dryer, and then detected them with a SEM.
Effect of the GS-LPs@Hy on the Repair of UV Damaged Skin in Mice
Selected 15 of KM female mice with an average body weight of 30.0 ± 2.0 g and treated them with a blade to remove their back hair. During the experiment, all the mice were depilated every 2 d. The mice were randomly divided into 5 groups (n = 3): the Control group, the Model group, the Low dose group, the Middle dose group and the High dose group. Mice in the Control group were not treated except for hair removal. The backs of the mice in the other groups were irradiated under UV light (365 nm) for 30 min/d and continuously irradiated for 7 d. The mice in Model group were not given any dressing treatment during the 7 d. The mice in the Low dose group, Middle dose group and High dose group were treated with GS-LPs(5%)@Hy, GS-LPs(10%)@Hy, and GS-LPs(15%)@Hy dressings for 6 h/d, respectively, and photographed and recorded. After 7 d of repair treatment, the dorsal skin of the mice in all the groups was taken and fixed in 4.0% paraformaldehyde for 7 d. Finally, sections were made for H&E and Masson staining analysis.
Statistical Analysis
Statistical data were expressed as means + standard deviation(S.D). Statistical analysis was performed using GraphPad Prism10.0 software. T-test and one-way ANOVA were used to analyze the differences between data. For all experimental data (n > 3),p < 0.05 were considered statistically significant.
Results
Preparation and Characterization and Bioactivity Analysis of the GS-LPs
First, water-soluble active ingredients such as GS of ginseng with multifunction were extracted. As ginsenosides Rg1, Rg3, Rb1, and Re are widely reported active ingredients to be most commonly used in skin care, they were selected to test the GS extracted from ginseng here (Figure 1).14,15 Used a mixed solvent system (chloroform, ethyl acetate, methanol, and water) for separation and visualization. Spots corresponding to the standard compounds ginsenosides Rg1, Rg3, Rb1, and Re could be observed on the TLC plate under both daylight and UV light at 365 nm (Figure 1a and S1). The GS showed spots at the same positions with the same color, indicating the presence of these above ginsenosides. The results showed the richness and diversity of bioactive compounds including ginsenosides Rg1, Rg3, Rb1, Re, and others, within the GS.

(A) TLC Development of the GS and Standards Rg1, Rg3, Rb1, and Re Under UV Lamps of 365 nm; (B) FTIR Spectra of the GS and Standards Rg1, Rg3, Rb1, and Re; (c) HPLC of the Mixed Standards Rg1, Rg3, Rb1, Re (Annotated as Mixed Labeling), and GS.
The FTIR test displayed that the GS have similar basic characteristic absorption peaks to the ginsenosides Rg1, Rg3, Rb1, and Re standards (Figure 1b). In the FTIR spectrum, the basic characteristic absorption peak O-H stretching, C-H stretching, C = C stretching, and C-O stretching is displayed at 3411 cm−1, 2878 cm−1, 1650 cm−1, and 1027 cm−1, respectively. High performance liquid chromatography (HPLC) was used to detect the content of the main ginsenosides in GS. Mixed 2 mg/mL of Rg1, Rg3, Rb1, and Re evenly to be the standard sample (annotated as Mixed Standards). The retention times of the 4 peaks in the GS feature map were similar to the corresponding reference peaks of the standard sample (Figure 1c and Table S1). Via peak area calculation, the content of Rg1, Rg3, Rb1, and Re in the GS was 21.5%, 27.5%, 39.5%, and 0.5%, respectively.
In order to improve the bioaccumulation and cellular absorption of the GS, a series of GS-LPs under the fixed mass reaction ratio (9:1 of soy lecithin and cholesterol), 45 with different reaction mass ratios of GS (20.0%, 16.7%, 12.5%, 10.0%, and 8.3%) had be prepared. The corresponding obtained GS-LPs were labeled as GS20.0%-LPs, GS16.7%-LPs, GS12.5%-LPs, GS10.0%-LPs, and GS8.3%-LPs, respectively. By HPLC testing, the calculated encapsulation rates of the GS in LPs of the GS20.0%-LPs, GS16.7%-LPs, GS12.5%-LPs, GS10.0%-LPs, and GS8.3%-LPs, were 64.5%, 71.9%, 80.1%, 84.1%, and 86.7%, respectively (Figure S2). When the reaction mass ratio of GS was the highest at 20.0%, the EE was the lowest. It is because a certain number of liposomes has a limited load on the active substance. Too much active substance involved in the reaction will only cause unnecessary loss and increase cost. With the decrease of the proportion of the GS, the EE showed an upward trend. When the reaction mass ratio of GS was reduced to 8.3%, the EE was the highest. However, at this time, the overall content of active substances in GS-LPs was the lowest. When the reaction mass ratio of GS was 12.5%, GS-LPs showed the optimal GS EE and loaded content.
Then the proliferation of Hacat cells and HDF-α cells was detected by CCK8 assay, after incubation with GS, LPs, GS20.0%-LPs, GS16.7%-LPs, GS12.5%-LPs, GS10.0%-LPs, and GS8.3%-LPs under the same condition (Figure 2 and S3). Compared with the control group (GS 0 μg/mL, LPs 0 μg/mL), the GS and the LPs exhibited limited proliferative effects on the Hacat cells and the HDF-α cells, respectively (Figure S3). While compared with the control group (GS-LPs 0 μg/mL), the GS-LPs had a more obvious effect on the cell proliferation. With the increase of the dosing concentration, the cell viability of each group showed an upward trend. For the GS20.0%-LPs and the GS16.7%-LPs, their proliferation effect on Hacat cells and HDF-α cells was not high, due to the low EE of the GS in the GS-LPs. With the increase of GS encapsulation rate (GS10.0%-LPs and GS8.3%-LPs), the viability and proliferation of the Hacat cells and HDF-α cells were more obvious. When the mass fraction of GS was 12.5%, the proliferative activity of the two cells was the highest. Therefore, the GS12.5%-LPs (labeled as GS-LPs below) were selected to be prepared and their characteristics were further investigated (Figure 3).
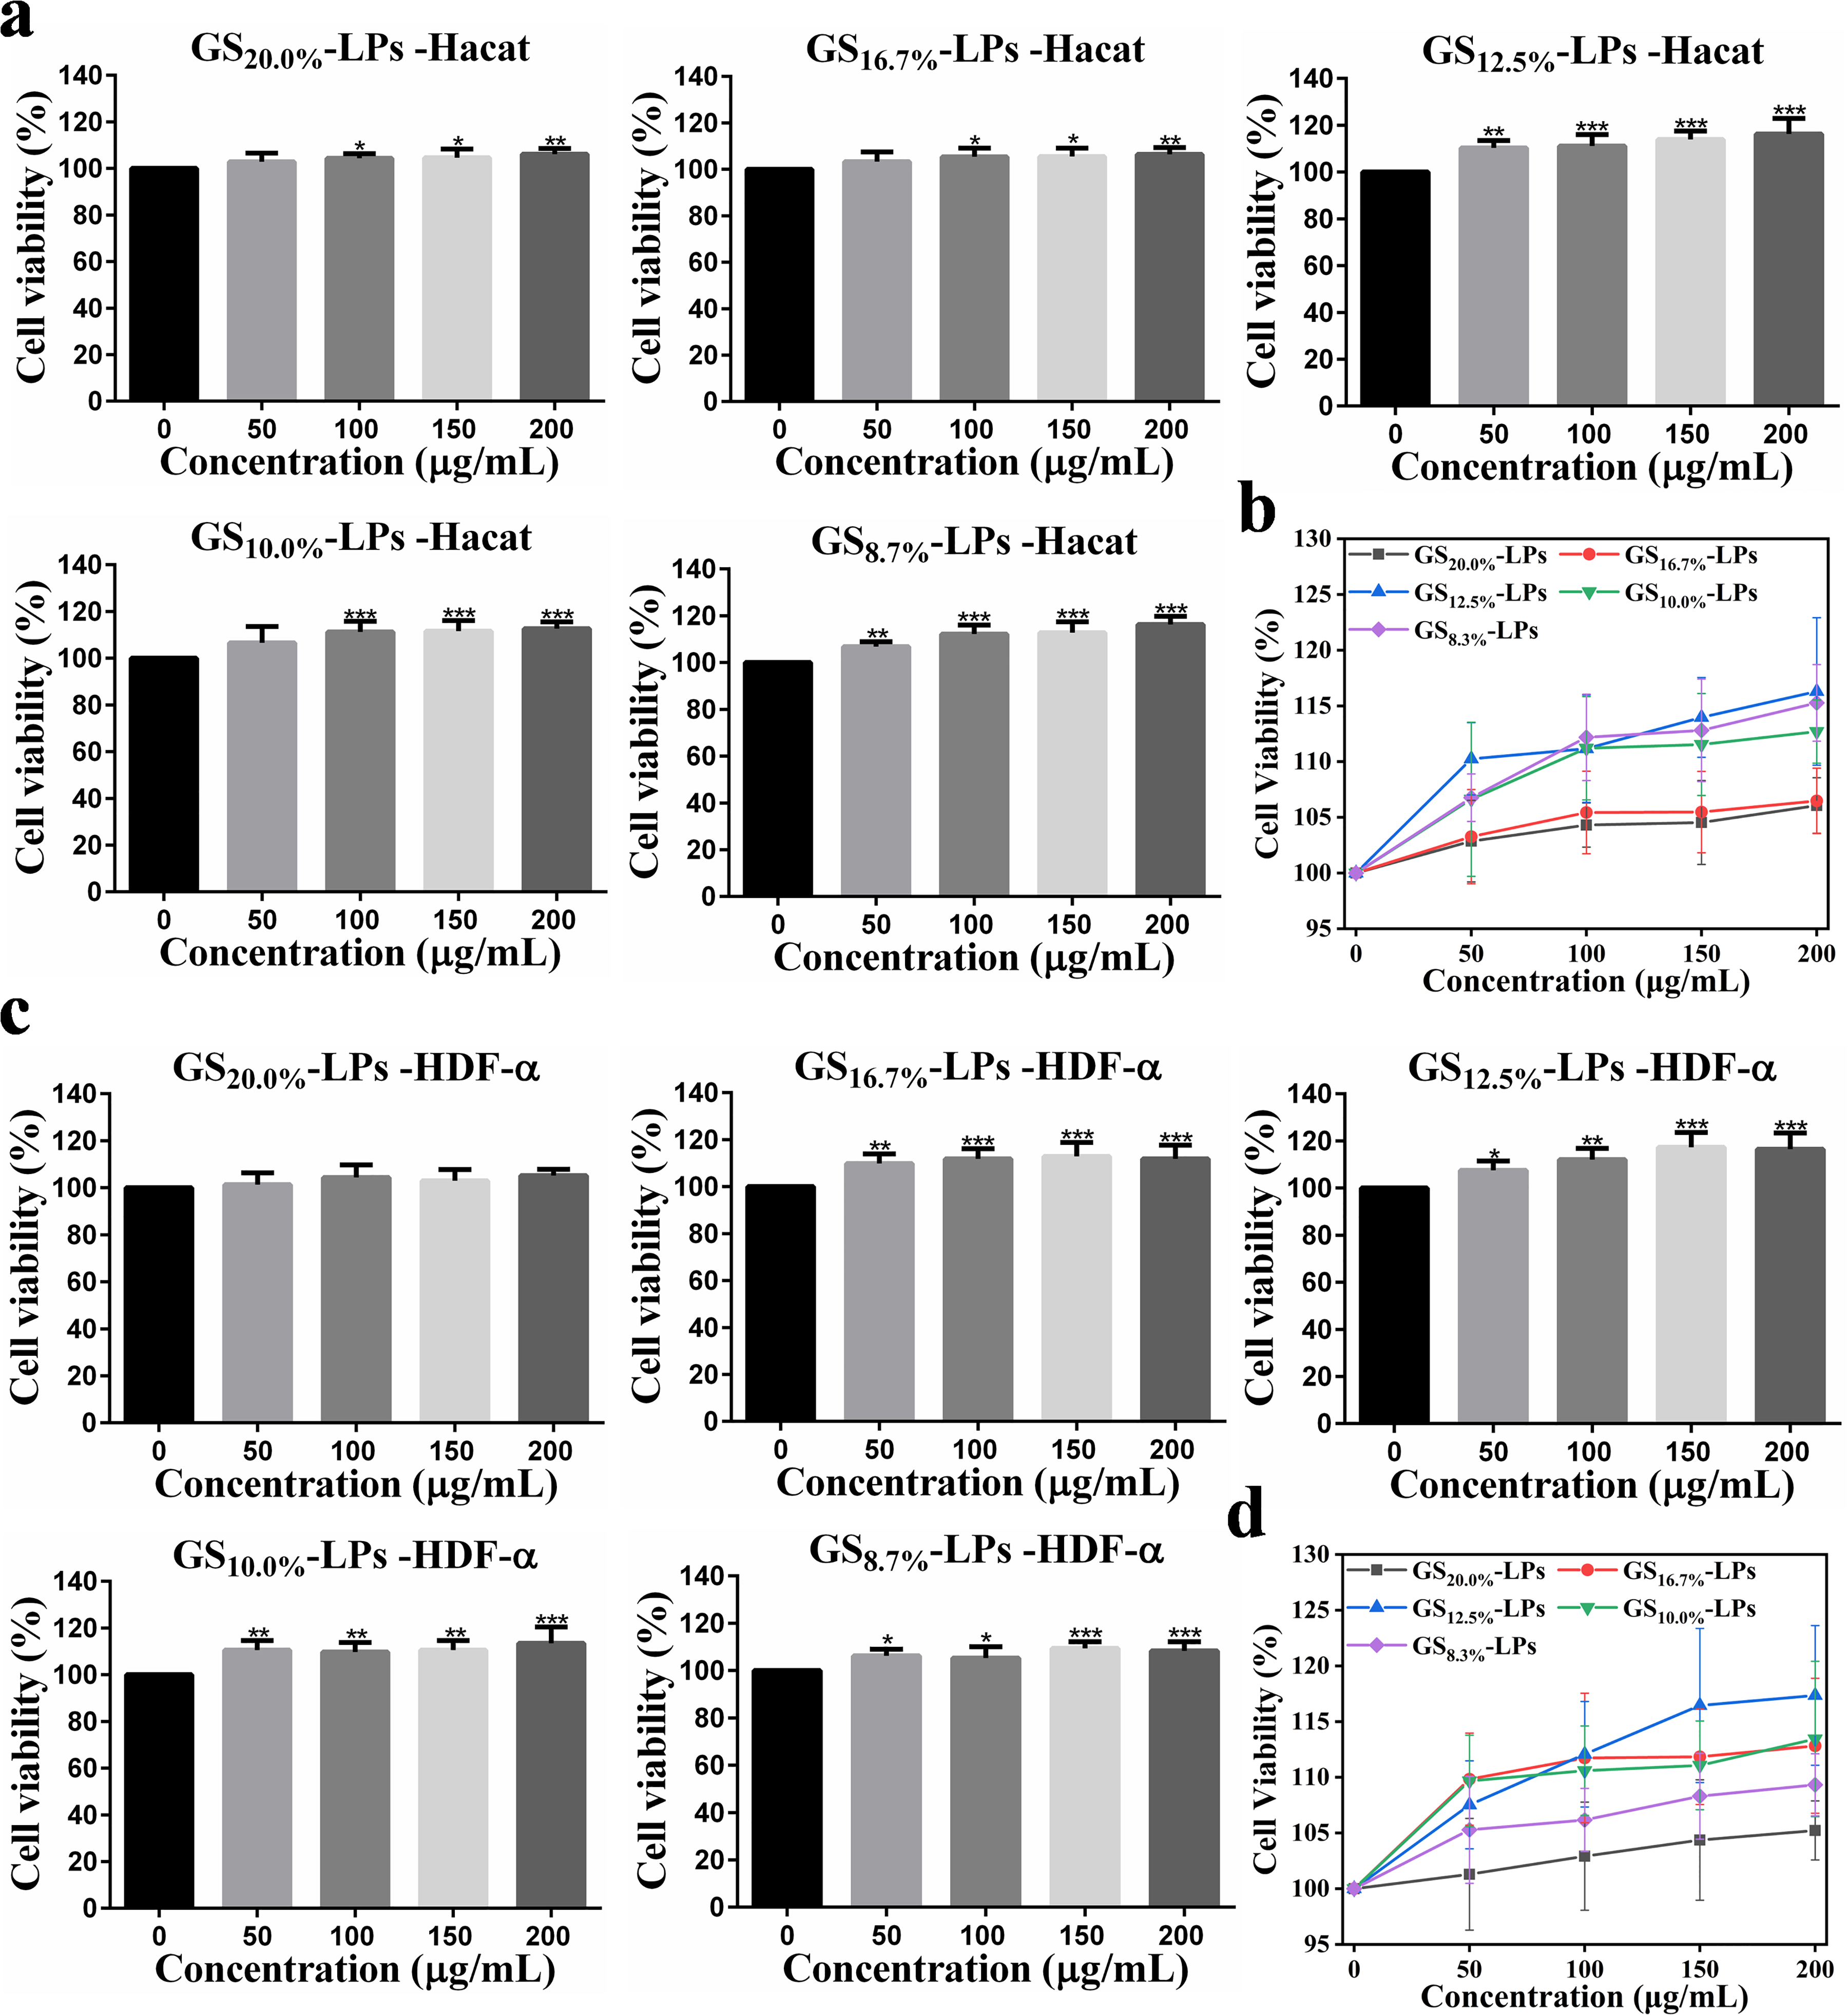
Diagram of the Proliferation Activity of the Hacat Cells (A) and the HDF-α Cells (C) after incubation with the GS20.0%-LPs, GS16.7%-LPs, GS12.5%-LPs, GS10.0%-LPs, and GS8.3%-LPs, Respectively; Statistical Chart Summarizing the in vitro Proliferation Activity of the Different GS-LPs on the Hacat Cells (B) and the HDF-α Cells (d). Data Were Mean ± sd (n = 6). p** < 0.01 and p*** < 0.001 Relative to 0 µg/mL, as Analyzed by One-Way ANOVA.

(A) The TEM Image of the GS-LPs; (B) The DLS Size Chart of the GS-LPs; (C) The Zeta Potential Chart of the GS-LPs; (D) The FTIR Spectra of the GS-LPs, LPs, and GS; (E) In vitro Release Curve of the GS in the GS-LPs at 0 - 72 h; (F) Calculation Diagram of DPPH Clearance Rate by the GS-LPs; (G) Calculation Diagram of the Effect of Different Concentrations of the GS-LPs on the Melanin Content and TYR Activity of the B16F10 Cells; (H) Diagram of the Cell Viability of the B16F10 Cells After Incubation with the GS-LPs of Different Concentrations. Data were Mean ± sd (n = 3). p**** < 0.0001 Relative to M, As Analyzed by One-Way ANOVA.
The TEM image showed that the particle size of the prepared GS-LPs concentrated at 177.3 ± 10.4 nm (Figure 3a and Figure S4). The DLS measurement showed that the hydrate diameter of the GS-LPs concentrated around 187.7 nm (Figure 3b), and the zeta potential of that was −24.6 ± 0.3 mV (Figure 3c). FTIR was used to detect the structures of the GS-LPs, LPs, and GS (Figure 3d). It showed that the GS-LPs contained the characteristic absorption peaks of both the LPs and the GS: the basic characteristic absorption peak of the O-H in-plane bending vibration at 3425 cm−1, the C-H stretching vibration at 2864 cm−1, the C = O stretching vibration at 1685 cm−1, the C = C stretching vibration at 1652 cm−1, and the C-O stretching vibration at 1018 cm−1. The in vitro simulated release of the GS from the GS-LPs in PBS was detected by UV-Vis at 203 nm (Figure 3e). Within 0–12 h, the GS-LPs quickly released large amounts of the GS. At 24 h, GS release was ∼ 51.4% of the GS-LPs. By 72 h, the GS was still being released slowly. The scavenging ability of the GS-LPs to scavenge DPPH was detected (Figure 3f). GS-LPs in the concentration range of 10–50 mg/mL had good scavenging ability to DPPH. When the concentration of the GS-LPs was 50 mg/mL, the clearance rate of DPPH was as high as ∼ 44.3%.
The effect of the GS-LPs on the melanin content and tyrosinase (TYR) activity in the mouse melanoma (B16F10) cells was also examined, to evaluated their whitening activity (Figure 3g). The B16F10 cells cultured in normal medium were used as the control group (labeled C in the figure). The other groups were treated with melanocyte-stimulating hormone (α-MSH, 0.3 μM) medium to stimulate melanin production in the B16F10 cells under the same condition. And the model group (marked M in the figure) and different concentrations GS-LPs (50, 100, 150, and 200 μg/mL) administration groups were established. Compared with the model group, the intracellular melanin content and TYR activity of the B16F10 cells were significantly decreased after treatment with different concentrations of GS-LPs. The GS-LPs had little cytotoxicity to the B16F10 cells (Figure 3h). This indicates that the GS-LPs do not reduce melanin production by inhibiting cell viability but rather by interfering with the activity of key enzymes (TYR) involved in the melanin synthesis process. The results showed that the GS-LPs had good antioxidant and anti-melanin production properties.
Stability Test of the GS-LPs
Considering the possibility as a skin care product, the stability of the prepared GS-LPs emulsion (10.0 wt%) under various conditions was evaluated (Figure 4). First, the pH of the GS-LPs was ∼ 6.0, which was within the pH range specified in the safety and technical specifications for cosmetics (pH = 4.5-8.5). 44 The GS-LPs emulsion state and light transmittance didn’t change much in the large pH range (∼ 1-14), indicating that the GS-LPs had high stability under acidic or alkaline conditions (Figure 4a). Also, the GS-LPs emulsion did not exhibit delamination or demulsification under cold-tolerant (−20 °C) or heat-resistant (40 °C) conditions (Figure S5). And the transmittance of the GS-LPs emulsions did not change much over ∼ 0–24 h (Figure 4b). Even in the high temperature (90 °C), the transmittance of the GS-LPs emulsions changed little (Figure 4c). Then the GS-LPs emulsions were diluted with deionized water at different concentrations (∼ 10.0-0.5 wt%), and the stability of the emulsions during long-term storage was observed under the same condition (Figure 4d and Figure S6). All the GS-LPs emulsions were homogeneous at 0–180 d. The corresponding light transmittance of all the emulsions tended to stabilize over time. The above results showed that the prepared GS-LPs possessed good stability under various conditions (different pH, different temperatures, and long time). GS-LPs, with their unique nanoscale size and surface effects, could significantly overcome the limitations of traditional ginseng extracts in terms of absorption, bioavailability, and stability. 45 By providing a more stable and efficient mechanism, LPs could enhance the deep penetration and absorption of active ingredients, while synergizing multiple ginseng extracts to exhibit much stronger bioactivity.22–24

(A) Chart of Calculated Transmittance (∼ 450 nm) of the GS-LPs Emulsion at pH from 1 to 14; (B) Chart of Calculated Transmittance (∼ 450 nm) of the GS-LPs Emulsion at −20 °C and 40 °C from ∼ 0–24 h; (C) Chart of Calculated Transmittance (∼ 450 nm) of the GS-LPs Emulsion at 90 °C from ∼ 0–30 min; (D) Chart of Calculated Transmittance (∼ 450 nm) of the GS-LPs Emulsion at Different Concentrations (∼ 10.0-0.5 wt%) Under Storage Time from 0–180 d.
Preparation, Characterization and Bioactivity Analysis of the GS-LPs@Hy
For the aim to effectively deliver the active substances into the skin and to protect and improve human skin for a long time, the prepared GS-LPs were further loaded into hydrogels with excellent mechanical properties, moisturizing properties and antibacterial properties. The GS-LPs@Hy were mainly obtained by mixing GS-LPs, PVA, Gel, HA, and SCS at a certain reaction ratio at high temperature and then freezing at −20 °C. As the main component of the synthesis, the concentration change of PVA has the greatest impact on the stiffness and related mechanical properties of the Hy. Other conditions were fixed, and the reaction concentration of PVA was adjusted (∼ 1.0-3.5 wt%) to prepare Hy. Then the related mechanical properties were evaluated (Figure 5). At low PVA content (∼ 1.0-1.5 wt%), the prepared Hy was so soft that it was difficult to form certain shape. The manual compressibility of the Hy decreased linearly with the PVA content increased (Figure 5a and 5b). When the PVA content was ∼ 2.0–2.5 wt%, the Hy showed suitable hardness and ductility, which was more conducive to fitting the skin. When the PVA content reached ∼ 3.0–3.5 wt%, the prepared Hy was too rigid to be compressed or deformed (Figure S7). Rheological tests were performed simultaneously on the above synthesized Hy (Figure 5c). With the increase of the PVA reaction concentration, the storage modulus (G′) and complex viscosity of the Hy increased. When the PVA concentration was ∼ 1.0–2.0 wt%, the loss modulus (G′′) of the Hy was relatively large. When the PVA concentration was ∼ 2.5–3.5 wt%, the loss modulus (G′′) of the Hy was smaller. Considering that as the main body of skin care excipient, the hydrogel selected should have suitable mechanical properties and low cost, the PVA reaction concentration of 2.5 wt% was used for the subsequent preparation of the Hy.

(A) Manually Compressed Photos of the Hy Prepared at Different Reaction Concentrations of PVA (∼ 1.0-3.5 wt%); (B) The Corresponding Manual Compression Rate Change Plots and Strain Scan Curves (c).
Gel was selected as an important backbone component for the Hy due to its good biodegradability, biocompatibility and film-forming properties (Figure 6). The effect of the change in reaction concentration of Gel (∼ 0.2-1.0 wt%) on the mechanical properties of the prepared Hy was investigated (Figure 6a). The rheological results showed that G′ of the Hy increased as the reaction concentration of Gel increased from ∼ 0.2–0.5 wt%. When the reaction concentration of Gel increased to 1.0 wt%, G′ of the Hy decreased. It suggested that too high a concentration of Gel can affect the overall mechanical properties of the prepared Hy (Figure 6a and S8). Therefore, 0.4 wt% was selected as the reaction concentration of Gel to prepare the Hy. Investigate the moisturizing efficiency of the prepared Hy at different reaction concentrations (∼ 1.0-2.0 wt%) of the moisturizing active ingredient HA (Figure 6b and 6c). All the prepared Hy comprised of HA had moisturizing properties even after 24 h at room temperature. The average moisture retention rate of the Hy was around 72.0 ± 5.0% when the HA reaction concentration was ∼ 1.0–1.2 wt%. When the HA reaction concentration was ∼ 1.4–2.0 wt%, the moisturizing rate of Hy was around 82.0 ± 5.0%. Therefore, under the condition, the minimum amount (1.4 wt%) of HA was chosen for the preparation of the Hy. The effect of the change in the reaction concentration of the antimicrobial component SCS (0 and ∼ 0.1-0.2 wt%) on the antimicrobial properties of the Hy was also tested (Figure 6d). The prepared Hy without SCS showed little antibacterial activity against the staphylococcus aureus (S. aureus). While with the increase of the SCS concentration, the inhibition zone increased with a little enhancement. Therefore, the reaction concentration of the SCS was selected as 0.2 wt% to prepare the Hy.

(A) Rheological Scanning Curves of the Hy Prepared at Different Reaction Concentrations of the Gel (∼ 0.2-1.0 wt%); (B) Variation Curves of the Prepared Hy at Different Reaction Concentrations of the HA (∼ 1.0-2.0 wt%) from 0 to 24 h; (c) The Corresponding Chart of the Changes in Moisture Retention Rate at 24 h; (d) Photos of Antibacterial Plates of the Prepared Hy at Different Reaction Concentrations of the SCS and the Pure SCS Aqueous Solution Against S. aureus.
Finally, the GS-LPs with different mass fractions were added to the hydrogel (PVA ∼ 2.5 wt%, Gel ∼ 0.4 wt%, HA ∼ 1.4 wt%, and SCS ∼ 0.5 wt%) and frozen at −20 °C (∼ 6-24 h) to prepare the optimal GS-LPs@Hy. The GS-LPs@Hy obtained from different mass ratios of GS-LPs (5.0, 10.0, and 15.0 wt%) were labeled as GS-LPs(5%)@Hy, GS-LPs(10%)@Hy, and GS-LPs(15%)@Hy, respectively. The GS-LPs(5%)@Hy and GS-LPs(10%)@Hy were needed to be frozen for 6 h to form homogeneous and stable hybrid hydrogels, while GS-LPs(15%)@Hy was needed to be frozen for 12 h to form a homogeneous and stable hybrid hydrogel (Figure S9 and S10). In vitro experiments showed that compared with the control group (GS-LPs@Hy 0 μg/mL), the GS-LPs@Hy had good proliferative effect on both the Hacat cells and HDF-α cells (Figure 7a). With the increase of the mass ratio of the GS-LPs in the Hy, the cell viability exhibited an upward trend. Compared with the result of the GS-LPs on the Hacat cells and HDF-α cells (Figure 2), the GS-LPs@Hy was similarly able to promote the growth of skin cells. It also implied that after loading, the activity of the GS-LPs was not affected by the Hy, but can be slowly released to play an effective role. Compared with other hybrid hydrogels prepared with different GS-LPs content loading, the freezing time of GS-LPs(10%)@Hy was shorter, and the proliferation effect of Hacat cells and HDF-α cells was obvious.
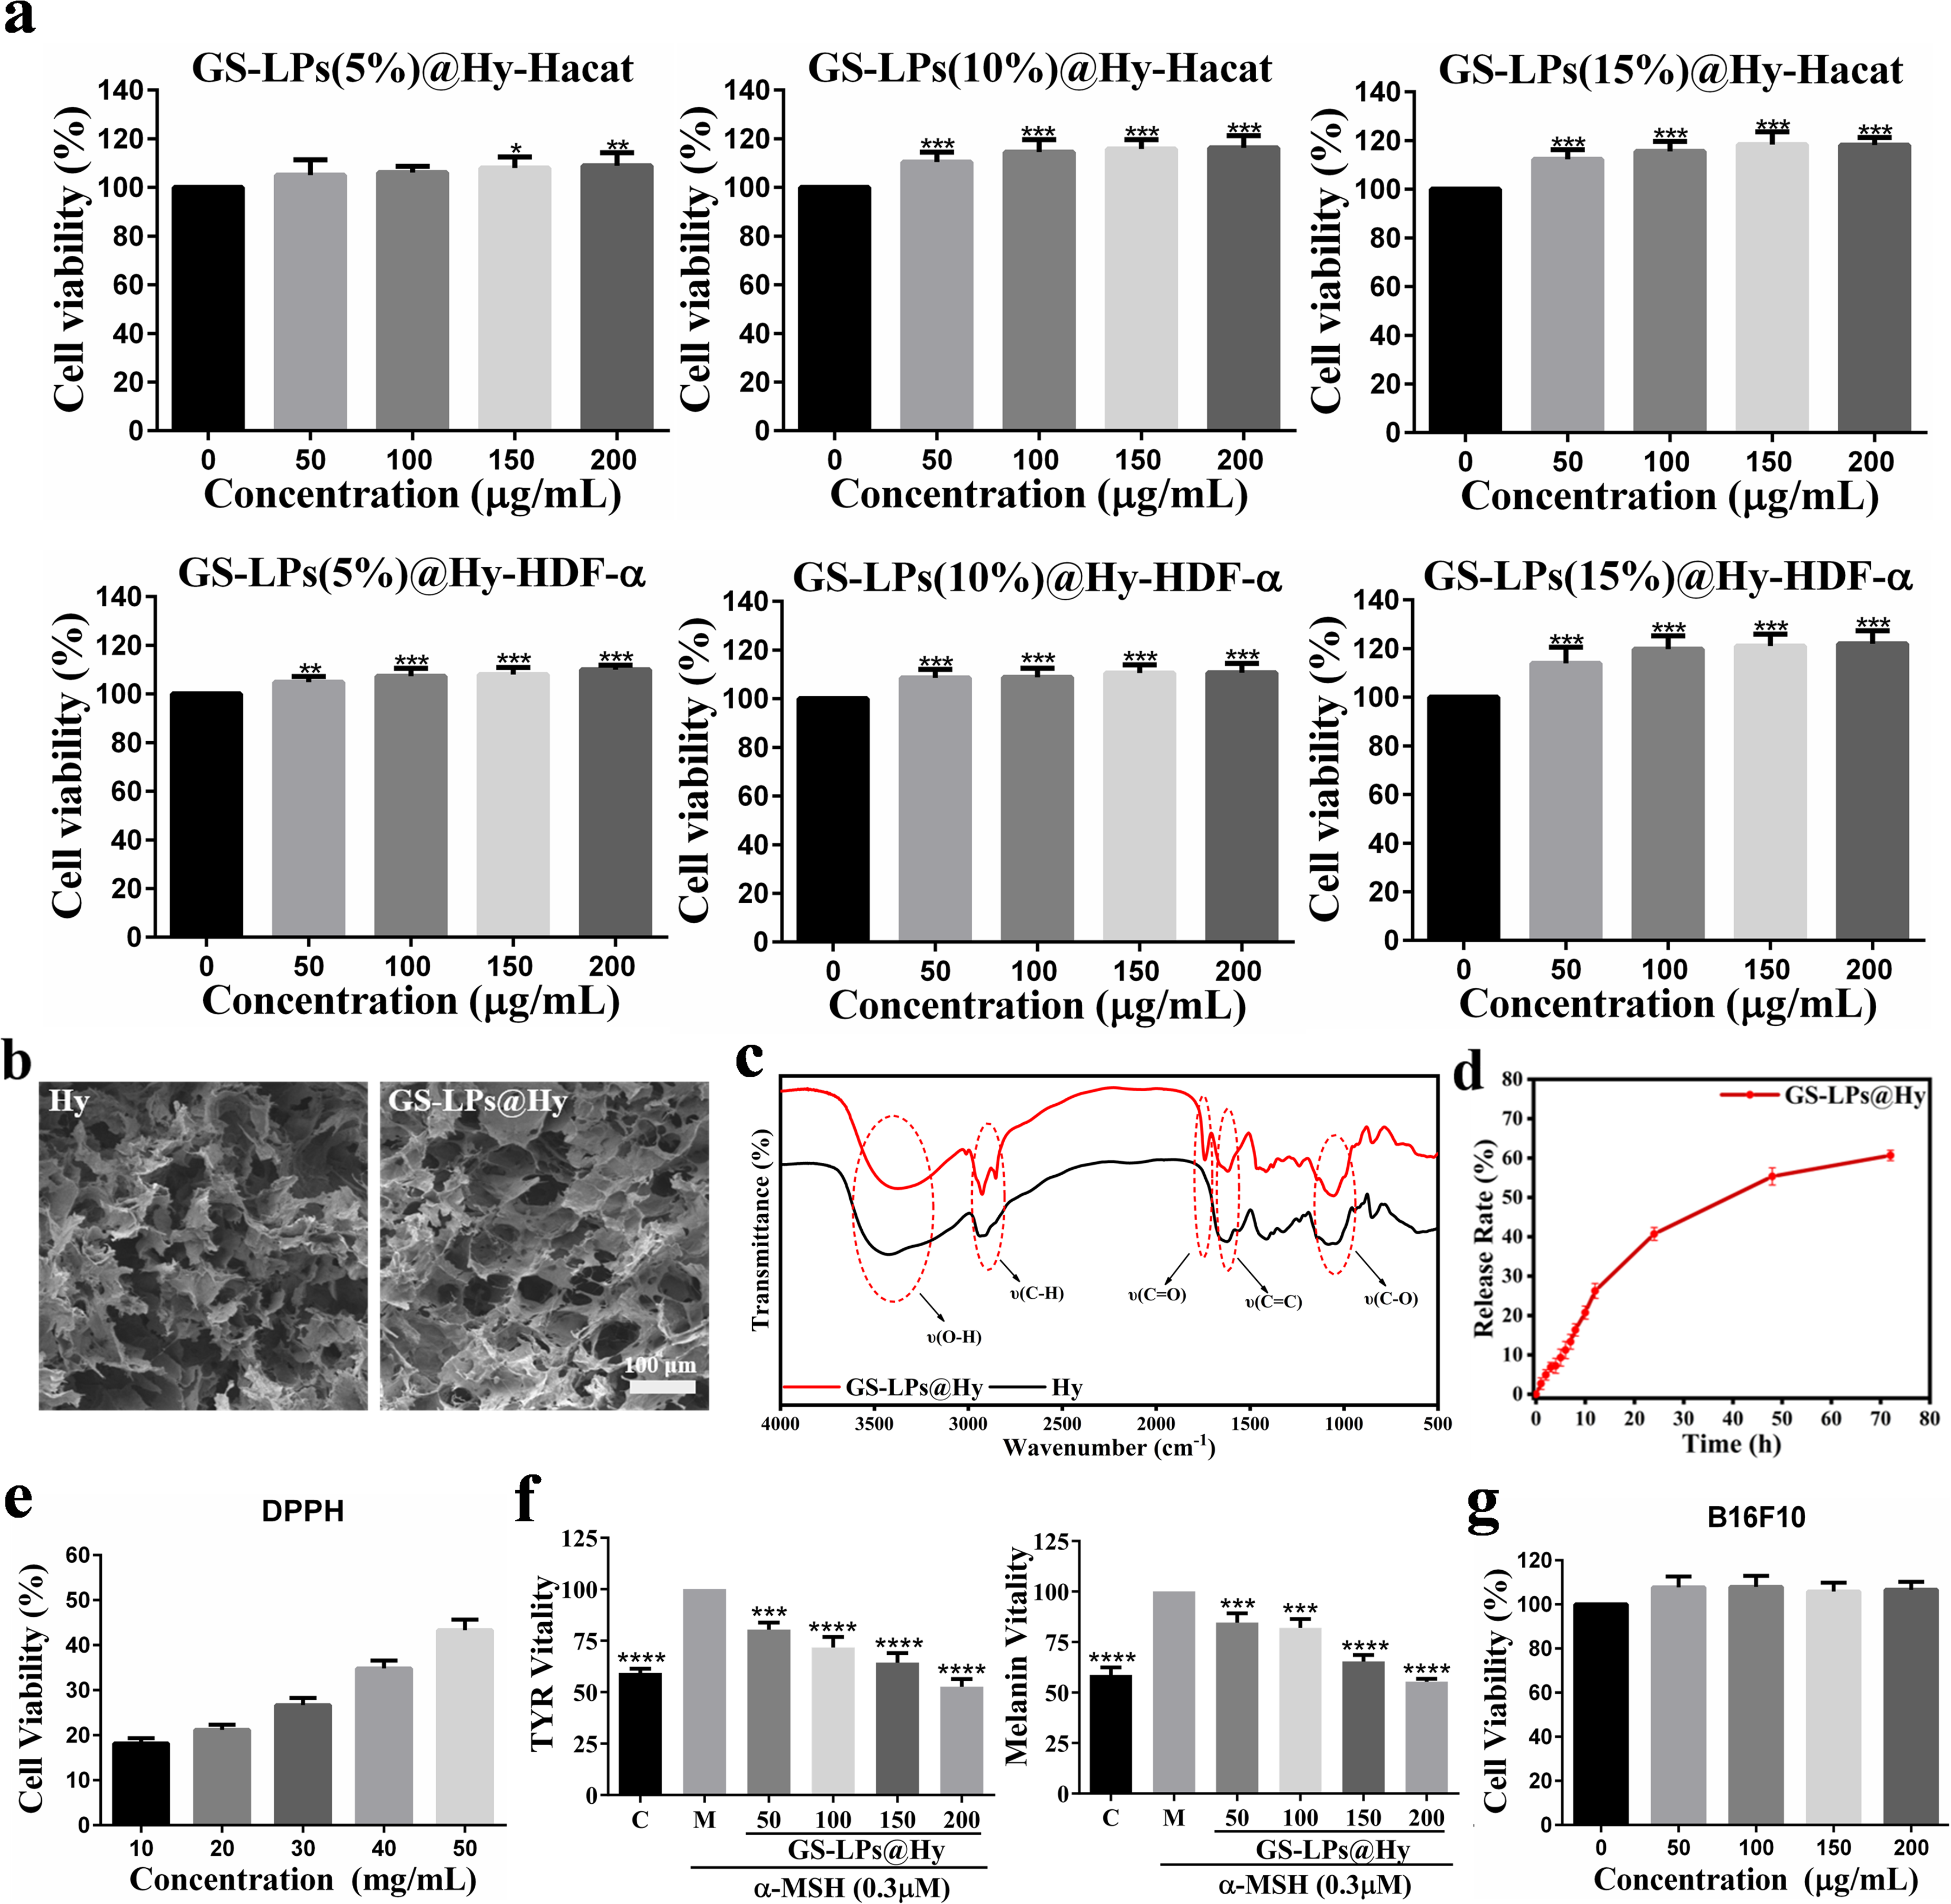
(A) Diagram of the Proliferation Activity of the Hacat Cells and the HDF-α Cells After Incubation with the GS-LPs@Hy of Different Concentrations. Data Were Mean ± sd (n = 6). **p < 0.01 and ***p < 0.001 Relative to 0 µg/mL, as Analyzed by One-Way ANOVA; (B)The SEM Images of the Hy (left) and the GS-LPs@Hy (right); (C) The FTIR Spectra of the GS-LPs@Hy and the Hy; (D) In vitro release Curve of the GS in the GS-LPs@Hy at 0–72 h; (E) Calculation Diagram of DPPH Clearance Rate by the GS-LPs@Hy; (F) Calculation Diagram of the Effect Of Different Concentrations of the GS-LPs@Hy on the Melanin Content and TYR Activity of the B16F10 Cells; (G) Diagram of the Cell Viability of the B16F10 Cells After Incubation with the GS-LPs@Hy of Different Concentrations. Data Were Mean ± sd (n = 3). *p < 0.05, ***p < 0.001, and ****p < 0.0001 Relative to M, as Analyzed by One-Way ANOVA.
Discussion
Based on the above results, a typical GS-LPs@Hy had been synthesized and studied under the reaction conditions: PVA ∼ 2.5 wt%, Gel ∼ 0.4 wt%, HA ∼ 1.4 wt%, SCS ∼ 0.2 wt%, and GS-LPs ∼ 10.0 wt%, with freezing time of 6 h. In the SEM image, the pore size of the Hy without GS-LPs was in the range of ∼ 20–200 μm (Figure 7b). Many loose pores could make the inside of the Hy have a large specific surface area, as well as good load capacity. After combining with GS-LPs, the pores of the GS-LPs@Hy became smaller and denser. FTIR was used to compare the structures of GS-LPs@Hy, Hy, and GS-LPs (Figures 3b and 7c). The results showed that GS-LPs@Hy contained the basic characteristic absorption peak of both the Hy and the GS-LPs. The in vitro simulated release of GS-LPs@Hy in PBS was detected by UV-Vis at 203 nm (Figure 7d). The results showed that the GS-LPs@Hy could release GS active substances slowly and sustainably.
Furthermore, the in vitro skin activity of the GS-LPs@Hy was estimated (Figures 7e-g). GS-LPs@Hy in the concentration range of ∼10–50 mg/mL had good scavenging ability to DPPH, with concentration-dependent. At a concentration of 50 mg/mL, the clearance rate was as high as ∼ 42.3% (Figure 7e). The effect of the GS-LPs@Hy on melanin content and TYR activity in B16F10 cells was also examined (Figure 7f). The B16F10 cells in other groups were treated α-MSH of 0.3 μM to stimulate melanin. Compared with the model group (labeled M, GS-LPs@Hy of 0 μg/mL), the intracellular melanin content and TYR activity of the B16F10 cells were significantly decreased after treatment with different concentrations of GS-LPs@Hy (50, 100, 150, and 200 μg/mL). The GS-LPs@Hy also showed little cytotoxicity to the B16F10 cells (Figure 7g). The result indicated that the GS-LPs and Hy were able to bind efficiently and achieve the transport and sustained release of active substances in large quantities, exhibiting good antioxidant and anti-melanin properties (Figure 7). Compared with the reported composite hydrogels, the ginseng extract loaded in GS-LPs@Hy has multiple effects, including promoting skin cell proliferation and repair, antioxidation, and whitening activities. 46 Furthermore, as a delivery medium, liposomes leverage their unique nanoscale size and surface effects to synergize efficiently with the hydrogel, enabling the composite GS-LPs@Hy to demonstrate significant multifunctional advantages in comprehensive skin care.36,37
A mouse model of skin UV injury was established to explore the repairing effect of the prepared GS-LPs@Hy (Figure 8). Mice with an average body weight of 30.0 ± 2.0 g were treated for hair removal and randomized (n = 3). The mice in the Control group were done no treatment except for hair removal. The backs of other mice were irradiated continuously under UV light of 365 nm for 30 min/d for 7 d, to establish the skin model of UV damaged. Mice that not given any dressings to their damaged backs were used as the Model group. Mice treated with GS-LPs(5%)@Hy, GS-LPs(10%)@Hy, and GS-LPs(15%)@Hy dressings (∼ 1.5 cm diameter, ∼ 6 h/d) on the damaged backs were as the Low dose, Middle dose, and High dose group, respectively. The experiment ended after 7 d of continuous repair (Figure 8). The redness and swelling of the damaged skin of mice in the Model group decreased slightly, with dark and dry state. The damaged skin of mice in all dosing groups improved obviously. In particular, the damaged skin of the mice in the Middle dose and High dose groups was significantly white, moist, and shiny, with little redness and swelling. It proved that the prepared GS-LPs@Hy can treat UV damaged skin well, eliminate redness and swelling, accelerate the growth of skin tissue, and have obvious skin care properties such as whitening and moisturizing.

(A) Photos of the Back Skin of Mice in the Control Group, Model Group, Low dose Group, Middle dose Group, and High dose Group From 0 to 7 d; (B) The H&E and Masson Stained Sections of Tissues Near the UV Damaged Skin of Mice in Each Group at the Seventh d. (n = 3).
The skin tissue around UV damage of mice in each group was sectioned, H&E stained and Masson stained (Figure 8b). H&E staining results showed the skin tissue of the mice in the Control group had an intact epidermis and a clear structure. The collagen fibers in the stratum corneum and dermis are neatly arranged (black arrow). The epidermis of the skin of mice in the Model group was thicker. Some connective tissue hyperplasia can be seen in the dermis (green arrow). Some fibroblasts, fibrocytes and collagen fibers were arranged in staggered manner, accompanied by some lymphocyte infiltration (black arrow). The epidermis of the skin tissue of the mice in the Middle dose group and High dose group was more complete and the structure was clear. Fibroblasts, fibrocytes and collagen fibers arranged very neatly. There was almost no lymphocyte infiltration (black arrow). Moreover, the fibroblasts and fibrocytes in the skin of mice in these two groups increased, and the skin condition was better than that in the Control group. Masson staining results showed that after GS-LPs@Hy intervention (Low dose, Middle dose, and High dose), the collagen content of mouse skin increased significantly compared with the Control group (black arrow). Masson staining results showed that compared with the Model group, the skin tissue of mice treated with GS-LPs@Hy had fewer inflammatory cells, more fibroblasts and fibrocytes, and more arranged neatly. Under GS-LPs@Hy intervention (Low dose, Middle dose, and High dose), the collagen content of mouse skin increased significantly compared with that in the Model group and Control group (black arrow). And the greater the concentration of active substances loaded in GS-LPs@Hy, the better the recovery of damaged skin morphology. The in vivo experimental results showed that the prepared GS-LPs@Hy has good ability to repair and improve UV damaged skin.
Conclusion
In this study, a novel hybrid hydrogel GS-LPs@Hy with multiple skin care activities was designed. The GS-LPs@Hy loaded liposomes GS-LPs contained a large amount of natural herbal active ingredient GS. The reaction ratios of soy lecithin and cholesterol were fixed to prepare a series of GS-LPs containing different mass ratios of GS. By measuring the EE, drug content and in vitro viability, the optimal reaction mass ratio of GS was 12.5 wt%. The FTIR, TEM, and DLS results showed that the GS was successfully encapsulated in liposomes, and the prepared GS-LPs had a relatively uniform particle size distribution, with positive potential at −24.6 ± 0.3 mV. In order to promote the continuous and effective release of active substances and better application in the field of skin care, GS-LPs were further loaded into hydrogels to prepare multifunctional hybrid GS-LPs@Hy. The GS-LPs and Hy were able to bind efficiently and achieve the transport and sustained release of active substances in large quantities. The optimal reaction concentrations of each component in GS-LPs@Hy were determined to be PVA ∼ 2.5 wt%, Gel ∼ 0.4 wt%, HA ∼ 1.4 wt%, SCS ∼ 0.2 wt%, and GS-LPs ∼ 10.0 wt%, by measuring the mechanical properties, moisturizing rate, antibacterial properties and in vitro activity. The GS-LPs@Hy showed a good proliferative effect on the Hacat cells and HDF-α cells, high scavenging activity for DPPH, and could effectively inhibit the production of melanin in the B16F10 cells. Animal UV skin injury model experiments also suggested that the GS-LPs@Hy had a good repair and treatment effect on the damaged skin. The prepared GS-LPs@Hy has good biocompatibility, low biological toxicity, and a variety of functions including moisturizing, whitening, antioxidant and antibacterial towards skin. The prepared new hybrid GS-LPs@Hy here is expected to be applied to the improvement and repair of human skin application in the future. However, although the in vitro and in vivo experiments showed promising results, further clinical trials are still needed to evaluate the performance of GS-LPs@Hy in different skin conditions and populations, as well as to verify its safety, efficacy, and scalability in human applications.
Supplemental Material
sj-docx-1-npx-10.1177_1934578X251332366 - Supplemental material for Multifunctional Natural Herbal Extracts Liposomal Loaded Hybrid Hydrogel for Skin Improvement and Repair
Supplemental material, sj-docx-1-npx-10.1177_1934578X251332366 for Multifunctional Natural Herbal Extracts Liposomal Loaded Hybrid Hydrogel for Skin Improvement and Repair by Di Zhang, Ning Tian, Yonggang Guo, Ying Liu, Guang Sun, Rui Jiang, Xiaoyu He, Lizhi Xiao, Jiqiang Mi, Yi Liu, Wei Zheng and Yingnan Jiang in Natural Product Communications
Supplemental Material
sj-docx-2-npx-10.1177_1934578X251332366 - Supplemental material for Multifunctional Natural Herbal Extracts Liposomal Loaded Hybrid Hydrogel for Skin Improvement and Repair
Supplemental material, sj-docx-2-npx-10.1177_1934578X251332366 for Multifunctional Natural Herbal Extracts Liposomal Loaded Hybrid Hydrogel for Skin Improvement and Repair by Di Zhang, Ning Tian, Yonggang Guo, Ying Liu, Guang Sun, Rui Jiang, Xiaoyu He, Lizhi Xiao, Jiqiang Mi, Yi Liu, Wei Zheng and Yingnan Jiang in Natural Product Communications
Footnotes
Acknowledgements
The authors would like to thank the financial support by the China Scholarship Council.
Statement of Human and Animal Rights
All procedures in this study were conducted in accordance with the Animal Experiment Ethics Committee of Changchun University of Chinese Medicine (Grant No. 2020238) approved protocols.
Ethical Considerations
Ethical approval to report this case was obtained from Animal Experiment Ethics Committee of Changchun University of Chinese Medicine (Grant No. 2020238).
Informed Consent
There are no human subjects in this article and informed consent is not applicable.
Author Contributions/CRediT
Funding
The author(s) disclosed receipt of the following financial support for the research, authorship, and/ or publication of this article: This work was supported by the Jilin Scientific and Technological Development Programs (20210204176YY and 232668G0101104825).
Conflicting Interests
The author(s) declared no potential conflicts of interest with respect to the research, authorship, and/or publication of this article.
Supplemental Material
Supplemental material for this article is available online.
References
Supplementary Material
Please find the following supplemental material available below.
For Open Access articles published under a Creative Commons License, all supplemental material carries the same license as the article it is associated with.
For non-Open Access articles published, all supplemental material carries a non-exclusive license, and permission requests for re-use of supplemental material or any part of supplemental material shall be sent directly to the copyright owner as specified in the copyright notice associated with the article.