
Abstract
Objective
Elevated concentrations of total phenolic content (TPC) and total flavonoid content (TFC) in extracts from wild Psidium guajava L. leaves are associated with their antioxidant and α-glucosidase inhibitory activities. This study aimed to determine the optimal ultrasound-assisted extraction conditions to maximize TPC, TFC yield, as well as antioxidant and α-glucosidase inhibitory potential.
Methods
The central composite design (CCD) of Response Surface Methodology (RSM) was employed for empirical model development with three levels of factors, including ethanol concentration (33.18 to 66.82% in distilled water), extraction time (1.59 to 18.41 min) and solvent-to-solid ratio (5.79 to 14.20 mL/g).
Results
The results indicated that under optimal conditions, the total phenolic content (TPC) and total flavonoid content (TFC) values were 152.954 mg GAE/g DW and 113.871 mg QE/g DW, respectively. These conditions included an ethanol concentration of 51.94%, an extraction time of 9.56 min, and a solvent-to-solid ratio (v/w) of 10.84 mL/g. Furthermore, the maximum values for DPPH and ABTS radical scavenging activities were 124.990 mg TE/g DW and 194.730 mg TE/g DW, respectively and the lowest IC50 for α-glucosidase inhibitory activity recorded at 11.946 µg/mL. The validated models exhibited strong consistency between the predicted and experimental values, with variations of less than 5% under optimal conditions. Additionally, Principal Component Analysis (PCA) also confirmed the appropriate model to predict the extraction yield of total polyphenol and flavonoid content, as well as their biological activities, including DPPH and ABTS radical scavenging and alpha-glucosidase inhibitory activities.
Conclusions
The enhancement of antioxidant and antidiabetic extraction processes in both the pharmaceutical and food industries through the use of ultrasound-assisted extraction from Wild Guava leaves can increase production to meet high demand. This efficiency is particularly noteworthy, as it demonstrates the advantages of using ultrasound in the extraction process.
Keywords
Introduction
Wild guava leaves (Psidium guajava L.) have been used by local communities for a variety of purposes, including managing diarrhea, addressing gastric issues, and regulating blood glucose levels in people with diabetes. Research has shown that guava leaves are a rich source of polyphenolic and flavonoid components, with the main compounds of gallic acid, catechin, rutin, quercetin, apigenin, quercitrin, vitexin, and apigenin-7-O-D-glucopyranoside. 1 Additionally, these leaves contain significant amounts of carotenoids and chlorophylls. 2 The composition of these components can vary according to the drying temperature and method.1,2 Moreover, wild guava leaf extract exhibited high antioxidant and antidiabetic activities.1–3 It demonstrated greater inhibitory effects against α-glucosidase and α-amylase than guava leaf extracts reported by Liu et al (2014). This suggests a promising potential for use as a natural therapeutic agent. 4
The beneficial components of medicinal plants are frequently utilized in the form of liquid or solid extracts. To ensure the production of high-quality extracts, it is imperative to examine and optimize the factors that influence the extraction process. The extraction process plays a crucial role in obtaining biologically active compounds; however, there is no universally applicable technique for extracting all phytochemical compounds from diverse raw materials. The selection of extraction techniques and conditions depends on the series of compounds to be extracted and the physicochemical properties of the material under consideration. 5 Traditional solvent extraction methods are employed to isolate organic compounds, which are critical components of plant-derived liquid extracts. These conventional techniques typically exhibit low efficiency, are time-consuming and highly energy-intensive, and require large quantities of toxic organic solvents. These limitations can be substantially mitigated by employing more recent extraction methods. These innovative approaches include extractions utilizing supercritical fluids, microwaves, and ultrasounds, among others, which have been applied to extract phenolic compounds.6–8 Notably, ultrasound-assisted extraction (UAE) has gained prominence for its efficacy, environmental friendliness, commercial viability, ease of use, and broad applicability, notwithstanding the challenges linked to industrial-scale implementation.9–12 According to Serna et al, 13 UAE achieved a significantly higher extraction yield of up to 85% compared to conventional solid-liquid extraction, while requiring substantially less energy input. UAE efficiency generally depends on factors such as ultrasonic wave frequency, temperature, sonication time, solvent characteristics, solid-to-solvent ratio, and sample particle size, with cavitation bubble production being a crucial element that disrupts plant tissues to increase the mass transfer and facilitates the release of cellular contents.14,15 Typically, UAE enhances extraction efficiency, yielding plant derivatives richer in secondary metabolites compared to alternative methods.16–18 Numerous variables, including extraction time, temperature, solvent type, and concentration, influence the extraction of plant phenolic compounds.19,20 Selecting the appropriate solvent type, optimal conditions for each plant sample is essential for achieving maximum yield for each invidual natural compound. 21
Using response surface methodology (RSM), the process of designing, analyzing, and predicting extraction conditions has been thoroughly conducted. In contrast to the traditional one-factor-at-a-time optimization method, RSM takes into account the interactions between variables. This approach provides a more thorough understanding and enhances the likelihood of achieving the optimal conditions. RSM is widely utilized in various fields, including agriculture, biology, food, and chemistry.12,22 To overcome this limitation, statistical methods such as the Central Composite Design (CCD), derived from RSM, have emerged. These methods facilitate the prediction of optimal extraction conditions and elucidate the relationships between extraction factors. Thus, the objective of this study is to identify the optimal solvent and optimize extraction conditions for maximizing antioxidants and antidiabetic phenolic compounds extracted from wild guava leaves (Psidium guajava L.) via UAE methodology. Using the CCD, the study aims to predict a model and optimize extraction conditions. Specifically, it focuses on ethanol concentration, sonication extraction time, and solvent-to-solid ratio. These parameters are optimized based on criteria that include total phenolic and flavonoid contents, as well as their antioxidant and α-glucosidase inhibitory activities. This study was conducted on wild guava leaves, which have been shown to contain higher levels of bioactive compounds than other species, and the optimal model was validated through Principal Component Analysis (PCA).
Results and Discussion
Effect of Investigated Parameters on Extract's Biological Activities
The CCD was applied and is presented in Table 1 with five levels of ethanol concentration, sonication extraction time, and solvent-to-solid ratio. The results showed that all these abovementioned factors significantly affected the extraction yield of TPC, TFC as well as antioxidant and α-glucosidase inhibitory activities (P < .05). The TPC, TFC, DPPH and ABTS radical scavenger ranged from 95.221 to 157.175 mg GAE/g, 36.645 to 116.922 mg QE/g, 37.408 to 125.646 mg TE/mg, and 69.560 to 193.109 mg TE/mg, respectively. The IC50 values for inhibition of α-glucosidase were from 11.389 to 21.708 µg/mL. Previous studies demonstrated that the major factors, which affect the most the effectiveness of UAE, are extraction time, temperature, ultrasound power, ratio of materials to solvent, characteristic of solvents, and pH.25–27 The analysis presented in Table 2 observes the variance to determine the fit of the optimization model and the regression coefficient values for the experimental variables. Indeed, the sum of squares, F-value, and P-values (
Experiment Conditions for Central Composite Design (CCD) and Corresponding Results Obtained for Total Polyphenol and Flavonoid Content, in Vitro Antioxidant and Antidiabetic Properties of Guava Leaf Extract.
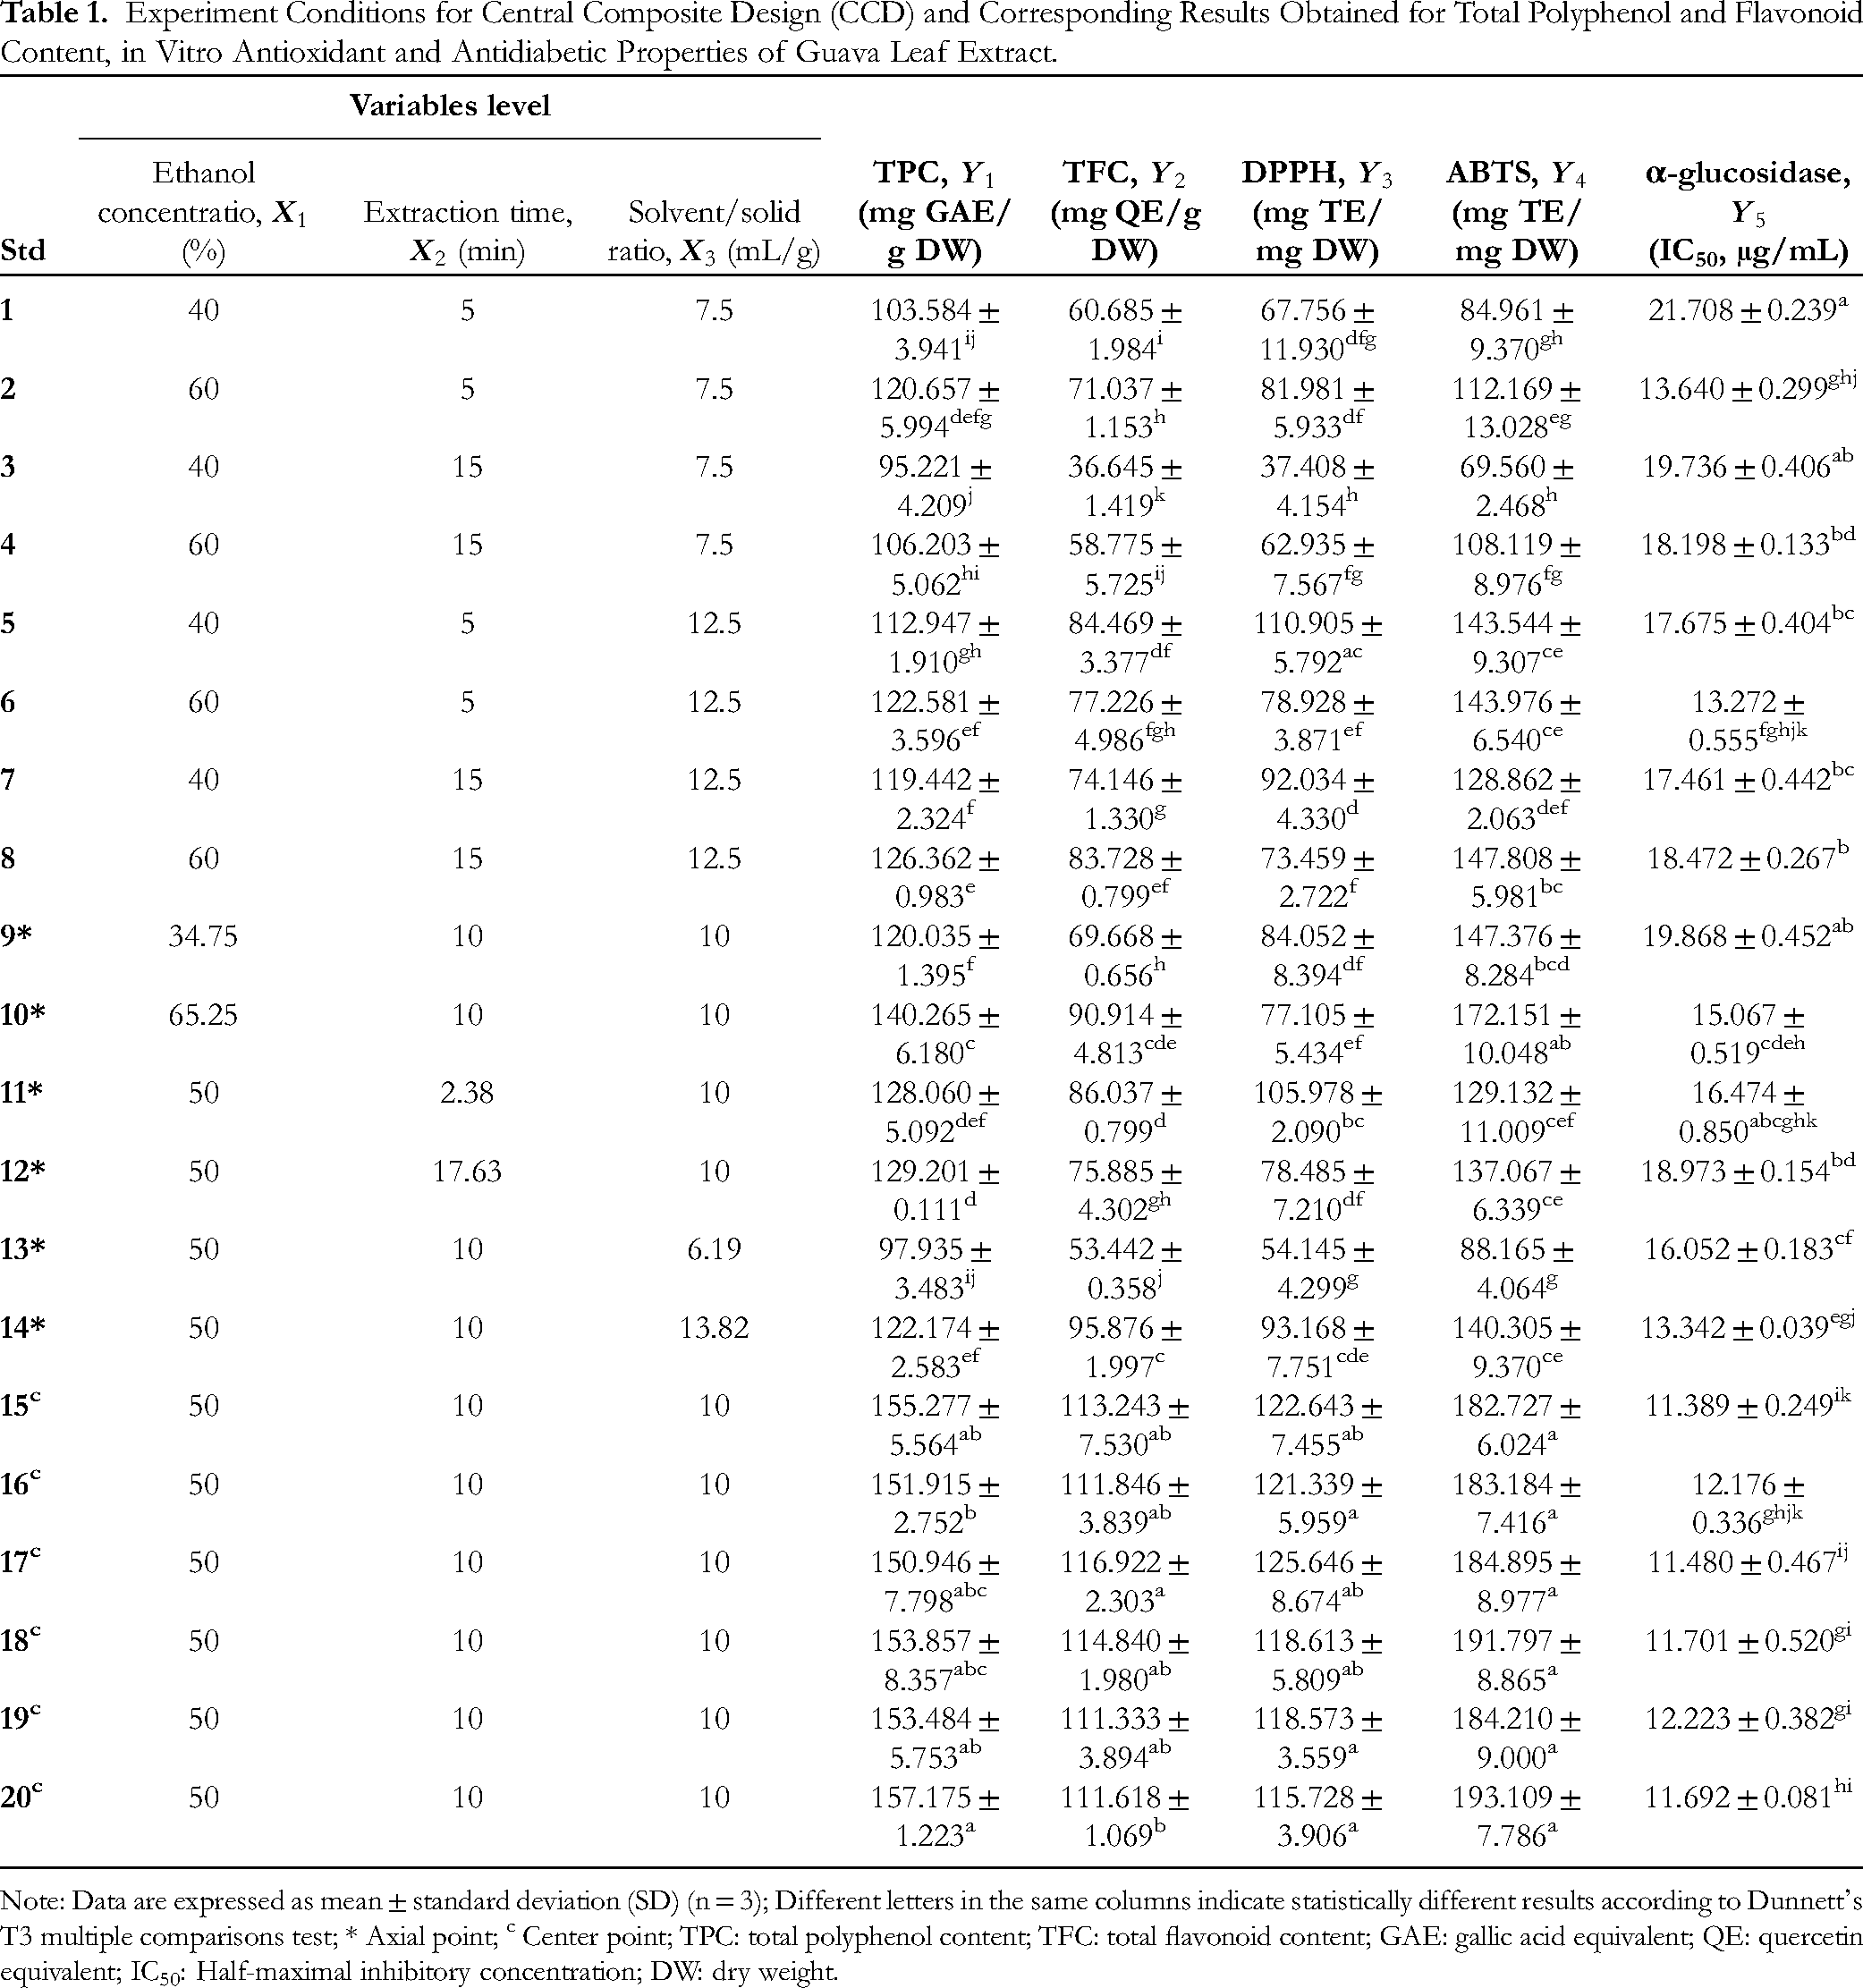
Note: Data are expressed as mean ± standard deviation (SD) (n = 3); Different letters in the same columns indicate statistically different results according to Dunnett's T3 multiple comparisons test; * Axial point; c Center point; TPC: total polyphenol content; TFC: total flavonoid content; GAE: gallic acid equivalent; QE: quercetin equivalent; IC50: Half-maximal inhibitory concentration; DW: dry weight.
Analysis of Variance for the Independent Variables Studied in the Extraction of Wild Guava Leaves by the Experimental Treatments.

Note: TPC: total polyphenol content; TFC: total polyphenol content; P-values < .05 indicate model terms are significant; The Lack of Fit P-value > .05 implies the Lack of Fit is not significant relative to the pure error. Non-significant lack of fit is good.
Effect of Operational Parameters on the Total Polyphenol and Flavonoid Contents
The results of a quadratic model developed for total phenolic and flavonoid contents (Table 2) revealed that the significant coefficients in the quadratic model including the quadratic coefficients (
Designed Equation Models for the Selected Dependent Variables Responses. Ethanol Concentration (EtOH Concentration, %,

Note:
Figure 1a-b and 1e-f demonstrated the impact of the extraction time on the extraction yield of TPC. The results indicated that an increase in the sonication extraction time led to an increase in the TPC yield, which reached its peak at 10 min. Nevertheless, above an extraction time of 10 min, the extraction yield of TPC started to decrease. This beneficial effect of sonication on the extraction yield can be explained by the cavitation bubbles created by the use of 28 kHz sonication. Indeed, these bubbles could disrupt the cell membrane, leading to enhanced solubility of phenolic compounds in the solvent. This phenomenon has also been confirmed in previous studies15,28 by Thilakarathna et al (2023) and da Silva et al (2021). In another aspect, prolonged sonication may accelerate molecular movement, potentially altering the structure of the phenolic compounds. This alteration may degrade these compounds, ultimately reducing the extraction efficiency of TPC. A similar phenomenon was observed in the literature.29,30 The ethanol concentration also had a significant impact on the TPC extraction yield (Table 1, Figure 1a-b & 1c-d). TPC peaked at an ethanol concentration of approximately 50% and tended to decrease above this concentration. Alterations in the ethanol concentration resulted in changes in the physical properties of the solvent, including density, dynamic viscosity, and dielectric constant. These changes also affected the solubility of the compounds, thereby influencing the yield of phenolic compounds. In addition, an appropriate concentration of ethanol can modify the cell structure by swelling the matrix and, in combination with the reduced viscosity effect, facilitates solvent penetration into the cell tissue. High ethanol concentrations (exceeding 55%) lead to a decrease in TPC yield, which may be due to a lower dielectric constant, resulting in reduced solvent polarity, which in turn affects the extraction yield.31,32 The results in this study are in line with that33,34 of Hammi et al (2015) and Jiménez-Moreno et al (2019). In these studies, the authors also proved that the highest TPC extracted from grape stems and Zizyphus lotus fruits was obtained with 50% ethanol. Furthermore, the diffusion process relies primarily on the concentration gradient, as described by Fick's law. Consequently, high concentrations lead to saturation of the exhaustion of the reaction medium and obstruct the displacement of the extraction solvent. 35 The higher the ratio of solvent to solid material is, the better the extractability of phenolic compounds is, but excessive ratios may result in a decrease in TPC (Figure 1c-f). However, the effectiveness of ultrasonication may also be related to its enhancement in the transfer of solute into the solvent and by enhancing the oxygenation and disintegration of the solute. The contribution of the solvent/solid material ratio in this study is in concordance with another study on TPC extraction from purple rice bran, in which the solvent/solid material ratio was also chosen for optimization. 36

The surface (a, c, e) and contour (b, d, f) plots showing the interactive effect of Ethanol concentration and Extraction time (a & b), Ethanol concentration and Sol./solid ratio (c & d), Extraction time and Sol./solid ratio (e & f) on the Total polyphenol content (TPC) of guajava leaf extract.
The analysis of variance (ANOVA) for TFC was significant (P < .05), affirming that all quadratic, interaction, and linear coefficients in the quadratic model were significantly different (Table 2). Furthermore, the predicted
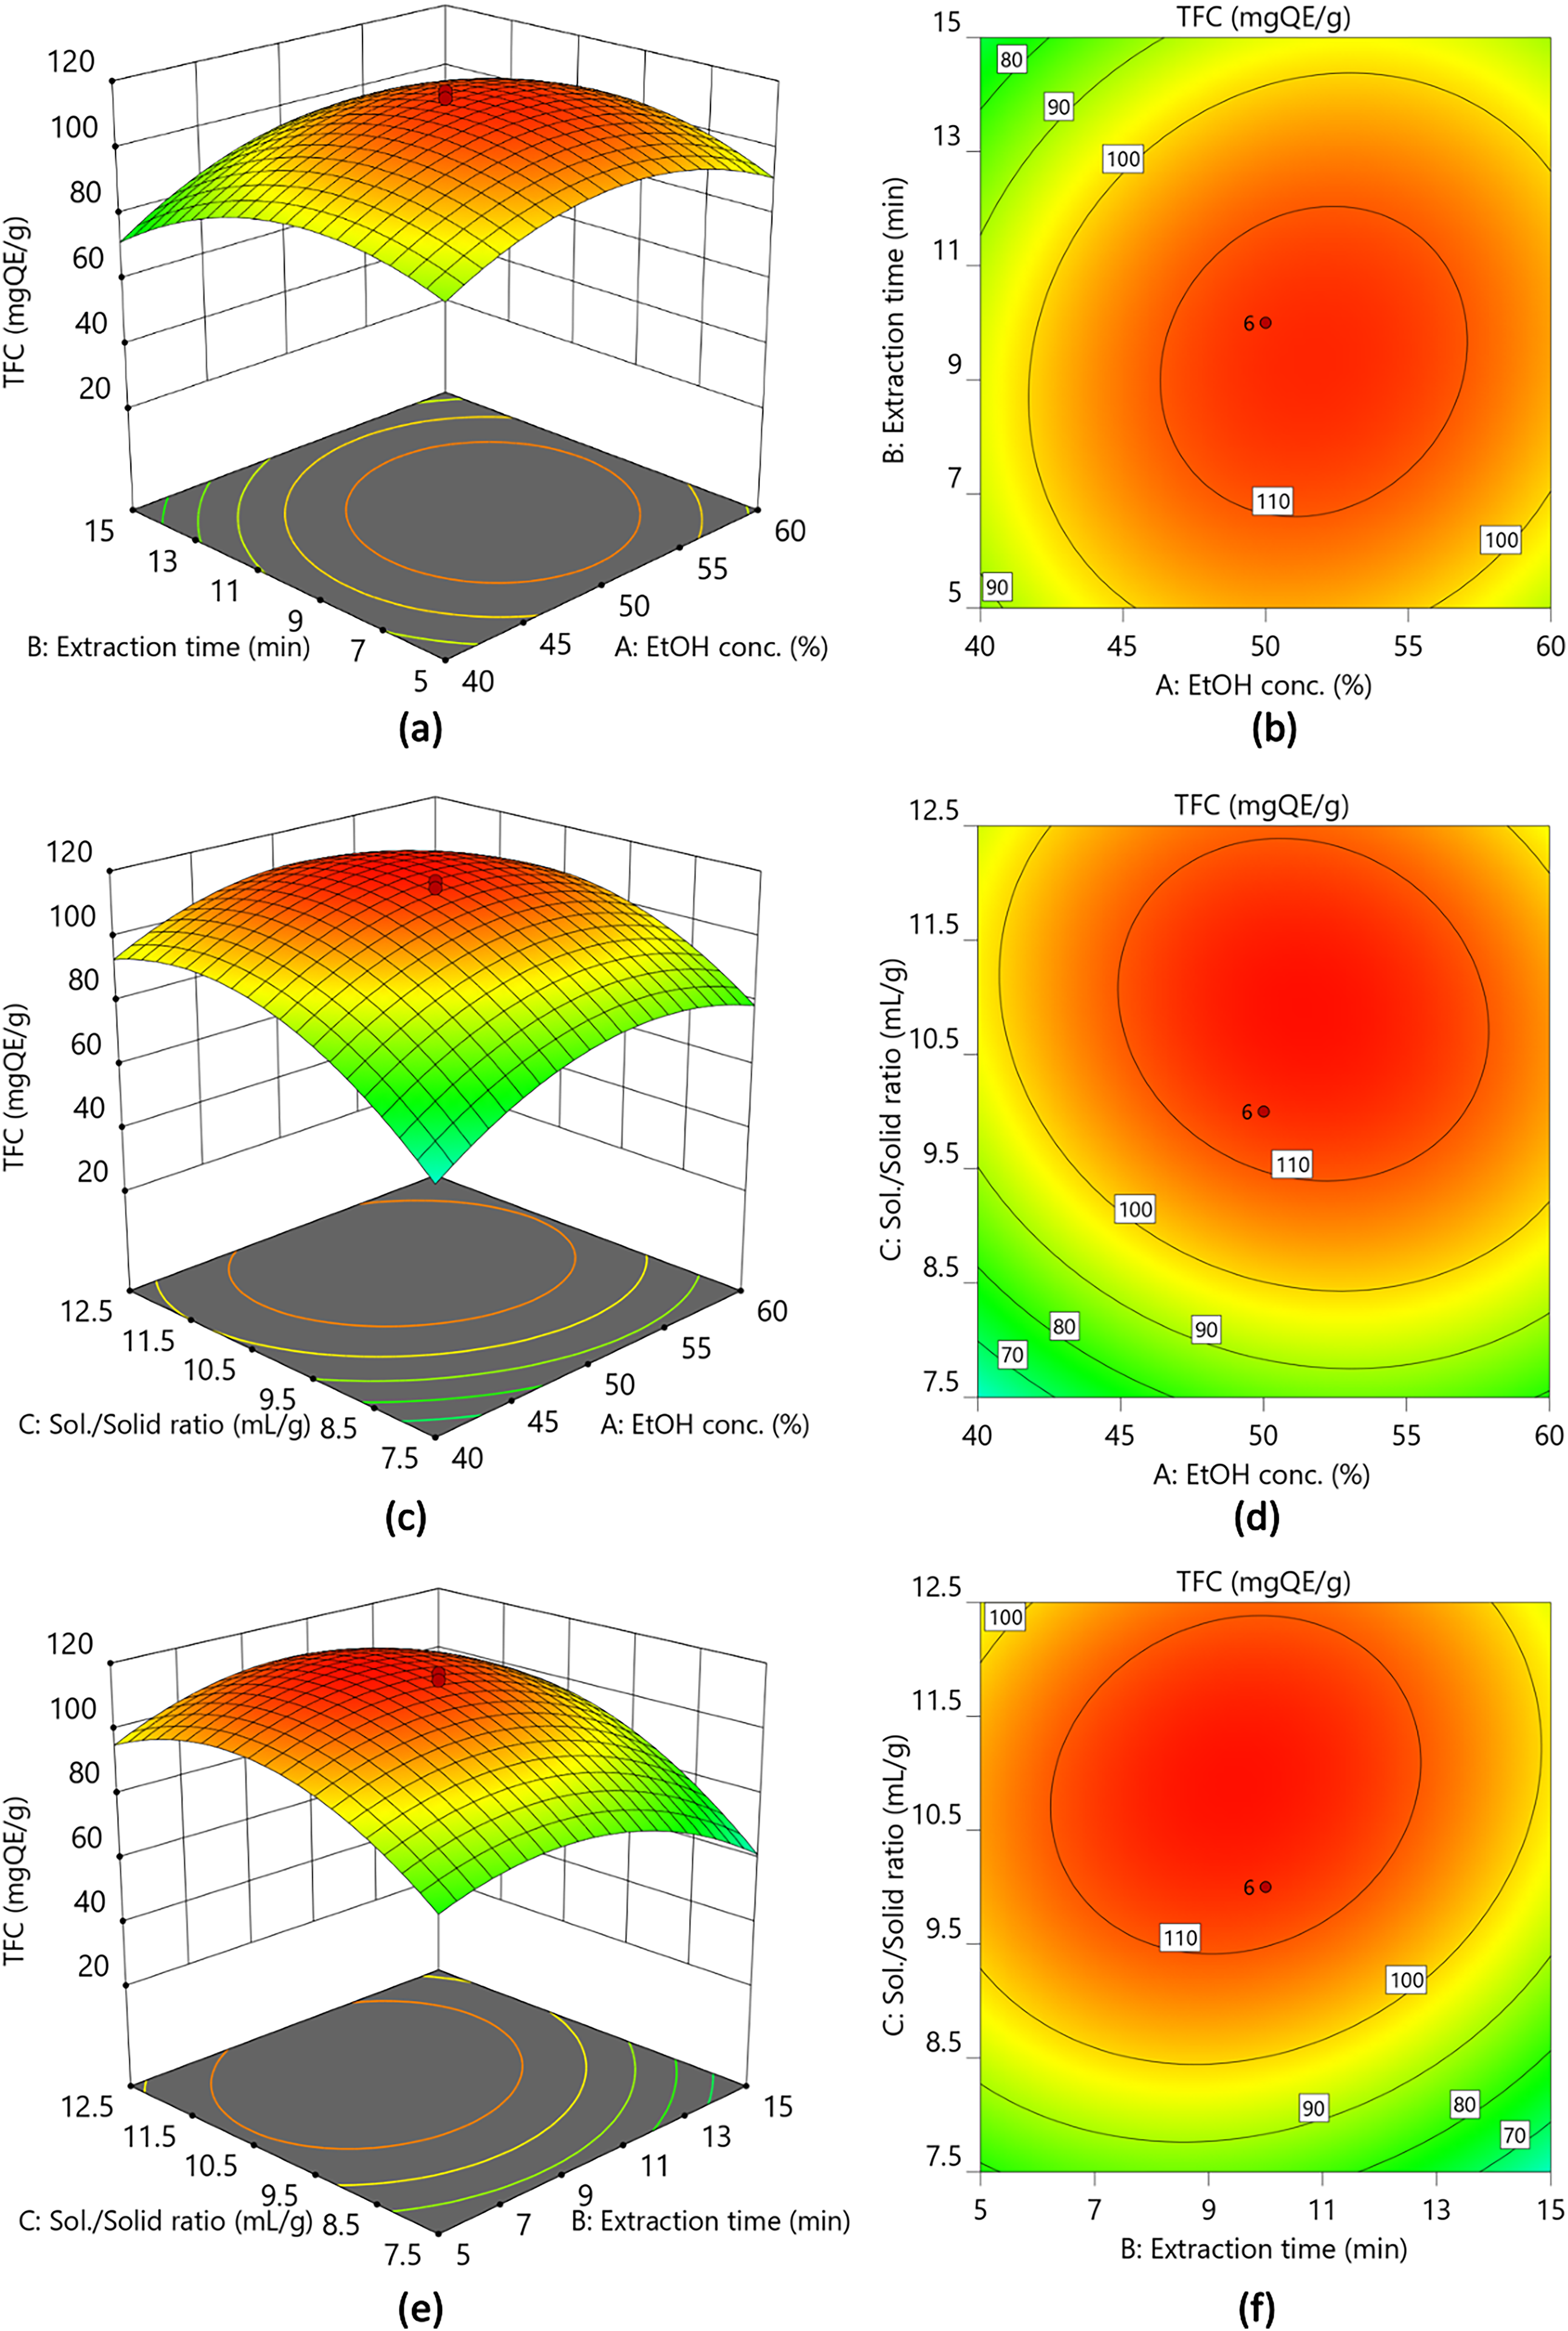
The surface (a, c, e) and contour (b, d, f) plots showing the interactive effect of Ethanol concentration and Extraction time (a & b), Ethanol concentration and Sol./solid ratio (c & d), Extraction time and Sol./solid ratio (e & f) on the Total flavonoid content (TFC) of guajava leaf extract.
Impact of Operational Parameters on Antioxidant and α-Glucosidase Inhibitory Activities
Two in vitro methods, DPPH and ABTS, have been widely used to assess antioxidant activity.
38
The quadratic model used for the assessment was associated with a regression equation, presented in Tables 2 and 3. Table 2 indicated that except linear effect for

The surface (a, c, e) and contour (b, d, f) plots showing the interactive effect of Ethanol concentration and Extraction time (a & b), Ethanol concentration and Sol./solid ratio (c & d), Extraction time and Sol./solid ratio (e & f) on the DPPH radical scavenging activity of guajava leaf extract.
While the ANOVA analysis (Table 2) revealed that the linear effect (

The surface (a, c, e) and contour (b, d, f) plots showing the interactive effect of Ethanol concentration and Extraction time (a & b), Ethanol concentration and Sol./solid ratio (c & d), Extraction time and Sol./solid ratio (e & f) on the ABTS radical scavenging activity of guajava leaf extract.
The results of the fit statistics and ANOVA for α-glucosidase inhibitory activity are presented in Tables 2 and 3. The presence of high F-values (155.93) and small P-values (< .0001) demonstrates the significance of the developed regression models (Table 2). Furthermore, the high
Three-dimensional (3D) response surface plots, based on Equation (

The surface (a, c, e) and contour (b, d, f) plots showing the interactive effect of Ethanol concentration and Extraction time (a & b), Ethanol concentration and Sol./solid ratio (c & d), Extraction time and Sol./solid ratio (e & f) on the α-glucosidase inhibitory activity of guajava leaf extract.
Optimization and Verification of UAE Conditions
To attain an optimal extract yield for polyphenolic and flavonoid compounds, as well as their antioxidant and α-glucosidase inhibitory activities, an UAE method was employed and proved of its efficacy in this study. Three experiment variables were optimized in this study, including ethanol concentration (ranging from 33.18% to 66.82%), extraction time (from 1.59 to 18.41 min), and solvent to solid ratios (ranging from 5.79 to 14.20 mg/mL) (Table 4). The CCD was helpful to determine optimum conditions, which was an equilibrium between these studied parameters, as follows: i) ethanol concentration of 51.94%, ii) a solvent to solid ratio of 10.84 mL/g, and iii) a sonication extraction times of 9.56 min. To reconfirm these optimal conditions, UAE was performed under these estimated optimal conditions for each group of responses. The experimental values were statistically compared to the predicted values, and the results showed that the experimental values fell within the 95% confidence interval for the predicted model (Table 4). These findings confirmed that the model could be used to optimize the UAE of different groups of responses including total polyphenolic and flavonoid contents with DPPH and ABTS radical scavenging, and α-glucosidase inhibitory activities from wild guava leaves.
Experimental Values and Predicted Values of Response Variables at optimum Extraction Conditions. Desirability = 97.7%.

Note: Data are expressed as mean ± standard deviation (SD) (n = 3). TPC: total polyphenol content; TFC: total flavonoid content.
Pearson's Correlation and Principal Component Analysis
It is worth noting that Pearson's correlation analysis provides valuable insights into the relations between variables and can help better understanding the influence of studied factors on the therapeutic potential of wild guava leaf extract. This analysis revealed both significant positive and negative correlations. The results in Figure 6a indicated that TFC had a strongly positive correlation with an r value of 0.95, P < .001, suggesting that the main phenolic components rely mainly on flavonoid compounds. Moreover, TPC and TFC had a high positive correlation with ABTS and DPPH with r values higher than 0.85, P < .001 and exhibited a negative correlation with IC50 value for α-glucosidase inhibitory activity with r value of 0.78 and 0.80, P < .001, respectively. This observation is in lines with previous studies1,2 of Nguyen et al (2023) and Nguyen et al (2022a) for wild guava leaves. In contrast, the extraction conditions showed a non-significant correlation with phenolic components and biological activities, except for solvent-to-solid ratio, which exhibited a weak correlation with ABTS radical scavenging activity (r = 0.46, P < .05). These results indicated that the extraction conditions did not have a linear relation with the extraction efficiency of bioactive compounds from wild guava leaves.

Pearson's correlation matrix (a) and principal component analysis (PCA) (b) among different extracted conditions and biological activities of guava leaf extract.
PCA was performed to identify the influence of extraction conditions on the tested phenolic components and biological activities. Figure 6b presents the correlation between extraction conditions and phenolic components (TPC and TFC) and biological activities, as well as between phenolic components and biological activities. The obtained results showed that most variables were highly correlated with the first dimension, denoting Dim1, explained 88.3% of the total variability, whereas the second dimension, denoted Dim2, explained 6.7% of the total variability. The total components (Dim1 × Dim2) described 95.0% of the total variance of the data and provided a reliable proof of the strong relation between extraction conditions and phenolic components as well as biological activities (r2 = 0.999; P < .001). The PCA score biplot in Figure 6b illustrates that the tested phenolic components, biological activities, and extraction conditions were separated into two distinct clusters without any outlier. Furthermore, Figure 6b indicates that the central points of the extraction conditions were closer to all phenolic contents and biological activities than those of the high and low extraction conditions. This can be attributed to the fact that extract of wild guava leaves prepared with the conditions at the central points displayed higher contents of biological active components than other extraction conditions. The results also showed that the selected range of extraction conditions was suitable for the optimization model. Additionally, the extraction conditions, including ethanol concentration and the solvent-to-solid ratio, were directed towards the positive side of the biplot, which was the most active area and approached the most to the TPC and TFC and antioxidant activity (DPPH and ABTS radical scavenging activities), and negative side of the IC50 value for α-glucosidase inhibitory activity. In contrast, extraction time was distributed on the opposite side of TPC, TFC and antioxidant activity and the same side with the IC50 value for α-glucosidase inhibitory activity, which indicated that sonication extraction time exhibited a low effect on extraction yield of biological active components. Moreover, the direct side of ethanol concentration was the closest to TPC, TFC and antioxidant activity, among the extraction conditions, in the order of DPPH, TFC, ABTS, and TPC, indicating that the ethanol concentration had the highest effect on the extraction yield of biological active components.
Significance and Limitations of the Study
Previous studies conducted by our team have demonstrated that wild guava leaves exhibit higher levels of bioactive compounds possessing antioxidant and antidiabetic properties than other varieties of guava leaves, both domestically and internationally.1,2 As a result, wild guava leaves are considered a promising resource for the development of antioxidant and antidiabetic applications. This study effectively identified the optimal ultrasonic-assisted extraction conditions, including ethanol concentration, solvent-to-solid ratio, and sonication extraction time, to maximize the yield of phenolic and flavonoid compounds from wild Psidium guajava L. leaves. These compounds are associated with substantial antioxidant and alpha-glucosidase-inhibitory activities. The validated models and PCA confirmed the reliability of the extraction process and its potential application in enhancing the bioactive properties of wild guava leaf extract.
The study has some limitations. First, the study was conducted only at a laboratory scale, necessitating larger-scale studies before application in actual production. Secondly, the biological activities of guava leaf extract have only been evaluated using in vitro models, making it essential to assess its biological activities in vivo and in preclinical trials to use wild guava leaf extract as a functional food ingredient and medicinal food.
Conclusion
Developing suitable extraction technology for diverse plant matrices is imperative for the food and pharmaceutical industries. In this study, a CCD using RSM enabled the establishment of an optimal extraction condition by integrating three independent variables: Ethanol concentration (51.94% in distilled water), solvent-to-solid ratio (10.84 mL/g), and sonication extraction time (9.56 min). The mathematical models derived from RSM indicated significant influences of all parameters on the extraction process, with parameters exhibiting linear, quadratic, and interactive effects. Additionally, PCA has also validated the appropriate model to predict the extraction yield of total polyphenol and flavonoid content, as well as their biological activity, including DPPH & ABTS radical scavenging and alpha-glucosidase inhibitory activities. These enhanced extraction processes are crucial for scaling up production to meet the demand for antioxidants and antidiabetics in both the pharmaceutical and food industries. Subsequent research endeavors will focus on further optimization of the process at the pilot scale prior to transitioning to industrial-scale production.
Experimental Section
Chemicals and Reagents
Sodium carbonate, sodium bicarbonate, DPPH, ABTS, Folin–Ciocalteu phenol reagent, α-glucosidase and methanol were from Sigma-Aldrich (St. Louis, MO, USA). Glacial acetic acid and ethanol were provided by Xilong Scientific Co., Ltd (Guangdong Province Shantou City, China). Other reagents met analytical grade.
Sample Preparation
Guava leaves were collected from the forest in M’Drak town, Dak Lak Province, Vietnam in December of 2023. Freshly harvested ones were packed in an enclosed bag and promptly transported to the laboratory in the same day. Upon arrival, the samples were thoroughly washed and then dried in a convection oven at 50 °C until their moisture content reached 8% or less. Subsequently, the dried samples were ground into fine powder and stored in an airtight container at – 20 °C for subsequent analyses.
Ultrasound-Assisted Extraction
The obtained guava powder was dispersed in ethanol for 2 min and subjected to sonication (28 kHz), using a 10-mm micro-tipped probe, being submerged 1 cm (Vietsonic, VS28H, Vietnam). Different experimental conditions were designed and presented in Table 5. The subsequent mixture were centrifuged at 15 000 × g for 15 min, and filtered using Whatman filter paper. The remainings underwent an additional extraction cycle as described above. The resulting extracts were mixed together, and ethanol was filled up to a predetermined volume. The samples were finally stored at – 30 °C for further experiments.
Central Composite Design and variable Combination in Experiments Runs.

Note: *Axial point; cCenter point.
Total Phenolic and Flavonoid Determination
The TPC of extract was quantified using the method previously described by Nguyen and Eun (2011). 23 Indeed, a calibration curve was established, as follows. Aliquots of 0.024, 0.075, 0.105, and 0.3 mg/mL ethanolic gallic acid solutions were mixed with Folin–Ciocalteu reagent (diluted ten-fold) and sodium carbonate solution (75 g/L) at a ratio of 1:5:4 (v/v), respectively. After incubation time of 30 min at 20 °C, the absorption were measured and the calibration curve was established. To quantify the extracts’ TPC, a similar preparation as aforementioned was performed and the absorption were determined. All experiments were triplicated. TPC of the plant extracts was presented as mg of gallic acid equivalents (GAE)/g dry weight (dw).
Flavonoid content was quantified using a previously published method of Nguyen and Eun, (2011) with slight modifications. 23 To be specific, 1 mL of the tested solution was diluted by 1.25 mL of distilled water. 0.075 mL of sodium nitrite solution (5%) was added and incubated for 5 min at 20 °C. Afterwards, 0.15 mL of aluminum chloride (10%) was supplemented. After 6 min of incubation, 0.5 mL of NaOH 1 M was added. The final mixture was diluted with 0.275 ml of distilled water prior to the absorbance measurement at 510 nm. Flavonoid contents were determined based on the standard curve and presented as mg of quercetin equivalents (QE)/g dw.
DPPH Radical Scavenging Properties of Guava Leaf Extracts
DPPH (2,2-diphenyl-2-picrylhydrazyl hydrate) radical scavenging properties was assessed, using a similar method previously described by Nguyen et al (2023). 2 In this protocol, DPPH stock solution was prepared at a concentration of 0.24 g/L (w/v) in methanol and stored at −18 °C prior to the analysis. For working solutions: 1.0 mL of the stock solution was diluted with 45 mL of methanol in order to achieve a final absorbance of 1.1 ± 0.02 at 517 nm. The tested sample was fabricated by adding 0.1 mL of the tested extract into 3.9 mL of working solution, and kept for 30 min in dark. The absorbance of the reacted mixture was determined at 517 nm, using a UV-VIS spectrophotometer (V630, Jasco, Japan). For control and standard, absolute ethanol and Trolox were used, respectively. The guava leaf extracts’ DPPH radical scavenging activity was interpreted as mg Trolox equivalent (TE)/g dw.
ABTS Radical Scavenging Activity
A similar method of Nguyen et al (2023) was used to evaluate the ABTS radical scavenging activity of the guava leaf extract. 2 Briefly, a stock solution was prepared by incubating 7.4 mM ABTS*+ (2,2′-azino-bis (3-ethylbenzothiazoline-6-sulfonic acid)) in 2.6 mM K2S2O at a ratio of 1:1 (v/v) in the dark, for 12 h, at room temperature, and stored at – 18 °C until use. Working solutions were prepared by diluting 1 mL of the stock solution in 60 mL of methanol, to have an absorbance of 1.1 ± 0.02 at 734 nm. For tested samples, 0.15 mL of extracts and 2.85 mL of working solution were thoroughly mixed under stirring and incubated in the dark for 2 h at room temperature. The absorbance of the final solution was measured at 734 nm. Methanol and Trolox were also applied as the control and standard, respectively. The result of ABTS radical scavenging activity was presented as mg TE/g dw.
In-Vitro Assays of the Guava Leaf Extract’ Enzymatic Inhibition Properties
α-glucosidase inhibitory activity was determined using the identical method
24
in the study of Apostolidis et al (2007). In a 96-well plate, 50 μL of extract was incubated with 100 μL of α-glucosidase (1.0 U/mL) in phosphate buffer 0.1 M (pH 6.9), kept at 25 °C for 10 min. Subsequently, 50 μL solution of p-nitrophenyl-α-D-glucopyranoside 5 mM in phosphate buffer 0.1 M (pH 6.9) was added. The obtained solution was incubated at 25 °C for 5 min. The absorbance before and after the lates incubation time was recorded at 405 nm using a microplate reader (Bio-Rad Laboratories, Inc., Hercules, CA, USA) and compared to the control (in replace of extract by buffer). The α-glucosidase inhibitory activity was expressed as inhibition rate (%) and was calculated using the following formula:
Experimental Design
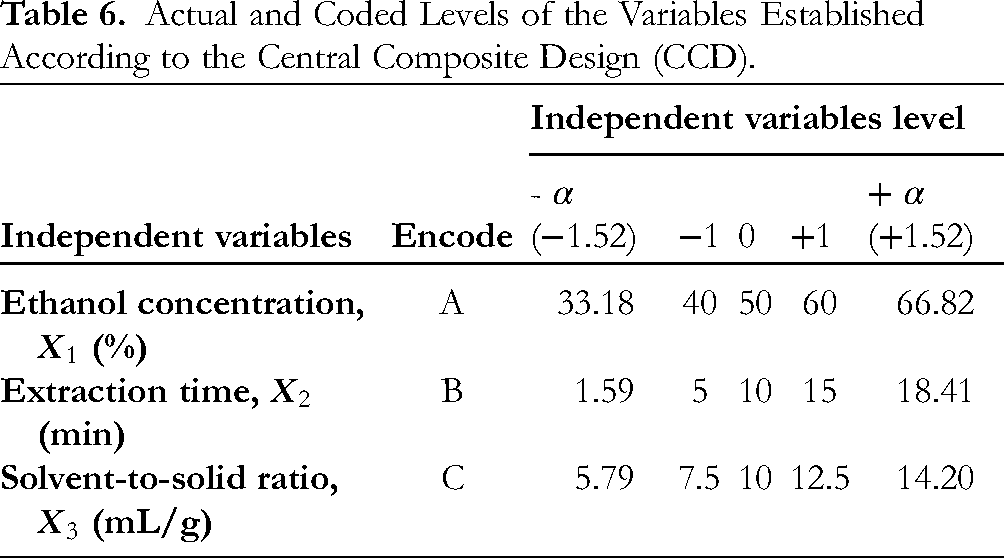
A three-factor, five-levels CCD was performed to optimize extraction conditions, in an attempt to achieve the highest recovery of bioactive compounds from dried guava leaves. Ethanol concentration (
Actual and Coded Levels of the Variables Established According to the Central Composite Design (CCD).
Statistical Analysis
The analysis was conducted in triplicate, and the experimental findings were presented as means with their corresponding standard deviations. Extraction optimization outcomes were assessed using statistical software (Design Expert 12, Stat-Ease Inc., Minneapolis, USA). Experimental data were fitted to a second-order polynomial model, and regression coefficients were derived. The optimization process yielded recommendations for several new formulas deemed optimal by the program. The significance of the mathematical model was validated using analysis of variance (ANOVA), enabling the identification of linear, quadratic, and interaction regression coefficients for each response. Statistical significance of all polynomial terms was assessed by computing the F value at a probability (P value) of .05. The optimal point was determined through the application with the objective of maximizing all responses. The principle component analysis (PCA) was performed using R software version 4.1.2 with the package FactoMineR.
Footnotes
Acknowledgements
This research is partly supported for Ngoc-Dung Dang Thi by Ho Chi Minh City University of Technology and Education (HCMUTE), Vietnam; Institute of Biotechnology and Environment - Tay Nguyen University for providing us with the facilities required to perform this work.
CRediT Authorship Contribution Statement
Data Availability
The original contributions presented in the study are included in the article, further inquiries can be directed to the corresponding author
Declaration of Conflicting Interests
The authors declared no potential conflicts of interest with respect to the research, authorship, and/or publication of this article.
Ethical Approval
This article does not contain any studies with human or animal participants, ethical approval was not required.
Funding
This research is funded by Ministry of Education and Training under grant number of B2024-TTN-02
Statement of Human and Animal Rights
This article does not contain any studies with human or animal subjects.
Statement of Informed Consent
This article does not contain any studies with human or animal subjects