
Abstract
Introduction
The increasing prevalence of cannabinoids in both therapeutic and recreational contexts has spurred a growing demand for hemp-derived cannabinoid products. This demand has led to a surge in suppliers, which, in turn, necessitates a thorough examination of the safety of these products. Despite this growing market, the current regulatory landscape is often insufficient, allowing significant variability in product quality and safety standards.1,2
Hemp-derived cannabinoids such as Δ8-THC, HHC, and Δ9-THCP have gained popularity for their purported therapeutic benefits. However, the safety profiles of these compounds remain underexplored, with most existing studies focusing on their efficacy rather than potential health risks. This gap in knowledge is exacerbated by misconceptions about recreational cannabis use and the complexities of studying cannabinoids, which involve diverse formulations, dosing regimens, and methods of administration.3–7
The unregulated nature of the cannabinoid market further complicates safety assurance. There are no requirements that finished products undergo any kind of safety or purity testing before hitting shelves – they simply must adhere to the pre-determined levels of known contaminants that third party labs test for. This minimalistic approach to testing overlooks uncommon contaminants, particularly those that may pose risks when inhaled. The interaction between cannabinoids and pulmonary immune function, for instance, is complex and not fully understood, making it crucial to study the effects of these compounds on lung cells.3,8–14 Additionally, potential liver toxicity from ingested cannabinoids is another area requiring close examination.
This study focuses on Δ8-THC, HHC, and Δ9-THCP due to their distinct chemical properties, increasing popularity, and ease of availability. Δ8-THC is an isomer of Δ9-THC with reported adverse effects in consumers, while HHC is a hydrogenated derivative of THC, marketed as a legal alternative but lacking comprehensive safety data.15–18 Δ9-THCP, distinguished by its seven-carbon side chain, exhibits higher potency than traditional THC, raising questions about its safety and appropriate dosing. To address these concerns, this study includes synthesis of these major cannabinoids and their characterization by high-performance liquid chromatography (HPLC). The authors synthesized six of the 24 samples that underwent characterization; the other 18 were donated from three different vendors. Each vendor donated high and low potency samples of each major cannabinoid.
In vitro assessments on lung and liver cell lines were also performed in an effort to simulate cannabinoid absorption during inhalation and oral consumption, giving a measure of respiratory and hepatic impact.19–27 Each of the 24 samples mentioned previously underwent this cell viability assay, in addition to four samples that consisted of 30:70 Cannabinol (CBN):HHC, 50:50 CBN:HHC, 75:25 CBN:HHC, and CBN. This research aims to fill the existing gaps in cannabinoid safety knowledge, providing essential insights that can guide the development of robust safety standards in the evolving landscape of cannabinoid-based products. 28
Methods
Cannabinoid Synthesis
Nuclear magnetic resonance (NMR) was employed to confirm synthesis completion. Compounds were dissolved in chloroform (CDCl3), and 1H and 13C data were acquired on a 500 MHz Bruker AVANCE II system at 25 °C. 1H and 13C data sets were analyzed to yield complete 1H and 13C peak assignments. Deuterated solvents were purchased from Cambridge Isotope Laboratories (Andover, MA). A reagent list for the cell viability assays is listed in SI Figure 1. Cannabidiol (CBD) was purchased from GVB Biopharma, Oregon, and was converted to Δ8-THC29,30 and HHC 30 Including samples gathered from third parties and were relabeled as WC compounds.
Synthesis of D8 THC
To a round bottom flask equipped with a magnetic stir bar, CBD (5 g, 15.91 mmol, 1 equiv.) was added. Hexane (10 mL) was added. Para-toluene sulfonic acid-hexahydrate (0.151 g, 0.08 equiv) was added and the reaction stirred until the reaction was completed by HPLC. Upon completion, the reaction mixture was washed with water. Following the wash, the organic layer was separated. This was repeated with washes of brine and sodium bicarbonate. After the washes are complete, the mixture is concentrated in vacuo and yields a mixture of Δ8 and Δ9 THC as a red oil. At this point the oil was split into 2 fractions. One was purified via distillation and matched literature spectroscopy.29,30 The other was labeled as low-potency Δ8-THC and was used without further purification for these studies.
Distilled Δ8-THC
HPLC (C18): 10.005 min, 1H NMR (400 MHz, CDCl3) δ 6.28 (d, J = 1.6 Hz, 1H), 6.11 (d, J = 1.6 Hz, 1H), 5.43 (ddt, J = 5.4, 2.5, 1.3 Hz, 1H), 4.72 (s, 1H), 3.24-3.14 (m, 1H), 2.70 (td, J = 10.8, 4.6 Hz, 1H), 2.44 (td, J = 7.5, 2.4 Hz, 2H), 2.21-2.07 (m, 1H), 1.81 (tdd, J = 9.4, 3.0, 1.4 Hz, 1H), 1.77-1.65 (m, 3H), 1.60-1.49 (m, 2H), 1.38 (s, 3H), 1.34-1.27 (m, 4H), 1.11 (s, 3H), 0.95-0.82 (m, 3H). 13C NMR (101 MHz, CDCl3) δ 155.06, 154.95, 142.93, 134.96, 119.54, 110.73, 110.34, 107.84, 77.44, 76.88, 45.10, 36.24, 35.93, 35.65, 31.78, 30.99, 30.81, 28.11, 27.79, 23.71, 22.76, 18.71, 14.24
Crude Δ8 THC
HPLC (C18): 9.729 min, 1H NMR (400 MHz, CDCl3) δ 6.28 (d, J = 1.6 Hz, 1H), 6.11 (d, J = 1.6 Hz, 1H), 5.43 (dh, J = 5.3, 1.3 Hz, 1H), 4.71 (s, 1H), 3.19 (dd, J = 15.7, 4.5 Hz, 1H), 2.70 (td, J = 10.8, 4.6 Hz, 1H), 2.44 (td, J = 7.5, 2.5 Hz, 2H), 2.21-2.07 (m, 1H), 1.94-1.75 (m, 1H), 1.74-1.65 (m, 3H), 1.59-1.54 (m, 2H), 1.38 (s, 3H), 1.34-1.28 (m, 3H), 1.11 (s, 3H), 0.95-0.83 (m, 3H).13C NMR (101 MHz, CDCl3) δ 155.06, 154.95, 142.93, 134.96, 119.54, 110.72, 110.34, 108.31, 107.83, 106.61, 77.43, 76.87, 74.54, 45.09, 37.27, 36.23, 35.91, 35.65, 31.78, 30.98, 30.81, 30.20, 29.01, 28.10, 27.79, 23.70, 23.21, 22.76, 20.18, 18.71, 14.23.
Synthesis of HHC
To a round bottom flask equipped with a magnetic stir bar, a mixture of Δ8 and Δ9-THC (5 g, 15.91 mmol, 1 equiv.) was added and dissolved in ethanol (50 mL) followed by a purge with argon. Palladium on carbon (0.1 molar %) was added slowly under argon. An atmosphere of hydrogen (1 bar) was added, and the reaction stirred at 25 °C for 1 h. Upon completion, the reaction mixture was purged with argon for 5 min at 1 bar. The reaction mixture was poured over 1-3-micron filter paper on a Buchner funnel and then concentrated in vacuo. At this point the oil was split into 2 fractions. One was purified via distillation and matched literature spectroscopy [301. The other was labeled as low-potency HHC and was used without further purification for these studies.
Distilled HHC
HPLC (C18): 7.093, 7.242 min, 1H NMR (400 MHz, CDCl3) δ 6.30-6.21 (m, 1H), 6.07 (dd, J = 2.8, 1.7 Hz, 1H), 4.77 (d, J = 31.6 Hz, 1H), 3.14-2.76 (m, 1H), 2.52-2.35 (m, 3H), 1.91-1.75 (m, 1H), 1.42-1.32 (m, 3H), 1.31 (s, 4H), 1.21-1.09 (m, 2H), 0.95 (d, J = 6.6 Hz, 2H), 0.91-0.86 (m, 3H), 0.85-0.73 (m, 1H). 13C NMR (101 MHz, CDCl3) δ 155.35, 155.11, 154.87, 154.80, 142.74, 142.65, 110.67, 110.49, 110.20, 110.18, 107.85, 77.20, 77.09, 50.40, 50.11, 49.32, 39.17, 36.33, 35.80, 35.72, 35.60, 33.03, 32.42, 31.86, 31.79, 31.77, 30.77, 29.68, 29.51, 28.25, 28.07, 27.93, 27.76, 23.27, 22.79, 22.74, 19.31, 19.23, 18.99, 14.22.
Crude HHC
HPLC (C18): 7.112, 7.261 min, 1H NMR (400 MHz, CDCl3) δ 6.25 (t, J = 1.7 Hz, 1H), 6.07 (dd, J = 3.1, 1.7 Hz, 1H), 4.65 (d, J = 26.7 Hz, 1H), 2.95 (ddtd, J = 65.1, 13.1, 3.2, 1.6 Hz, 1H), 2.42 (td, J = 7.4, 2.0 Hz, 2H), 1.85 (ddd, J = 11.2, 4.9, 2.4 Hz, 1H), 1.67-1.51 (m, 2H), 1.36 (d, J = 2.5 Hz, 3H), 1.35-1.27 (m, 4H), 1.16-1.11 (m, 1H), 1.08 (d, J = 7.5 Hz, 3H), 0.94 (d, J = 6.6 Hz, 2H), 0.92-0.86 (m, 3H). 13C NMR (101 MHz, CDCl3) δ 155.39, 155.16, 154.85, 154.77, 142.75, 142.66, 110.65, 110.47, 110.24, 110.22, 107.81, 77.42, 77.17, 77.05, 50.11, 49.32, 39.18, 36.35, 35.80, 35.73, 35.60, 33.05, 32.42, 31.79, 31.77, 30.78, 29.50, 28.99, 28.26, 28.07, 27.95, 27.78, 23.28, 22.94, 22.79, 22.75, 19.32, 19.24, 19.00, 14.22.
Synthesis of Δ9-THCP
Cannabidiphorol (CBDP) (5 g, 14.59 mmol, 1 equiv.) was dissolved in dichloromethane and added to a flame dried round bottom flask equipped with a magnetic stir bar. Triethylaluminum (1.46 mmol, 0.1 equiv) was added and the reaction stirred at 25 °C until complete by HPLC. Upon completion, the reaction mixture was washed with water. The organic phase is removed and then dried with sodium sulfate. The mixture is poured over a 1-3-micron filter paper on a Buchner funnel and then concentrated in vacuo. At this point the oil was split into 2 fractions. One was purified via distillation and matched literature spectroscopy. 26 The other was labeled as low-potency Δ9-THCP and was used without further purification for these studies.
Distilled Δ9-THCP
HPLC (C18): 8.531 min, 1H NMR (400 MHz, CDCl3) δ 6.35 (p, J = 1.7 Hz, 1H), 6.33-6.23 (m, 1H), 6.15 (d, J = 1.7 Hz, 1H), 5.23 (s, 1H), 3.23 (dp, J = 10.6, 2.5 Hz, 1H), 2.44 (tt, J = 7.2, 3.7 Hz, 2H), 2.22-2.13 (m, 2H), 2.01-1.87 (m, 1H), 1.79-1.63 (m, 4H), 1.61-1.49 (m, 1H), 1.43 (s, 3H), 1.44-1.32 (m, 1H), 1.35-1.21 (m, 10H), 1.11 (s, 2H), 0.95-0.85 (m, 3H). 13C NMR (101 MHz, CDCl3) δ 154.96, 154.38, 154.04, 143.03, 142.65, 135.17, 134.57, 123.96, 122.21, 119.53, 110.95, 110.27, 110.18, 109.64, 109.24, 108.20, 107.76, 77.41, 76.39, 46.50, 46.01, 40.27, 36.23, 35.98, 35.73, 35.65, 33.78, 32.00, 31.78, 31.71, 31.37, 31.18, 31.10, 29.98, 29.57, 29.51, 29.45, 29.39, 29.37, 28.10, 27.77, 27.31, 26.13, 25.52, 25.23, 23.88, 23.58, 22.88, 20.89, 19.47, 14.31.
Crude Δ9-THCP
HPLC (C18): 8.531 min, 1H NMR (400 MHz, CDCl3) δ 6.31 (p, J = 1.7 Hz, 1H), 6.30-6.19 (m, 1H), 6.17-6.08 (m, 1H), 4.89 (s, 1H), 3.20 (dp, J = 10.6, 2.5 Hz, 1H), 2.43 (td, J = 7.2, 1.6 Hz, 3H), 2.21-2.12 (m, 2H), 1.99-1.85 (m, 1H), 1.83-1.68 (m, 1H), 1.72-1.62 (m, 5H), 1.62-1.49 (m, 3H), 1.42 (s, 3H), 1.48-1.33 (m, 2H), 1.37-1.18 (m, 13H), 1.09 (s, 3H), 1.13-0.94 (m, 1H), 0.94-0.84 (m, 4H). 13C NMR (101 MHz, CDCl3) δ 154.93, 154.38, 143.00, 134.52, 123.95, 122.20, 110.96, 110.24, 110.14, 109.23, 108.20, 108.04, 107.76, 106.23, 77.41, 45.99, 43.22, 43.13, 40.25, 37.85, 35.71, 33.77, 31.99, 31.77, 31.36, 31.29, 31.16, 30.70, 29.96, 29.61, 29.56, 29.50, 29.38, 28.08, 27.75, 26.11, 25.49, 25.21, 23.86, 23.56, 22.87, 21.25, 20.87, 19.46, 19.19, 14.30.
Characterization
High-performance liquid chromatography (HPLC) was employed to characterize samples, determine potencies, and identify known byproducts. The instrument was an Agilent 1100 series with diode array detector and an RPC18 Shimadzu Next Leaf CBX for Potency (150 × 4.6 mm). The method utilized acetonitrile and water buffered with 0.1% formic acid as mobile phases, and samples were prepared at a 20x dilution. Cannabinoid certified reference materials were purchased from Cayman Chemical Company, (Ann Arbor, MI) and utilized as references for HPLC data collection. Solvents were purchased from Sigma Aldrich (Burlington, MA).
Cell Viability Assays
Cell viability assays were conducted and assessed by HD Biosciences, with no actual performance of the assay conducted by authors. Compounds 7-12 were donated from Jonesing Labs in Denver, CO and shipped to HD Biosciences without further modification. Compounds 13-18 were purchased from a third-party vendor and shipped to HD Biosciences without further modification. Compounds 19-24 were donated from Arvida Labs in Fort Lauderdale, FL and shipped to HD Biosciences without further modification. Each sample was tested against transformed human liver epithelial-3 (THLE-3) cells to assess hepatic impact, and against human small airway epithelial cells (HSAEC) and human lung fibroblasts (HLF) to assess respiratory impact.
Cell Revival and Propagation
Frozen cells in a cryovial were thawed by a brief incubation in a 37 °C water bath. Cells were transferred into a 15 mL conical tube and 10 mL fresh medium were added to the cells. Cells were centrifuged at 1000 rpm for 5 min. Supernatant was then discarded, and cell pellet was resuspended in complete medium.
Cell viability was evaluated by trypan blue exclusion using the ViCell cell counter (Perkin-Elmer, XR model, serial number # BA49495).
Cells were cultured in culture flasks placed in a 5% CO2 incubator at 37 °C.
Cells were sub-cultured once cell confluency reached 80% to 90%. Culture medium was removed, and cell monolayer was washed with 10 mL of Ca+2/Mg+2-free phosphate buffered saline (PBS). The wash solution was replaced with 5 mL TrypLETM solution, and cells were incubated for 2 to 5 min at 37 °C until cells detached from the culture flask. Five mL of trypsin neutralizer solution was then added to the trypsin, and cells were pipetted up and down until a single cell suspension was obtained. Cells were spun down at 1000 rpm for 5 min, and cell pellet was re-suspended in complete growth medium. Cell viability was evaluated as described above, and cells were cultured in a new tissue culture flask at desired cell density.
For THLE-3 cells only, the tissue culture flasks or assay plates were pre-coated with 0.01 mg/mL fibronectin, 0.03 mg/mL bovine collagen type I and 0.01 mg/mL bovine serum albumin overnight at 37 °C and the coated reagents were removed prior to use.
Cell Seeding
When cells reached 90% confluence, they were washed with 10 mL of PBS, and then 5 mL of TrypLETM solution was added to the cell culture flasks. The flasks were then incubated at 37 °C until the cells detached from the culture flasks, after which 5 mL of Trypsin neutralizer solution was added to stop the reaction. Following a brief centrifugation at 1000 rpm for 1 min, the supernatant was removed, and the cells were re-suspended in 10 mL of fresh culture medium. Cell viability and number were determined using a Vi-Cell counter, and an appropriate amount of cells was seeded into assay plates (Corning 3903) accordingly.
Based on the cell seeding density result as shown in SI Figure 2, the condition of 5000 cells/well was used for THLE-3 and HSAEC cells and the condition of 1000 cells/well was employed for HLF cells for the following compound testing.
Compound Administration
24 h after cell seeding, reference and testing compounds were administered using the Tecan D300e liquid handler with a top dosage of 50 µM, followed by subsequent 1:2 dilutions to achieve a total of 5 concentration points.
CellTiter-Glo® Assays
50 µL of Promega CellTiter-Glo® 2.0 Cell Viability Assay reagents were dispensed into each well. Following a brief centrifugation at 1000 rpm for 1 min, the plates were shaken at 300 rpm for 3 min on a horizontal shaking platform. Subsequently, the plates were incubated at room temperature for 10 min and were then ready for reading using the Perkin Elmer Envision. The plates were set up as shown in SI Figure 3.
Cell Viability Assay Using Lung Derived Cell Lines
HLF Cells
Fibroblast Growth Kit-Low serum (ATCC® PCS-201-041™) are added to Fibroblast Basal Medium (ATCC® PCS-201-030™). Fibroblast Growth Kit-Low Serum contains: recombinant human fibroblast growth factor b, 0.5 mL, 5 ng/mL; L-glutamine, 18.75 mL, 7.5 mM; Ascorbic acid, 0.5 mL, 50 µg/mL; Hydrocortisone Hemisuccinate, 0.5 mL, 1 µg/mL; rh Insulin, 0.5 mL, 5 µg/mL; Fetal Bovine Serum, 10.0 mL, 2%.
HSAEC Cells
Bronchial Epithelial Growth Kit (ATCC PCS-300-040) are added to Airway Cell Basal Medium (ATCC® PCS-300-030 ™). The Bronchial Epithelial Growth Kit contains: HLL Supplement, 1.25 mL (Final concentration HSA 500 mg/mL, Linoleic Acid 0.6 mM, Lecithin 0.6 mg/mL); L-Glutamine, 15 mL (Final concentration 6 mM); Extract P, 2.0 mL (Final concentration 0.4%); Airway Epithelial Cell Supplement, 5.0 mL (Final concentration Epinephrine 1.0 mM, Transferrin 5 mg/mL, T3 10 nM, Hydrocortisone 5 mg/mL, rh EGF 5 ng/mL, rh Insulin 5 mg/mL).
Cell Viability Assay Using Plated Human Hepatocytes
THLE-3 Cells
BEGM from Lonza/Clonetics Corporation, Walkersville, MD 21793 (BEGM Bullet Kit; CC3170). The kit includes 500 mL basal medium and separate frozen additives from which we discard the gentamycin/ Amphotericin (GA) and Epinephrine and to which we add extra 5 ng/mL EGF, 70 ng/mL Phosphoethanolamine and 10% FBS.
Data Analysis
Plate quality control was determined by Z prime score (Z’)

Statistical Analysis
Z-prime values were calculated for the varying cell viability assays to assess both instrument and assay quality. The z-prime values of the plates ranged from 0.69-0.96, with a z-prime value of ≥0.5 denoting an excellent assay. Z-prime data is available in SI-20.
IC50 Calculation
Dose response curves with reference and testing compounds in all three cell lines were fitted using XLfit with dose response one site 205 model (four parameter logistic model). Relative and absolute IC50 values were calculated based on the curve fitting.
Results
The authors synthesized Δ8-THC, HHC, and Δ9-THCP according to literature procedures, and purchased multiple samples produced by various hemp companies. The samples were classified considering the major cannabinoids present in them such asΔ8-THC, HHC, and Δ9-THCP, and whether they were low- or high-potency based off the AUC from the gathered spectra. Figure S22 and Figure S23 further explain the data seen from Figure 1 based on the potency and area of quantifiable compounds found in the samples. Figure 2 depicts the IC50 values from each cell line.

(A) HPLC chromatograms for Δ8-THC samples. (B) HPLC chromatograms for Δ9-THCP samples. (C) HPLC chromatograms for HHC samples.

Chlorpromazine and terfenadine control values are an average of 10 tested samples. The control sample for each cell line is the first-listed compound of interest. The graphs represent the tested and generated IC50 values of various compounds on specific cell lines. HSAEC, HLF, and THLE-3.
WC-3,9,21 were determined to be low potency HHC samples, while WC-4,10,15,16,22 were determined to be high potency HHC samples. WC-1,7,13,19 were low potency Δ8-THC samples, while WC-2,8,14,20 were high potency Δ8-THC samples. WC-5,11,18,23 were low potency Δ9-THCP samples, while WC-6,12,17,24 were high potency Δ9-THCP samples. WC-25,26,27,28 were 30:70 CBN:HHC, 50:50 CBN:HHC, 75:25 CBN:HHC, and CBN, respectively.
All compounds tested on the THLE-3 cell line returned IC50 values above the toxic control, terfenadine, indicating that they are non-toxic at the dosed levels to the tested cells. No discernible pattern was identified when comparing IC50 values of the high- or low-potency samples for any of the cannabinoids. WC-16, a high-potency HHC sample, was an outlier, with an IC50 value almost 17x greater than the control's IC50 value. Although the tested compounds were not toxic to the liver cell line at the concentration doses, the outlier WC-16 did not have as many contaminants as the other hemp products, which could contribute to the increased reduction of toxicity the compound induces. Adding subtle nuances that some contaminants could cause or increase toxicity toward the cells.
All of the compounds tested on the HSAEC line returned IC50 values below the toxic control, chlorpromazine, indicating that they are toxic to the cells. No discernible pattern was identified when comparing IC50 values of the high- or low-potency samples for any of the cannabinoids. WC-16, a high-potency HHC sample, was again an outlier, with an IC50 value of 7.38 µM – though it was still below the control, which had an IC50 value of 13.07 µM. WC-21, a low-potency HHC sample, has the lowest IC50 value of the entire series at 1.48 µM. WC-5 and WC-6, low- and high-potency Δ9-THCP samples respectively, had IC50 values less than 3 µM, while the other Δ9-THCP samples had IC50 values above 3 µM. all compounds were generally toxic to the HSAEC cell line establishing a need for further studies towards the type of cell, found within the lungs.
All but one of the compounds tested on the HLF cell line returned IC50 values below the toxic control, chlorpromazine, indicating that they are toxic to the cells. WC-16, a high-potency HHC sample, was the only compound with an IC50 value greater than the control. The control returned an IC50 value of 14.22 µM, while WC-16 returned an IC50 value of 18.35 µM. On the other hand, WC-9, a low-potency HHC sample, had the lowest IC50 value of the series at 4.14 µM. Within the HLF cell line, all compounds exhibited cytotoxicity, dictating much needed future studies to determine effects of the compounds. Although high potency HHC with fewer contaminants was the outlier, the fewer contaminants can provide a plausible reason for reduced cytotoxicity.
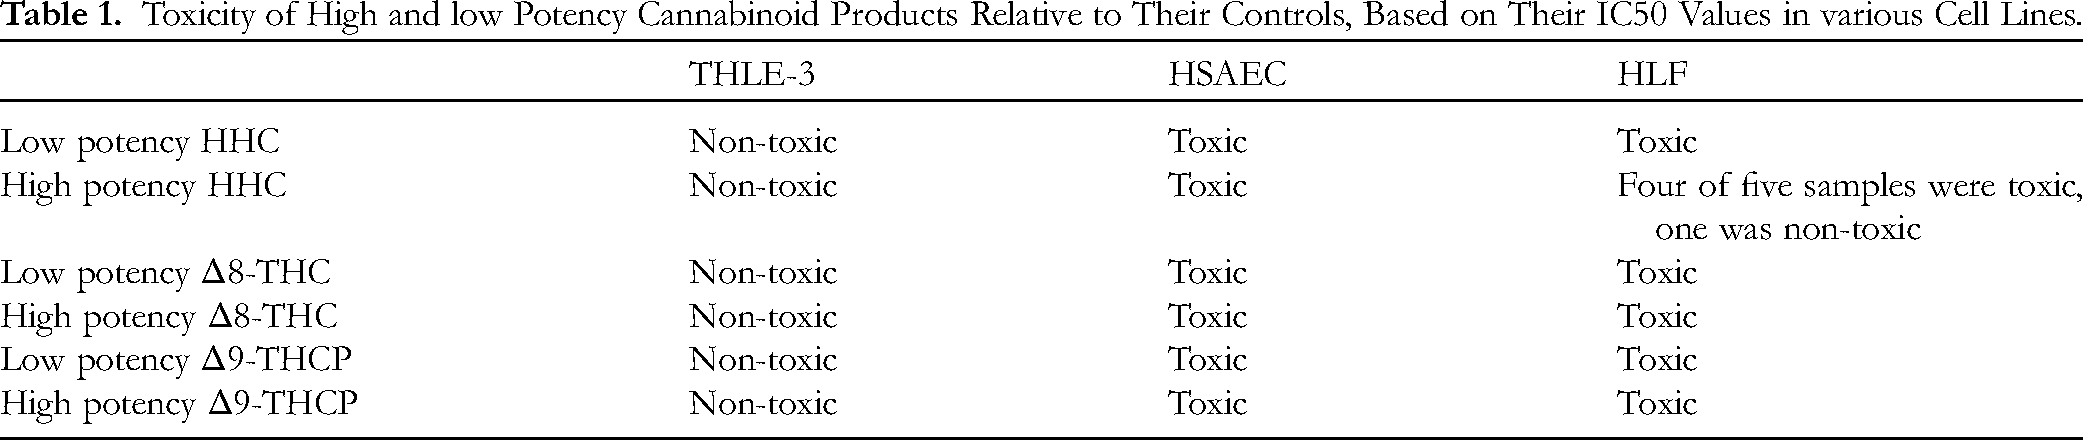
With IC50 values below the control limits representing toxicity, and IC50 values above the control limits representing non-toxicity, results from the cell viability assays are summarized in Table 1.
Toxicity of High and low Potency Cannabinoid Products Relative to Their Controls, Based on Their IC50 Values in various Cell Lines.
Z-prime values were calculated for the varying cell viability assays to assess both instrument and assay quality. The z-prime values of the plates ranged from 0.69-0.96, with a z-prime value of ≥0.5 denoting an excellent assay. Z-prime data is available in SI-20.
Discussion
Δ8-THC and Δ9-THCP are synthetically obtained through intramolecular cyclization of CBD and CBDP in the presence of an acid and solvent. During this reaction, different THC isomers are generated, as shown in Figure 3. On the other hand, HHC is obtained via hydrogenation of Δ9-THC or Δ8-THC. These isomers are found in THC commercial products.

The in vitro data did not indicate that low- and high-potency cannabinoid products would differ in their toxicity to lung or liver cells. None of the compounds were toxic to the THLE-3 line, while all of the compounds were toxic to both the HLF and HSAEC lines, with the exception of WC-16, a high-potency HHC sample, in the HLF cell line. WC-16 was also an outlier in the other two cell lines. It had no common contaminant shared with the other samples tested. All other samples shared common minor cannabinoid contaminants. The contaminants found within WC-16 could be causing a protective or null effect, reducing cytotoxicity of the sample to the tested cell lines. Further investigations are being actively conducted, and further characterization is needed to identify whether cannabinoid contaminants can be helpful or therapeutic, in the sense that they may exhibit protective effects or lessen the effects of the tested major cannabinoids’ toxicity. 32
This study has potential limitations. Both the HSAEC and the HLF cells were chosen to simulate smoking, mimicking the possible interactions that the compounds might impose when absorbed through the upper respiratory tract. The THLE-3 cells were chosen to simulate oral consumption, mimicking the possible implications that the compounds might impose on the liver. Testing various other cells would diversify screening. All statistical limits were tested on cells seeded with proper cell density and run in triplicate at various concentrations. SI Figures 20 and 21 are statistical analyses of the plated cells with varied concentrations, and IC50 values generated from study, respectively. Further experimentation is needed to identify the impact of cannabinoid potency. Our group plans to run experiments using in vivo methodology (lab-on-a-chip, rat model, etc) to see the impact of varying potency on lung and liver models.
Conclusion
This research underscores the critical need for rigorous scientific inquiry into the safety profile of various cannabinoids, including the identification of a myriad of byproducts that result from the synthesis process, and the safety testing that both consumer-ready products and individual contaminants need to undergo.
This inquiry highlights the complexities surrounding cannabinoid safety, emphasizing the importance of considering the possible impurities in the cannabinoid products and how they affect the toxicity of these compounds in a biological system. The presence of understudied cannabinoid contaminants represent a potential risk to users due to their lack of thorough pharmacological characterization. This lack of understanding could lead to unforeseen levels of intoxication and underscores the importance of further research into these compounds’ effects.
Moving forward, continued scientific investigation is imperative to ensure the safe and responsible utilization of hemp derived cannabinoids for medicinal and recreational purposes, while mitigating potential risks to individual and public health, as limited studies are available with more to be conducted in the future.
Supplemental Material
sj-docx-1-npx-10.1177_1934578X241299497 - Supplemental material for The Impact of Hemp Derived Cannabinoid Potency from Consumer Product Goods on in vitro Lung and Liver Cells
Supplemental material, sj-docx-1-npx-10.1177_1934578X241299497 for The Impact of Hemp Derived Cannabinoid Potency from Consumer Product Goods on in vitro Lung and Liver Cells by Giovanni A. Ramirez, Maite L. Docampo-Palacios, Tesfay T. Tesfatsion, Monica K. Pittiglio, Kyle P. Ray and Westley Cruces in Natural Product Communications
Footnotes
Abbreviations
Acknowledgements
Authors gratefully acknowledge NMR spectroscopy support from Dr Jin Hong at Custom NMR Services, Inc. from Woburn, MA. K.P.R. and W.C. would also like to acknowledge donations from both Jonesing Labs in Wheat Ridge, CO and Arvida Labs in Fort Lauderdale, FL.
Author Confirmation
All authors have read and approved this manuscript for submission.
Funding
The authors received no financial support for the research, authorship, and/or publication of this article.
Ethical Approval
Ethical Approval is not applicable for this article.
Statement of Human and Animal Rights
This article does not contain any studies with human or animal subjects.
Statement of Informed Consent
There are no human subjects in this article and informed consent is not applicable.
Statement of Conflict of Interest
MLD, GAR, TTT, and MKP are employees of Colorado Chromatography Labs. WC and KPR are founders of Colorado Chromatography Labs.
Supplemental Material
Supplemental material for this article is available online.
References
Supplementary Material
Please find the following supplemental material available below.
For Open Access articles published under a Creative Commons License, all supplemental material carries the same license as the article it is associated with.
For non-Open Access articles published, all supplemental material carries a non-exclusive license, and permission requests for re-use of supplemental material or any part of supplemental material shall be sent directly to the copyright owner as specified in the copyright notice associated with the article.