
Abstract
Introduction
The use of medicinal plants in preventing and treating diseases is as long as human history is known. In the last few decades, there has been a great tendency and willingness toward natural therapies in both developed and developing countries, and they are being used by 80% of the developing world population. Their uses are based on ancestral habits and are culturally rooted.1,2
Walnut (Juglans regia Linn) is a medically essential plant belonging to the Juglandaceae family. It is initially found throughout the regions of South-Eastern Europe down to the Himalayas, but historical references date back to Persia in 7000 BC. However, walnuts native to America also exist, the Eastern black walnut (Juglans nigra). However, the first cultivation of walnuts was done by the ancient Greeks, who used them for food and medicine. 3 All different parts of the walnut tree have been used traditionally owing to their high contents of bioactive compounds. The kernel part of the walnut is the most valuable because it's edible, and its oil can be used in pharmaceutics and cosmetics. Walnut tree leaves, bark, branches, seed coats, flowers, and nutshells have been used in folk medicine for a long time.4,5
The health benefits of walnut bioactive components have been studied extensively and have many critical biological functions, such as antioxidant, anti-diabetic, anti-hypertensive, lipid-lowering, antibacterial, and antifungal activities. One of the most widely studied aspects is brain health, so many studies have proved their importance in learning and memory processes in rats, owing to their antioxidant, anti-inflammatory, and anti-ageing potentials. 6 These properties can be significantly attributed to their high content of n-3 PUFA, which is the main component of the neuronal cell membrane and has both structural and functional importance, including membrane fluidity and stability, receptor function, and signal transduction. 7
Traditional medicines contain many bioactive substances in variable proportions, and usually, much research has been done on the chemical composition and health benefits of these compounds. Still, the toxicity study of these compounds, primarily upon long-term use, needs to be addressed. For this reason, toxicological evaluation is a crucial step in determining the safety of use and supporting their traditional use.8,9
To date, no toxicity study of extracted walnut oil (EWO) has been done. So, this study aimed to find the phytochemical contents of the EWO and its toxicity profile in animal models.
Materials and Methods
Walnut Collection
High-quality fresh walnuts were collected from the Hawraman mountains, North-eastern Kurdistan region in Iraq, from September to October 2021 (harvesting period). A certified taxonomist at the College of Agriculture Engineering Sciences, University of Sulaimani, Sulaimaniyah, Iraq, officially identified the walnut species as Juglans regia Linn and herbarium voucher with reference number (No. 260-10-10-2021-UoS) was deposited.
Walnut oil Extraction
The hard shell of the walnut (5.0 kg) was broken, kernels were obtained (2.0 kg) and dried at 37° C overnight. Then, the oil was extracted using the cold press method (without heat or chemicals). 10 Briefly, the kernels were mashed into a paste, then placed in a cylinder which had a large screw and provided the required pressure (at 35-40° C with a rotational speed of 20 rpm) to force, drain and coax the oil out from the bottom of the machine (Bekrdaneh BD 45, Turkey). Finally, the extracted oil was filtered to get the best clarity level and free of any impurities. The yielded EWO was 1.7 L/2.0 kg of kernel/5.0 kg of shelled walnut. Finally, EWO was aliquoted into small sealed dark glass bottles (50 mL) and stored at 4° C until use.
Phytochemical Analysis of EWO
Phytochemical analysis of EWO was performed using Gas Chromatography-Mass Spectrophotometry (GC-MS) at the Biochemistry Laboratory, Department of Food Sciences, College of Agricultural Sciences, Duhok University, Duhok, Iraq. Briefly, GCMS analysis of the EWO was done on an Agilent 6890 N GC coupled to an Agilent 5973 K Quadrupole MS detector (Palo Alto, CA). A DB-WAX capillary column (60 m × 0.32 mm × 0.25 μm) (Agilent Technologies, Santa Clara, CA) was used as a stationary phase. Helium (99.99%) was used as a mobile phase at a 1.2 mL/minute flow rate. The injection was performed in splitless mode, while the injector temperature was 270° C and the detector temperature was 250° C. Retention indices (RI) were calculated for all components using a homologous series of n-alkanes injected in conditions equal to sample ones. Diluted samples (10 µL/mL) were prepared using methylene dichloride, and 1.0 µL samples were injected for analysis. EWO components were identified based on their GC retention times and their MS about authentic compounds in the literature. 11
Animals
Male Sprague Dawley rats (aged 6-8 weeks, weighing more than 145 g) were purchased from the animal house of the College of Veterinary Medicine, Kirkuk University, Kirkuk, Iraq. The rats were acclimatized on distilled water and a standard rat chow for seven days and kept in a well-ventilated room with a 12-h’ dark/light cycle at 25 ± 3° C before the study.
Sub-Chronic Toxicity Protocol
A toxicity study was performed according to the Organization for Economic Cooperation and Development (OECD) Guideline number 407 for testing a chemical 12 after minor modifications. Rats (n = 24) were randomly divided into four groups (n = 6). Group one was set as control negative (CN) and given distilled water (1.0 mL/kg body weight), while Group two were assigned low dose EWO (LD; 1.0 mL/kg body weight). Group three received a median dose of EWO (MD; 1.5 mL/kg body weight), and Group four was given a high dose of EWO (HD; 2.0 mL/kg body weight). All treatments were given as oral dosage for four consecutive weeks using a force-feeding needle.
Clinical Observations and Body Weight Measurements
The animals were observed twice daily for clinical and behavioural abnormalities, toxicological symptoms, food consumption, and gross appearance throughout 28 days of treatment. Also, the body weights were recorded before treatment (day zero) and on days 7.0, 14, 21, and 28.
Animal Sacrifice and Sample Collection
At the end of the experiment (on day 29), all rats were sacrificed under deep anaesthesia using a mixture of ketamine and xylazine. Later on, animals were opened aseptically, and then blood and organ samples were collected for further analysis.
Hematological Study
Blood samples (5.0 mL) were obtained from the caudal vena cava. Half of the blood was collected into ethylene-diamine tetra-acetic acid (EDTA) vacuumed blood collection tubes, mixed well immediately, and was analyzed directly to estimate total white blood cells (WBC), red blood cells (RBC), hemoglobin (Hb), hematocrit (HCT) and platelets (PLT) with differential WBC count (lymphocyte, monocyte, and granulocyte) using automatic hematology analyzer (Cell Dyn, 3700, Abbot, USA).
Biochemical Parameters
Another 2.5 mL of the blood sample was allowed to clot at room temperature for 15–30 min. Then, the clot was removed by centrifuging at 3500 rpm for 10 min. The serum was collected to determine total protein, albumin, alanine aminotransferase (ALT), aspartate transaminase (AST), alkaline phosphatase (ALP), total serum bilirubin (TSB), urea, creatinine, sodium, potassium, chloride, calcium, and phosphate using standard diagnostic kits (Roche) in an automatic biochemistry analyzer (Hitachi 902, Japan).
Histopathological Analysis
Following animal sacrifice, liver, kidney and brain samples were collected from each animal. In brief, tissue samples were immobilized into plastic tissue cassettes and then placed in 10% formaldehyde solution for about 48 h to fix the tissues. After that, tissue samples were passed through a series of ascending ethanol alcohol (60%, 70%, 80%, 90% and 100%) for dehydration, followed by a few steps of xylene cleaning. Later on, the samples were impregnated with melted paraffin wax and embedded with wax block using an automated wax embedder at 60 −70° C. Paraffinized block samples were trimmed and sectioned to 4.0–6.0 µm using a semi-automated rotary microtome (Leica, Japan). Then, the sectioned tissues were transferred to a hot water bath to remove paraffin wrinkles, hunted and fixed on a glass slide. Later, slides were deparaffinized, cleaned with xylene for half an hour, and dried. Finally, samples were stained using Harris's hematoxylin and eosin (H & E) solutions, washed with xylene, covered, and read under the light microscope (NOVEL XSZ-N107 T, China).
Semi-Quantitative Lesion Scoring
Within the liver sections, the number of vacuolar degenerative cells and inflammatory cells was estimated in the mean percentage of calculated cells from over ten selected microscopic fields under high power magnification (100 ×). At the same time, the area of vascular congestion was statistically evaluated in µm. The mean average was calculated and compared using percentages. On the other hand, the evaluation of renal tubular vacuolar degeneration, glomerular atrophy and the mean percentage of cells from selected sections were measured. Meanwhile, the area of perivascular edema and inflammatory exudates was evaluated in mean percentage. Alternatively, pyknotic cells within the cerebral cortex were counted in randomly chosen fields, and then the mean average was calculated in percentage. Lesion scoring was estimated semi-quantitatively via image analyzer software (AmScope, 3.7) using a microscope eye-piece camera (MD500, 2019) under the light microscope (NOVEL XSZ-N107 T, China). Finally, the mean percentage of all calculated values (scores) was expressed as 0.0–10% (no lesions), 10–25% (mild lesions), 25–50% (moderate lesions), 50–75% (severe lesions), and 75–100% (critical lesions).
Statistical Analysis
The Statistical Package for the Social Sciences (SPSS, IBM, USA, version 25.0), including the ANOVA and Kruskal-Wallis tests, was used to analyze the data. Analyzed data was presented as mean ± standard deviation (SD). A p-value of ≤0.05 was considered a significant difference.
Results
Phytochemical Analysis of EWO
As demonstrated in Table 1, about 49 different compounds were identified by GC-MS, including campesterol, gamma sitosterol, cholesterol, α-linolenic acid, arachidonic acid, palmitic acid, capric acid, lauric acid, stearic acid, margaric acid and polyunsaturated fatty acid (PUFA).
List of Phytochemicals Identified in Extracted Walnut Oil (EWO).

N/A: Not available.
Clinical Features and Body Weight Measurements
Daily oral administration of EWO at doses of 1.0, 1.5, and 2.0 mL/kg for 28 consecutive days did not change the overall behaviour of treated rats compared to controls, and they showed no signs of toxicity like segregation, laying down, ruffled hair, cannibalism, or loss of appetite. No animals died from either group, and significant (p ≤ 0.05) weight gain was observed in the CN and all EWO-treated groups for all timelines compared to day zero (Table 2).
Mean Body Weight of Control and Treated Rats with Different Doses of Extracted Walnut Oil (EWO).

There were six animals in each group. CN: Control negative, LD: Low dose EWO (1.0 mL/Kg body weight); MD: Median dose EWO (1.5 mL/Kg body weight), HD: High dose EWO (2.0 mL/Kg body weight). The data were analyzed using repeated measure ANOVA. Data are presented as mean ± SD. *: Significant difference when compared to day zero.
Hematological Analysis
There was no significant difference (p ≥ 0.05) between all investigated blood tests, including RBC count, total WBC count, HCT, Hb, lymphocyte, monocyte, and granulocytes in all treated groups compared to the CN group. Meanwhile, platelets showed a significant decrease (p = 0.015) in all EWO-treated groups when compared to the CN group (Table 3).
Mean Hematological Values of Control and Experimental Rats Treated with Various Doses of Extracted Walnut Oil (EWO).

There were six animals in each group. CN: Control negative, LD: Low dose EWO (1.0 mL/Kg body weight); MD: Median dose EWO (1.5 mL/Kg body weight), HD: High dose EWO (2.0 mL/Kg body weight). Data were analyzed using ANOVA (RBC, HCT, Hb, PLT, and lymphocyte) and the Kruskal Wallis test (WBC, monocyte, and granulocyte). Data are presented as mean ± SD. *: Significant difference when compared to the CN group. HCT: Hematocrit, Hb: Hemoglobin, PLT: Platelet, RBC: Red blood cell, WBC: White blood cell.
Biochemical Analysis
Regarding the liver function test, AST level showed a significant difference (p = 0.002), with a gradual decrease in the treated EWO groups (low, medium, and high doses, respectively) compared to the CN group. Also, the total protein level showed a significant difference (p = 0.004), with the highest value in the low-dose EWO group (6.80 ± 0.46 g/L) and the lowest in the CN (5.77 ± 0.26 g/L). As for other parameters (ALT, ALP, TSB and albumin), no significant differences were noticed (p ≥ 0.05) among groups (Table 4). Regarding electrolytes, chloride and calcium showed significant differences (p = 0.012 and p = 0.033, respectively) between the groups, but not in an orderly manner (Table 5). For the renal function test, blood urea and serum creatinine levels showed no significant difference (p ≥ 0.05) among groups, despite their increasing LEVEL in all EWO-treated groups compared to the CN group (Table 6).
Mean Biochemical Parameters of Control and Treated Rats with Various Doses of Extracted Walnut Oil (EWO).
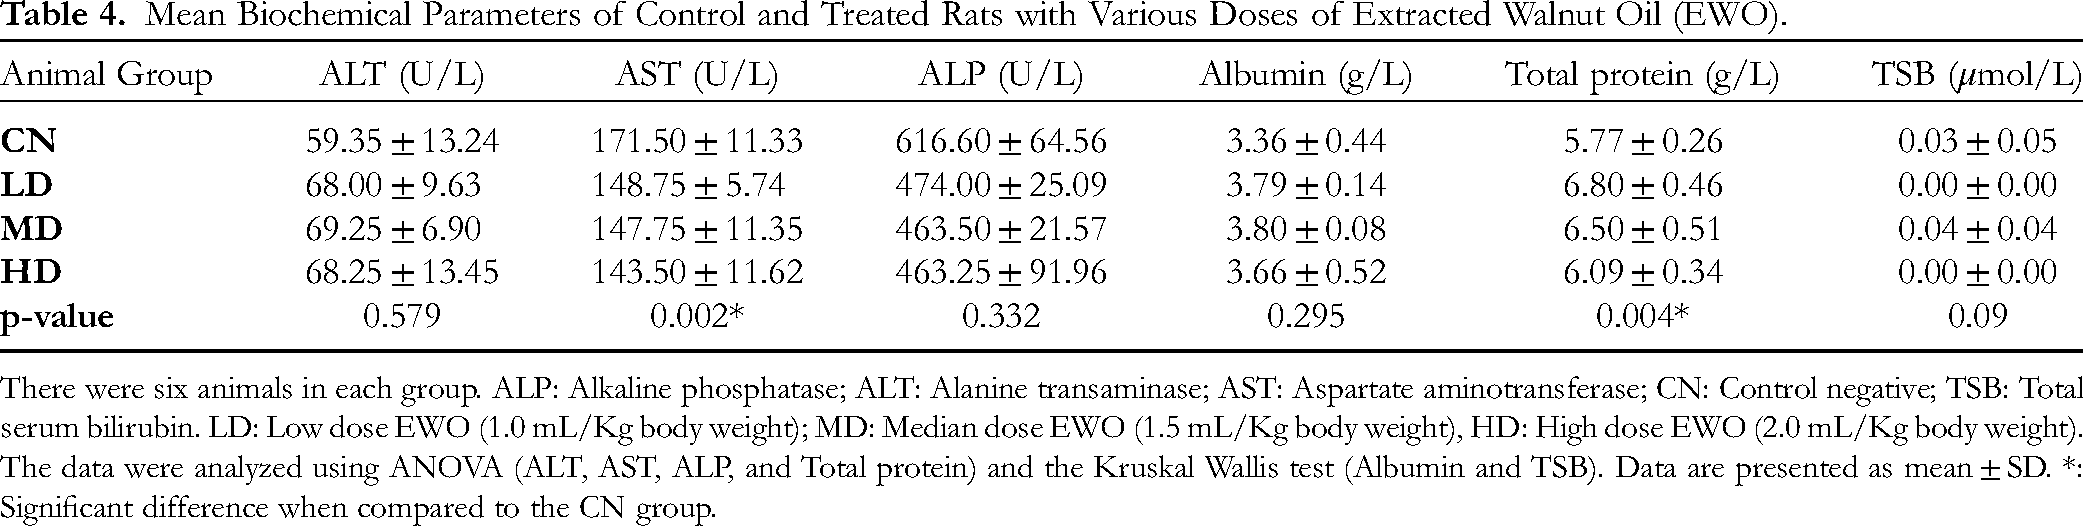
There were six animals in each group. ALP: Alkaline phosphatase; ALT: Alanine transaminase; AST: Aspartate aminotransferase; CN: Control negative; TSB: Total serum bilirubin. LD: Low dose EWO (1.0 mL/Kg body weight); MD: Median dose EWO (1.5 mL/Kg body weight), HD: High dose EWO (2.0 mL/Kg body weight). The data were analyzed using ANOVA (ALT, AST, ALP, and Total protein) and the Kruskal Wallis test (Albumin and TSB). Data are presented as mean ± SD. *: Significant difference when compared to the CN group.
Mean serum Electrolytes (Mmol/L) of Control and Treated Rats with Various Doses of Extracted Walnut Oil (EWO).

There were six animals in each group. CN: Control negative, LD: Low dose EWO (1.0 mL/Kg body weight); MD: Median dose EWO (1.5 mL/Kg body weight), HD: High dose EWO (2.0 mL/Kg body weight). The data were analyzed using ANOVA (potassium, chloride, phosphate, and calcium) and the Kruskal Wallis test (sodium). Data are presented as mean ± SD. *: Significant difference when compared to the CN group.
Mean Kidney Function Test of Control and Treated Rats with Various Doses of Extracted Walnut Oil (EWO).
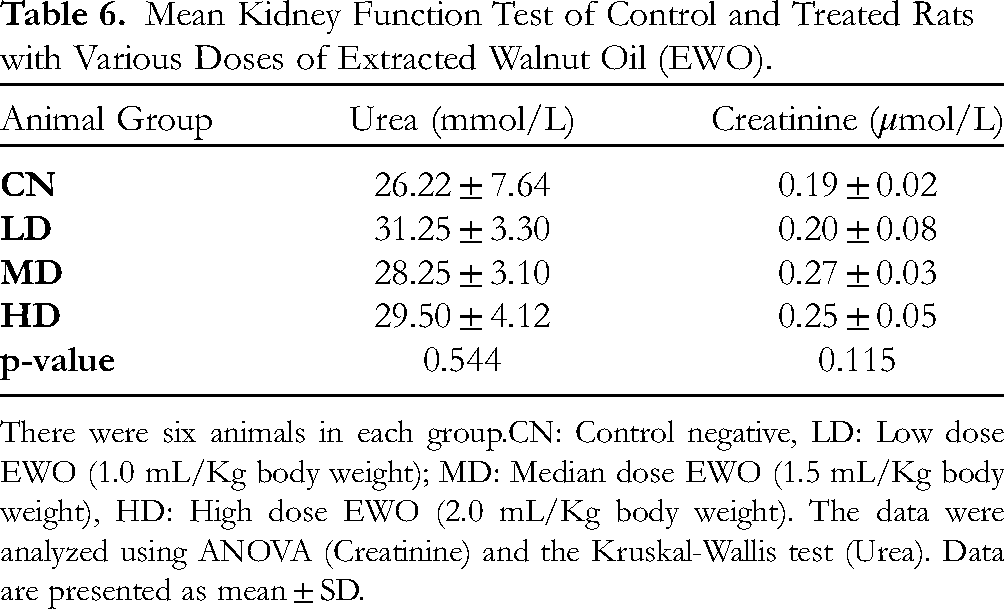
There were six animals in each group.CN: Control negative, LD: Low dose EWO (1.0 mL/Kg body weight); MD: Median dose EWO (1.5 mL/Kg body weight), HD: High dose EWO (2.0 mL/Kg body weight). The data were analyzed using ANOVA (Creatinine) and the Kruskal-Wallis test (Urea). Data are presented as mean ± SD.
Histopathological Examination
Morphometric semi-quantitative assay of liver sections reveals no lesions in the CN group, while moderate toxic side effects were seen for low, median and high doses of EWO, including vacuolar degeneration, vascular congestion, vascular dilation and narrowing of the sinusoidal capillaries indicating inflammatory edema (Table 7 and Figure 1).

Photomicrograph of livers from control negative (CN) displays a typical arrangement of radiated columns of hepatocytes (HP) around the central vein (CV) with typical sinusoidal capillaries (SC). The section reveals infiltration of low-grade and non-significant Kupffer cells within the inner wall of the sinusoids (yellow arrow). Low-dose (LD) extracted walnut oil (EWO) shows vacuolar degeneration (VD) within the affected HP. The central vein demonstrates a low-grade vascular dilation and narrowing of the sinusoidal capillaries (yellow arrows). Median dose (MD) EWO shows HP vacuolar degeneration, together with eosinophilic congestion in the sinusoidal SC and congested CV. High dose (HD) EWO expresses VD within the cytoplasm of HP, which appears as pale colouration. The sinusoidal capillaries and CV are filled with acidophilic pinkish proteinaceous fluid, indicating inflammatory edema (yellow arrow). H & E staining. Scale bar: 4.0 mm.
Semi-Quantitative Assay of Liver Sections from Control and Treated Rats with Various Doses of Extracted Walnut Oil (EWO).

There were six animals in each group. CN: Control negative, LD: Low dose EWO (1.0 mL/Kg body weight); MD: Median dose EWO (1.5 mL/Kg body weight), HD: High dose EWO (2.0 mL/Kg body weight). Hepatocyte vacuolar degeneration, vascular congestion and inflammatory cells were estimated in mean %.
In contrast to hepatic morphometric values, the renal grading system displayed mild, moderate, and severe lesions in low, median, and high doses of EWO, respectively. These results indicate the low toxicity of EWO at low doses on renal morphology, while the toxicity increases gradually with increasing EWO doses. Likewise, animals supplemented with low and median doses of EWO demonstrated mild to moderate lesion scores compared to the high-dose group (Table 8). However, animals fed high doses of EWO express vacuolar degeneration and cellular swelling involving the renal tubular epithelia and glomerular atrophy (Figure 2).

Photomicrograph of the kidney from the control negative (CN) group discloses no apparent morphological alteration in the renal parenchymal tissue, evidenced by the presence of ordinary glomerular (G) framework and typical renal tubular epithelia (RT). Low dose (LD) extracted walnut oil (EWO) reveals a low grade of glomerular atrophy (GA), and many RT display low-grade cellular degenerations (yellow arrows), together with hematogenic congestion in some dilated crossed-sectioned blood vessels (BV). Median dose (MD) EWO demonstrates vacuolar degeneration (yellow arrows) within the cytoplasm of RT, moderate GA with low-grade glomerular (G) damage and BV proliferation. High dose (HD) EWO shows severe cellular degeneration in the RT (yellow arrows), infiltration of inflammatory cells (IC) within the renal mesenchymal tissue, congested BV and low-grade GA. H & E staining. Scale bar: 4.0 mm.
Semi-Quantitative Assay of Kidney Sections from Control and Treated Rats with Various Doses of Extracted Walnut Oil (EWO).
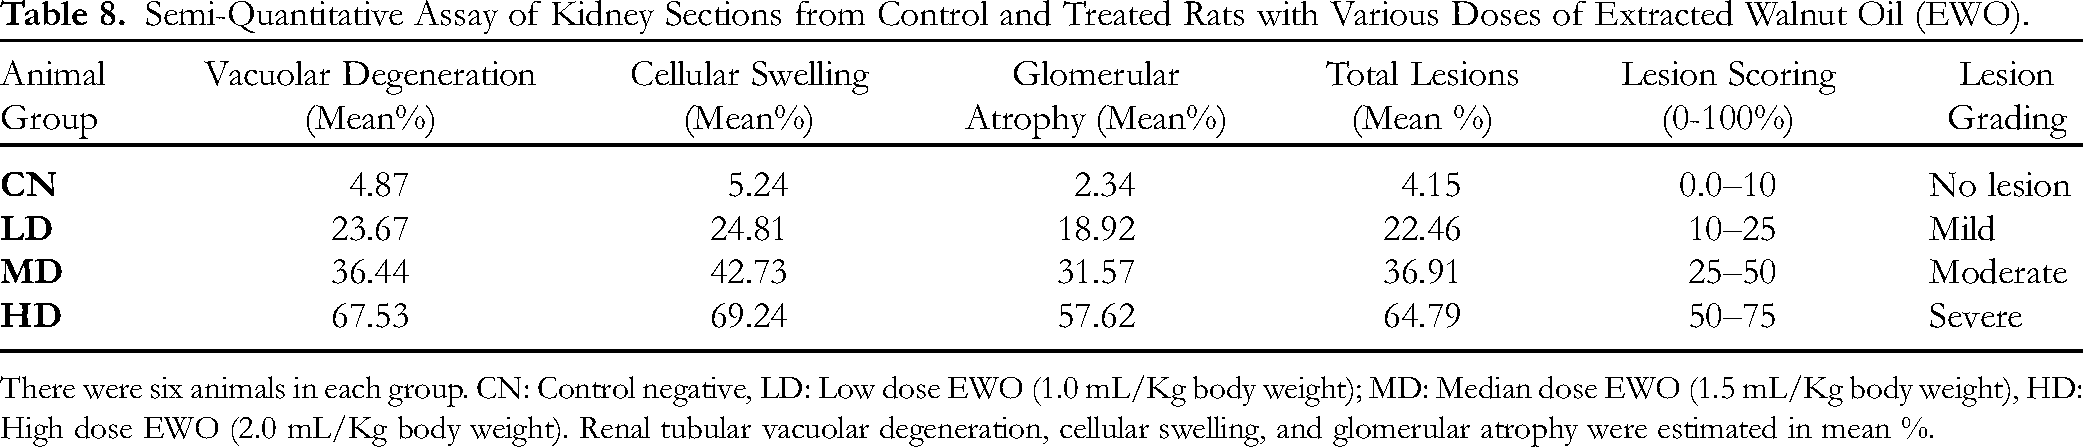
There were six animals in each group. CN: Control negative, LD: Low dose EWO (1.0 mL/Kg body weight); MD: Median dose EWO (1.5 mL/Kg body weight), HD: High dose EWO (2.0 mL/Kg body weight). Renal tubular vacuolar degeneration, cellular swelling, and glomerular atrophy were estimated in mean %.
Table 9 establishes the morphometric semi-quantitative assessment of brain tissues, which reveals no severe morphological changes within the cerebral cortex in all supplemented groups. However, tissue scoring in the medium and high doses shows a moderate lesion and can be considered a moderate toxicity at these doses of EWO. On the other hand, animals in the low-dose group demonstrated mild lesion scores compared to other treated groups (median and high doses), with no lesion in the CN group (Figure 3).

Photomicrograph of the brain from control negative (CN) shows no significant morphological changes within the cerebral tissue, represented by intact pyramidal cells (PC) arranged classically within the grey matter (GM) with ordinary appeared neurons (NE). Non-significant pyknotic cells within the section (yellow arrow). Low dose (LD) extracted walnut oil (EWO) displays standard arrangement and the typical layout of the PC within the intact GM of the cerebral cortex. The section also shows non-significant pyknotic glial cells (yellow arrow) with low-grade perivascular edema (PE). Median dose (MD) EWO demonstrates the moderate distribution of pyknotic cells (yellow arrows) within the cerebral cortex, together with non-significant perineuronal edema (PE). The section also reveals a distributed area of pinkish edematous fluid around some blood vessels (BV). High-dose (HD) EWO demonstrates BV congestion and perivascular/perineuronal edema (PN) with shrunk neurons. The section expresses many pyknotic glial cells (yellow arrows) with white matter fibre arrangements (white arrows). H & E staining. Scale bar: 4.0 mm.
Semi-Quantitative Assay of Brain Sections from Control and Treated Rats with Various Doses of Extracted Walnut Oil (EWO).

There were six animals in each group. CN: Control negative, LD: Low dose EWO (1.0 mL/Kg body weight); MD: Median dose EWO (1.5 mL/Kg body weight), HD: High dose EWO (2.0 mL/Kg body weight). The area of edema and inflammatory exudate with pyknotic cells were estimated in mean %.
Discussion
In most developing countries, including Iraq, people tend to depend on traditional medicine excessively. Walnuts are categorized as a nutrient-dense and high-calorie content food that might cause toxicity to the liver because excess calories lead to fat buildup and develop fatty liver. Thus, the possible toxic effects of such large amounts (maximum of 2.0 mL/kg) of EWO were tested against vital organs (liver, kidney, and brain) and renal/hepatic functions in rats.
The GC-MS analyses in the present study showed that EWO contains campesterol and gamma sitosterol that are stabilizing the phospholipid bilayer of the cell membrane with well-proven bioactivity and varieties of health benefits,13,14 such as lipid-lowering, hypoglycemic, anti-inflammatory, antioxidant and antiproliferative properties.15,16 The EWO also contained cholesterol, a significant membrane constituent, 17 and a major precursor of many steroid compounds, including steroid hormones. 18 The EWO contained the capric acid known as decanoic acid (C10:0), which significantly reduced the proinflammatory cytokines (TNF-α and IL-6). 19 Lauric acid was another EWO component, that is an excellent antimicrobial lipid used as an antibacterial, antiviral, and antifungal agent. 20 Among the saturated fatty acids (SFA), EWO contains palmitic acid (C16:0), the most common SFA in the human body, representing 20–30% of total fatty acids in the membrane bilayer. Myristic acid (C14:0) is another SFA found in EWO that is also found in the human cellular membrane but at lower levels, and it has been proven to alleviate the ageing process. 21 The EWO contains linoleic acid and arachidonic acid from the omega 6 PUFA family and essential fatty acids to be delivered with diet.22,23 The EWO analysis showed the presence of conjugated linoleic acid, 24 a group of geometric isomers of omega-6 essential fatty acids. The one found in our local EWO is the most common isomer, cis-9 trans-11 octadecadienoic acid. Different isomers have different bioactivities in vivo and have positive effects on lowering cholesterol and body weight in addition to the other impacts. 24
In animal studies, weight change is considered a vital toxicity index for tested laboratory animals, as significant body weight reduction is a dangerous sign of toxic products in treated animals. The current study showed a significant increase in the rats’ body weight in all EWO-treated groups (p < 0.05). These results revealed that EWO had no negative impact on the food intake and growth of the rats. These outcomes are in agreement with the Gencoglu et al study, which found body weight gain in male Wistar-albino rats fed 20 mg/kg EWO. 25 Similarly, Hassan et al found significant body weight gain in male Albino rats orally treated with 0.25 and 0.5 mL/kg EWO for 60 days. 26
Regarding the effect of EWO on tested blood parameters, only platelet values showed a significant decrease (p ≤ 0.05) in all EWO-treated groups compared to the CN group. These findings support the outcomes of Kao et al, who confirmed that juglone, an active compound from EWO, prevents platelet aggregation through its antiplatelet and antithrombotic effects by inhibiting protein kinase-B (Akt) and protein disulfide isomerase. 27 Additionally, Ganji et al provide evidence that walnut bark extract has antiadhesive, antiaggregant, and anticoagulant activities and could be considered a source of biological compounds for preventing and treating thrombosis. 10
The liver is an excretory/detoxifying organ and is regarded as the target organ for many lipids and lipid-soluble substances like medicinal plants and herbs rich in fatty acids. Upon continuous exposure to specific metabolites or bio-active components of these plants, liver cell membrane permeability is altered, and the cytosolic enzymes are released into circulation. Thus, in this study, we tested the most commonly used biomarkers of liver cell damage and sensitive indicators of hepatotoxicity (ALT, AST, ALP, TSB, albumin and total protein), and AST level was significantly and gradually decreased. At the same time, ALT was non-significantly increased in all EWO-treated groups compared to the CN group. An elevated ALT and a low AST suggest fatty liver disease, 28 and in this study, it might be due to minor fatty liver that is caused by EWO consumption. In this regard, Miao et al observed non-significant changes (p > 0.05) in serum ALT and AST contents of the mice fed with 2.5 mL/kg EWO. 29 Moreover, total protein was significantly increased in all EWO-treated groups compared to the CN group, which did not agree with that of Hassan et al, who found no change in total protein level in male Albino rats orally treated with 0.25 and 0.5 mL/kg EWO for 60 days. 26
In the current study, among studied serum electrolytes, only calcium significantly (p = 0.033) increased in all EWO-treated groups in an orderly fashion, which can be explained by the fact that walnuts contain many trace elements; among them, calcium is present in high concentrations.30–32
Regarding the toxicity of vital organs, we found mild lesions in the kidneys and brain on low doses of EWO. However, vacuolar degeneration, vascular congestion, and some degrees of inflammation indicated moderate lesions in the liver when using low, median, and high doses of EWO. Mild, moderate, and severe lesions were seen in kidney tissues of EWO-treated animals, which were evidenced by vacuolar degeneration, cellular swelling, and glomerular atrophy, using median and high doses of EWO. Similar results were also reported in other studies using different oral doses of EWO in various animal species for multiple periods.10,26 Furthermore, brain tissues of EWO-treated rats showed mild to moderate edema, inflammatory exudate, and pyknotic cells, similar to other study outcomes. 10
Finally, EWO's possible reno-toxic effects were also studied by measuring blood urea and creatinine. Based on the results of these tests, this study showed no reno-toxicity after 28 days of EWO administration. In this regard, the reno-protective effects of EWO were studied and confirmed by Al-Okbi et al and Lockyer et al33,34 Consequently, 1.0 mL EWO did not result in mortality and did not produce significant toxicities in experimental rats, which is equivalent to ≈10 mL in a 60 kg adult human. 35
Conclusions
The EWO contained numerous phytochemical components. Also, the EWO did not significantly affect most hematological and biochemical tests, as well as histopathological analysis at low dose. At the same time, some moderate to severe degrees of toxicity were found in vital organs, especially at the median and high doses.
Limitations of the Study
The study's limitations were that it needed advanced and well-equipped laboratories to conduct more parameters, including molecular study and seeking specific toxicity-related biomarkers.
Footnotes
Acknowledgements
The authors would like to express their appreciation for the facilities and services offered by the College of Medicine, University of Sulaimani, Sulaimaniyah, Iraq, for this study.
Declaration of Conflicting Interests
The authors declared no potential conflicts of interest with respect to the research, authorship, and/or publication of this article.
Funding
The authors received no financial support for the research, authorship, and/or publication of this article.
Ethical Approval
The proposal and study protocol were revised and approved by the Scientific and Ethical Committees of the College of Medicine, University of Sulaimani, Sulaimaniyah, Iraq (No. 161/Aug/24/2021/UoS).
Informed Consent
Not applicable
Human and Animal Rights
Measures were taken to minimize pain and discomfort, and experiments followed the ARRIVE Guidelines for animal ethics guidelines and protect animal rights.