
Abstract
Asparagus (Asparagus officinalis L.) is a food crop with a variety of pharmacological effects that can be classified as green or white, depending on cultivation methods. However, no research has been conducted on the profiles of primary and secondary metabolites in green and white asparagus. Hence, the aim of this study was to comprehensively analyze and understand the metabolic variations associated with the color differences in asparagus under different cultivation conditions. Through extensive profiling of primary and secondary metabolites, we identified 48 hydrophilic compounds, nine policosanols, seven terpenoids, six flavonoids, and one phenolic acid. Multivariate and metabolic pathway analyses revealed notable distinctions between green and white asparagus. Green asparagus contained high levels of flavonoids, policosanols, and primary metabolites (organic and amino acids). In contrast, white asparagus contained high levels of sugars, proline, and terpenoids (tocopherols, phytosterols, and protodioscin). These results suggest that green asparagus has higher energy and amino acid synthesis metabolism for plant development and growth through photosynthesis under light cultivation conditions than white asparagus. In contrast, white asparagus accumulated stress-related metabolites, such as sucrose, proline, and phenylalanine, under dark cultivation conditions. In addition, flavonoid metabolism was activated under light conditions, whereas terpenoid biosynthesis was activated under dark conditions. The DPPH and ABTS scavenging activities of green asparagus were at least twice as high as those of white asparagus. Overall, green asparagus is a good source of nutrients and contains more antioxidants than white asparagus. These findings might be the first report of comprehensive metabolome in asparagus, and they will significantly contribute to understanding the effects of different cultivation conditions on the asparagus metabolome.
Introduction
Asparagus (Asparagus officinalis L.) is a perennial plant and food crop mainly used in the form of a thick shoot called a spear. It has been cultivated for a long time in human history and was also cultivated in ancient Egypt, Greece, and Rome and used for medicinal and edible purposes. 1 It is currently used in a variety of foods, such as salads and vegetable soups, and is among the top 10 most popular vegetables. 2 Asparagus is divided into green, white, purple-green, purple-blue, and pink, depending on the color difference, but it can also be divided into green and white. 3 Green asparagus is popularly consumed, but white asparagus varieties are more familiar or preferred in some countries, such as the Netherlands, Belgium, and Peru. 1
These phenotypes are divided into groups based on the cultivation method, and the metabolite composition of each group differs. The major differences are flavonoid and steroidal saponins; green asparagus has a high content of the flavonoid rutin. In addition, the content of flavonoid anthocyanins is high in purple-green, purple-blue, and pink asparagus. 3 While white asparagus has a high content of steroidal saponins called protodioscins. 4 Various pharmacological effects of these compounds have been previously reported. Rutin weakens lipid peroxidation, restores total antioxidant activity, and protects against hepatotoxic substances. 5 It has also been reported to exert antidiabetic effects by suppressing intestinal carbohydrate absorption, reducing glucose production, increasing tissue glucose intake, and stimulating pancreatic insulin secretion. 6 Additionally, a wide range of biological effects have been reported, including anti-inflammatory, neuroprotective, and antioxidant activities.7–9 The anthocyanins have been reported to have physiological functions including antioxidant activity, anti-aging activity, and reducing the risk of cancer and diabetes. 10 In the case of protodioscin, it has been reported to reduce hyperglycemia and renal injury and prevent renal tumor necrosis factor-α and accumulation of renal lipids. 11 In another study, activating GABA neurotransmission and increasing the concentration of brain inhibitory amino acids in the striatum were found to have antiepileptic effects on pilocarpine-induced spasms. 12 It has also been shown to modulate neuronal survival and promote expression of apoptotic proteins. 13 In addition, aphrodisiac effects, improvement of arthritis, and neuroprotective effects have also been studied.14,15
The identification of metabolites in asparagus continues to this day owing to their versatility in health, and many attempts have been made to utilize both transcripts and metabolites.16,17 For anthocyanin accumulation analysis of green and purple asparagus, 16 anthocyanins were identified, and 10 biosynthetic and six regulatory genes were analyzed. 10 In addition, to confirm differences in the biosynthesis of major compounds between green and white asparagus, rutin and protodioscin were quantitatively analyzed. Thereafter, gene function and expression were compared using de novo transcriptomes. 18
A comprehensive profiling analysis encompassing primary and secondary metabolites has not yet been performed in green and white asparagus, despite the fact that integrated analyses of transcripts and metabolites are being performed to better understand complex biological systems. Therefore, the purpose of this study was to explore the differences in the biosynthetic metabolism of green and white asparagus by metabolite profiling. In addition, we explored the antioxidant activities of green and white asparagus to evaluate the functionality of these plants.
Materials and Methods
Plant Materials
Asparagus (Asparagus officinalis cv.Atlas) was cultured on a farm in Chuncheon-si, Gangwon-do, Korea. The growing conditions for green and white asparagus were differed in the presence or absence of sunlight. The green asparagus was grown on the farm under sunlight, while white asparagus was grown by blocking out sunlight. In the present study, asparagus grown for 5 years was used for antioxidant and metabolite analyses (Figure 1). The samples were washed in distilled water and then frozen in liquid nitrogen. Thereafter, asparagus was lyophilized and ground into a powder using a mortar and pestle. Ground samples were kept at −80 °C for the analysis of metabolites and antioxidant activities.
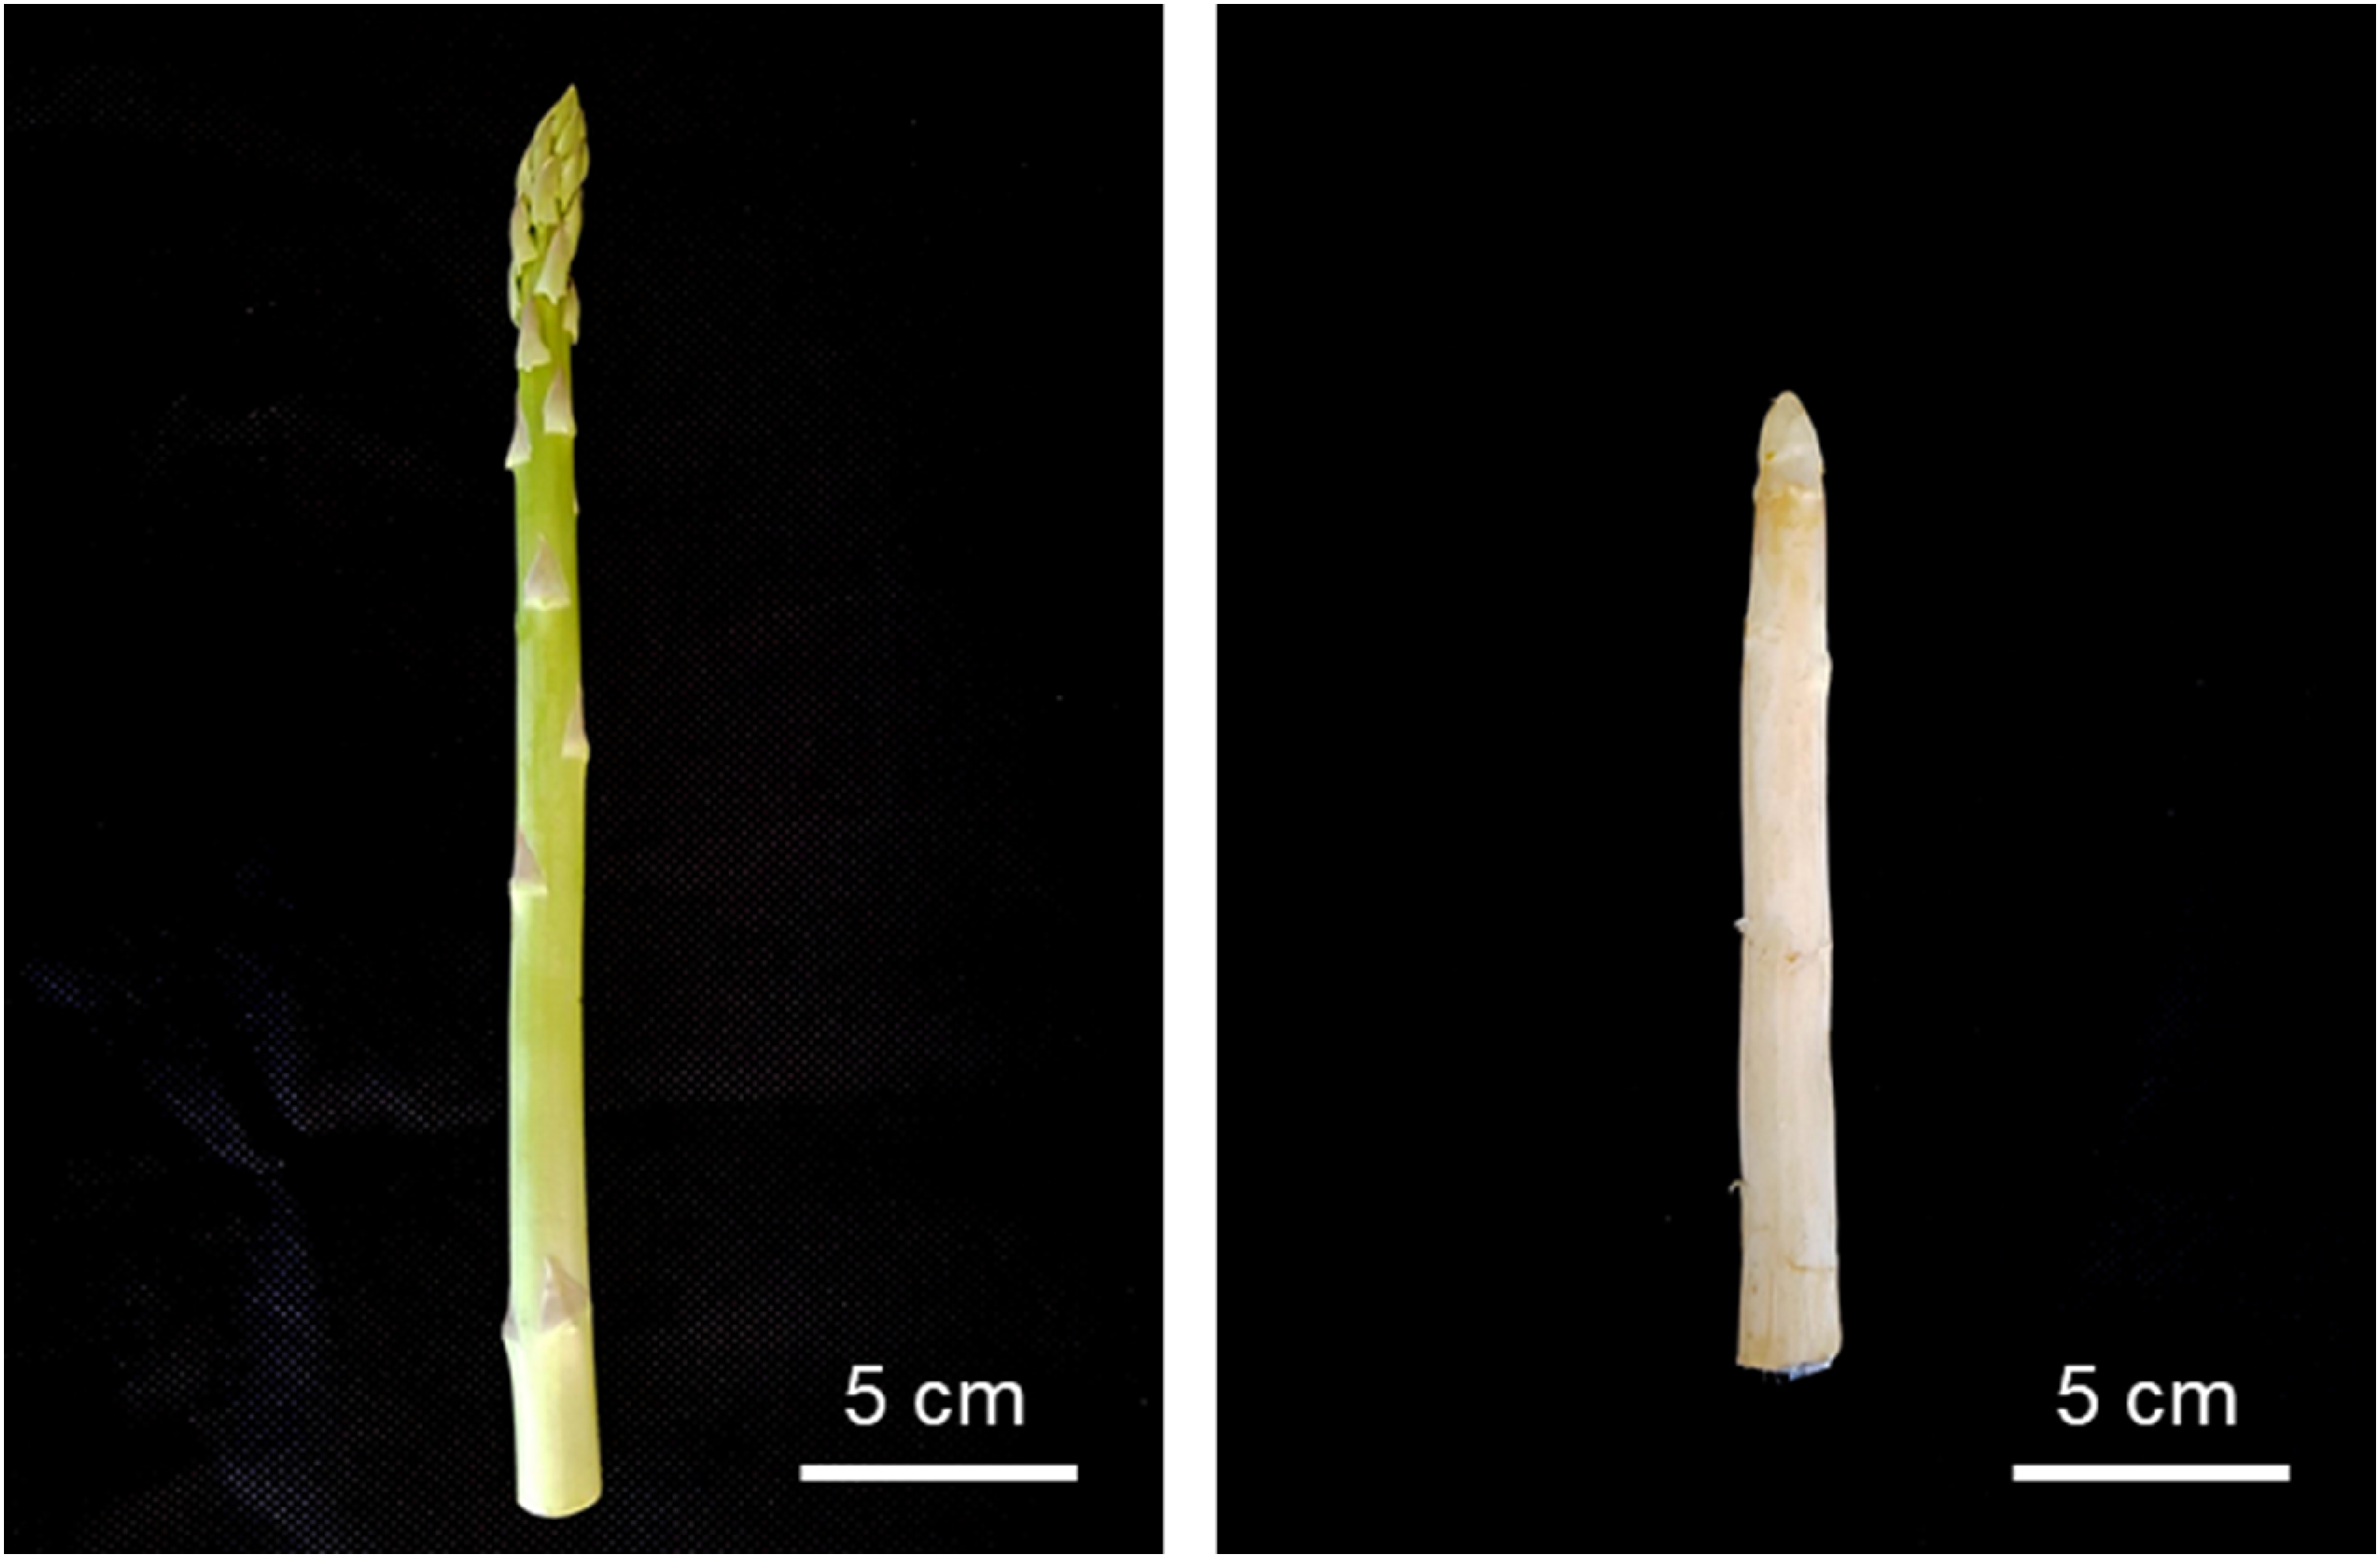
Phenotypes of green and white asparagus shoots.
Analysis of Lipophilic Compounds
Extraction and analysis of lipophilic compounds were carried out according to previously reported methods. 19 Fine-ground samples were weighed at 30 mg in 15-mL conical tubes, then added to 3 mL of 0.1% ascorbic acid in ethanol. The 5α-cholestane (50 μL, 10 μg/mL) was also mixed with samples as an internal standard (IS). The samples were then boiled at 85 °C for 5 min before adding 120 μL of 80% potassium hydroxide. After that, the mixture was placed in an 85 °C water bath for 10 min. Next, the samples were left on ice for 5 min, then added to 1.5 mL of distilled water and hexane. The sample was centrifuged (4 °C, 1200 × g) for 5 min, and then the upper layer was carried into new tubes. The remaining components were extracted again by adding 1.5 mL of hexane. The upper hexane layer was collected, and a total of 3 mL of hexane was evaporated using a flow of N2 gas. Next, 30 µL of pyridine and MSTFA (N-Trimethylsilyl-N-methyl trifluoroacetamide) were added and incubated at 60 °C for 30 min in a thermomixer for the derivatization. Then, 1 μL of sample was injected into GC-qMS (GCMS-QP2010 Ultra, Shimadzu, Kyoto, Japan). The Rtx-5MS column (12623, Restek, Bellefonte, PA, USA) was equipped, and helium flow was 1 mL/min. The temperatures of the inlet, interface, and ion source were 290, 280, and 230 °C, respectively. The oven temperature was maintained at 150 °C for 2 min, then ramped at a rate of 15 °C/min to 320 °C and held for 10 min. The qualification and quantification of lipophilic compounds were conducted using reference standards from Sigma Aldrich (policosanols and phytosterols, Sigma Aldrich, St. Louis, MO, USA) and Merck (tocopherols, Merck, Darmstadt, Germany).
Analysis of Hydrophilic Compounds
Extraction and analysis of hydrophilic compounds were carried out according to previously reported methods. 20 Fine-ground samples (10 mg) were mixed with 1 mL of methanol:water:chloroform = 5:2:2 (v/v/v). Ribitol (60 μL, 200 μg/mL in methanol) as an IS was added to the mixture. Next, the samples were incubated at 37 °C, 1200 rpm for 30 min in an Eppendorf AG Thermomixer Comfort. The sample was centrifuged at 4 °C, 16 000 × g for 3 min, and then 0.8 mL of the upper layer was carried into new tubes. 0.4 mL of distilled water was mixed with the upper layer, then centrifuged at 4 °C, 16 000 × g for 3 min. The upper layer was collected into a new tube and dried with a centrifugal concentrator for 4 hr and a freeze-dryer for 16 h. For derivatization, MOX (80 μL, 2% methoxyamine hydrochloride in pyridine) was added, and the samples were incubated at 30 °C for 90 min with shaking (1200 rpm). After that, MSTFA (80 μL) was added, and the samples were incubated at 37 °C for 30 min with shaking (1200 rpm). Then, 1 μL of sample was injected into GC-TOF-MS (Pegasus BT, LECO, St. Joseph, MI, USA). The CP-SIL 8 CB column (CP5860, Agilent, Santa Clara, CA, USA) was equipped, and helium flow was 1 mL/min. The temperatures of the inlet, transferline, and ion source were 230, 280, and 250 °C, respectively. The injection mode was split at a 1:25 ratio. The oven temperature was maintained at 80 °C for 2 min, then ramped at a rate of 15 °C/min to 320 °C and held for 10 min. The qualification of hydrophilic compounds was conducted using an in-house library based on reference standards. The quantification method was relative quantification, in which the ratio was calculated as area of target compound/area of ribitol.
Analysis of Flavonoids and Protodioscin
The analysis of flavonoids and protodioscin compounds was performed according to previously described methods with slight modifications. 21 Flavonoids and protodioscin were analyzed using HPLC-UV (Shimadzu, Kyoto, Japan). The gradients of solvent were carried out with water with 0.1% formic acid (A) and acetonitrile with 0.1% formic acid (B). The gradient condition was as follows: 0 min, 88% A; 20 min, 70% A; 50 min, 20% A; 53 min, 20% A; 54 min, 12% A; and 60 min, 12% A. The HPLC system was equipped with a C18 column (5 μm film×4.6 mm i.d.×250 mm), and the column temperature was kept constant at 40 °C. The column flow was 0.7 mL/min. The UV wavelengths were adjusted at 205 nm (protodioscin) and 280 nm (flavonoids), respectively.
Determination of Antioxidant Activities
The DPPH and ABTS radical scavenging activities were measured using previously described methods. 22 Ascorbic acid was used as the positive control to measure the antioxidant activity. The extract was extracted by adding 1 mL of 70% ethanol to 10 mg of asparagus powder samples and then diluted to 1000, 2000, and 4000 μg/mL, respectively. The absorbance was obtained at 517 nm for the DPPH assay and 738 nm for the ABTS assay, respectively.
Statistical Analysis
All analyses were performed in triplicate. All acquired data were normalized for principal component analysis (PCA) and orthogonal partial least squares discriminant analysis (OPLS-DA) using unit variance scaling. PCA and OPLS-DA were performed using SIMCA (SIMCA 13, Umetrics, Umeå, Sweden). Pearson's correlation analysis and hierarchical clustering analyses (HCAs) were performed using MetaboAnalyst 5.0.
Pathway Analysis
The metabolic pathway of asparagus was visualized using PathVisio.20,23 To link the metabolites to schematics of the metabolic pathways in PathVisio, all metabolite names were converted into PubChem compound IDs (PubChem CIDs) (Table S1). The metabolic profile data was shown using unit variance scaling from −1.0 to 1.0. A scaling value > 0 is displayed in red and denotes higher levels than the average. A scaling value < 0 is displayed in green and denotes lower levels than the average. The gray represents substances that have not been identified.
Results and Discussion
Metabolite Profiling of Green and White Asparagus
To determine the differences between green and white asparagus, we analyzed the hydrophilic and lipophilic compounds and major metabolites in asparagus using GC-TOF-MS, GC-qMS, and HPLC-UV. We detected 48 hydrophilic compounds, including amino acids, organic acids, sugars, and phenolic acids. Furthermore, 16 lipophilic compounds, including terpenoids and policosanols, six flavonoids, and one phenolic acid, were identified in asparagus (Tables S2, S3, and S4). The notable metabolites in green asparagus are rutin and other flavonoids, whereas those in white are protodioscin and other terpenoids. In addition, these metabolites are the major compounds in green and white asparagus.1,4,10,15 This suggested that green asparagus is a good source of flavonoids, while white asparagus is a good source of terpenoids.
Antioxidant Activities of Green and White Asparagus
DPPH and ABTS scavenging activities are simple, rapid, sensitive, and commonly used to confirm antioxidant activities.24,25 Free radicals are scavenged by antioxidant compounds, and the ability of antioxidants to scavenge DPPH and ABTS radicals was measured.26,27 DPPH and ABTS scavenging activities are shown in Figure 2. Ascorbic acid was used as the positive control. Comparing the antioxidant capacity of green and white asparagus, DPPH and ABTS scavenging activity was higher in green than in white (Figure 2).

DPPH and ABTS scavenging activities in green and white asparaguses.
Asparagus contains antioxidants, such as polyphenols, carotenoids, vitamin C, and vitamin E. Polyphenols and carotenoids, in particular, show strong antioxidant effects. Flavonoids, especially rutin, directly affect the antioxidant capacity of plants.21,28,29 In a previous study, variations in the bioactive compound content and antioxidant capacity were analyzed in 23 green asparagus varieties. In addition, rutin concentration is strongly correlated with antioxidant capacity. 21 Another study reported that colored asparagus showed higher rutin, total polyphenol, and DPPH radical-absorbing activity than white asparagus. 30 Our results also showed higher rutin concentrations and antioxidant activities in green asparagus than in white asparagus. Rutin content in plants is highly dependent on light, and UV-B radiation has a crucial influence on rutin synthesis. 31 This pattern occurred because the cultivation method differed between green (exposed to light) and white (blocked light) asparagus. These results discussed the comparison of DPPH and ABTS scavenging activities in green and white asparagus, highlighting the higher antioxidant capacity in green asparagus than in white asparagus due to its exposure to light during cultivation.
Multivariate Statistical Analysis
Metabolite profiling data were used in multivariate statistical analyses (PCA and Pearson's correlation analysis), a crucial tool for identifying the characteristics of samples in intricate data matrices, to ascertain the differences between green and white asparagus. The PCA score plot displayed a clear separation between green and white asparagus (Figure 3). Two principal components (PCs) of the score plots explained 86.4% of the total variance (PC 1, 71.5%; PC2: 14.9%). The Q2 value was 0.624, indicating a good predictive model. Component 1 primarily contributed to the separation of green and white asparagus. The metabolites in the loading plots explain the separation of the corresponding samples from the score plots (Table S5). In the column loading plot of component 1, the significant metabolites of white asparagus were protodioscin, stigmasterol, proline, glycine, α-tocopherol, malic acid, sucrose, lactic acid, methionine, and campesterol, with eigenvector values of 0.140292, 0.14028, 0.136943, 0.136936, 0.13563, 0.135496, 0.13534, 0.135083, 0.133301, and 0.132701, respectively. On the contrary, the primary metabolites that contributed to green asparagus were isoquercetin, nictoflorin, rutin, 4-aminobutyric acid, tryptophan, citric acid, asparagine, threonic acid, quinic acid, and xylitol, for which the eigenvector values were −0.140346, −0.140342, −0.140317, −0.140053, −0.139721, −0.139159, −0.138999, −0.13834, 0.137809, and −0.137064, respectively.

Principal component analysis (PCA) score plots (A) and loading column plots (B) of green and white asparaguses. Two principal components (PCs) of the score plots explained 86.4% of the total variance (PC 1, 71.5%; PC2: 14.9%). The ellipse indicates the Hotelling T2 with a 95% level of confidence in the score plot. The loading plots represent the original variables in the space of the PCs; they reveal the magnitude and direction of correlation of the original variables with the first two PC.
Pearson's correlation and HCAs were performed to elucidate the correlations between metabolites in asparagus. The results of Pearson's correlation analysis and HCA indicated two clusters (Figure 4). Cluster A showed a positive correlation with a cluster of the terpenoids, such as α-, β-, γ-tocopherols, β-sitosterol, campesterol, stigmasterol, cholesterol, and protodioscin, because these metabolites are synthesized via a common terpenoid biosynthesis pathway. Furthermore, the flavonoids in cluster B were negatively correlated with phenylalanine and shikimic acid because these metabolites are precursors of flavonoids in the shikimate-phenylalanine biosynthesis pathway. Cluster B showed a strong positive correlation with flavonoids such as rutin, nictoflorin, and isoquercetin. Additionally, the policosanols clustered with each other, showing a positive correlation. Flavonoid and terpenoid contents were negatively correlated. In the case of primary metabolites, most nitrogen compounds were clustered in cluster B and showed a positive correlation with each other. In contrast, cluster A showed a positive correlation with clusters of carbon compounds, such as organic acids and sugars, and a negative correlation with nitrogen compounds.
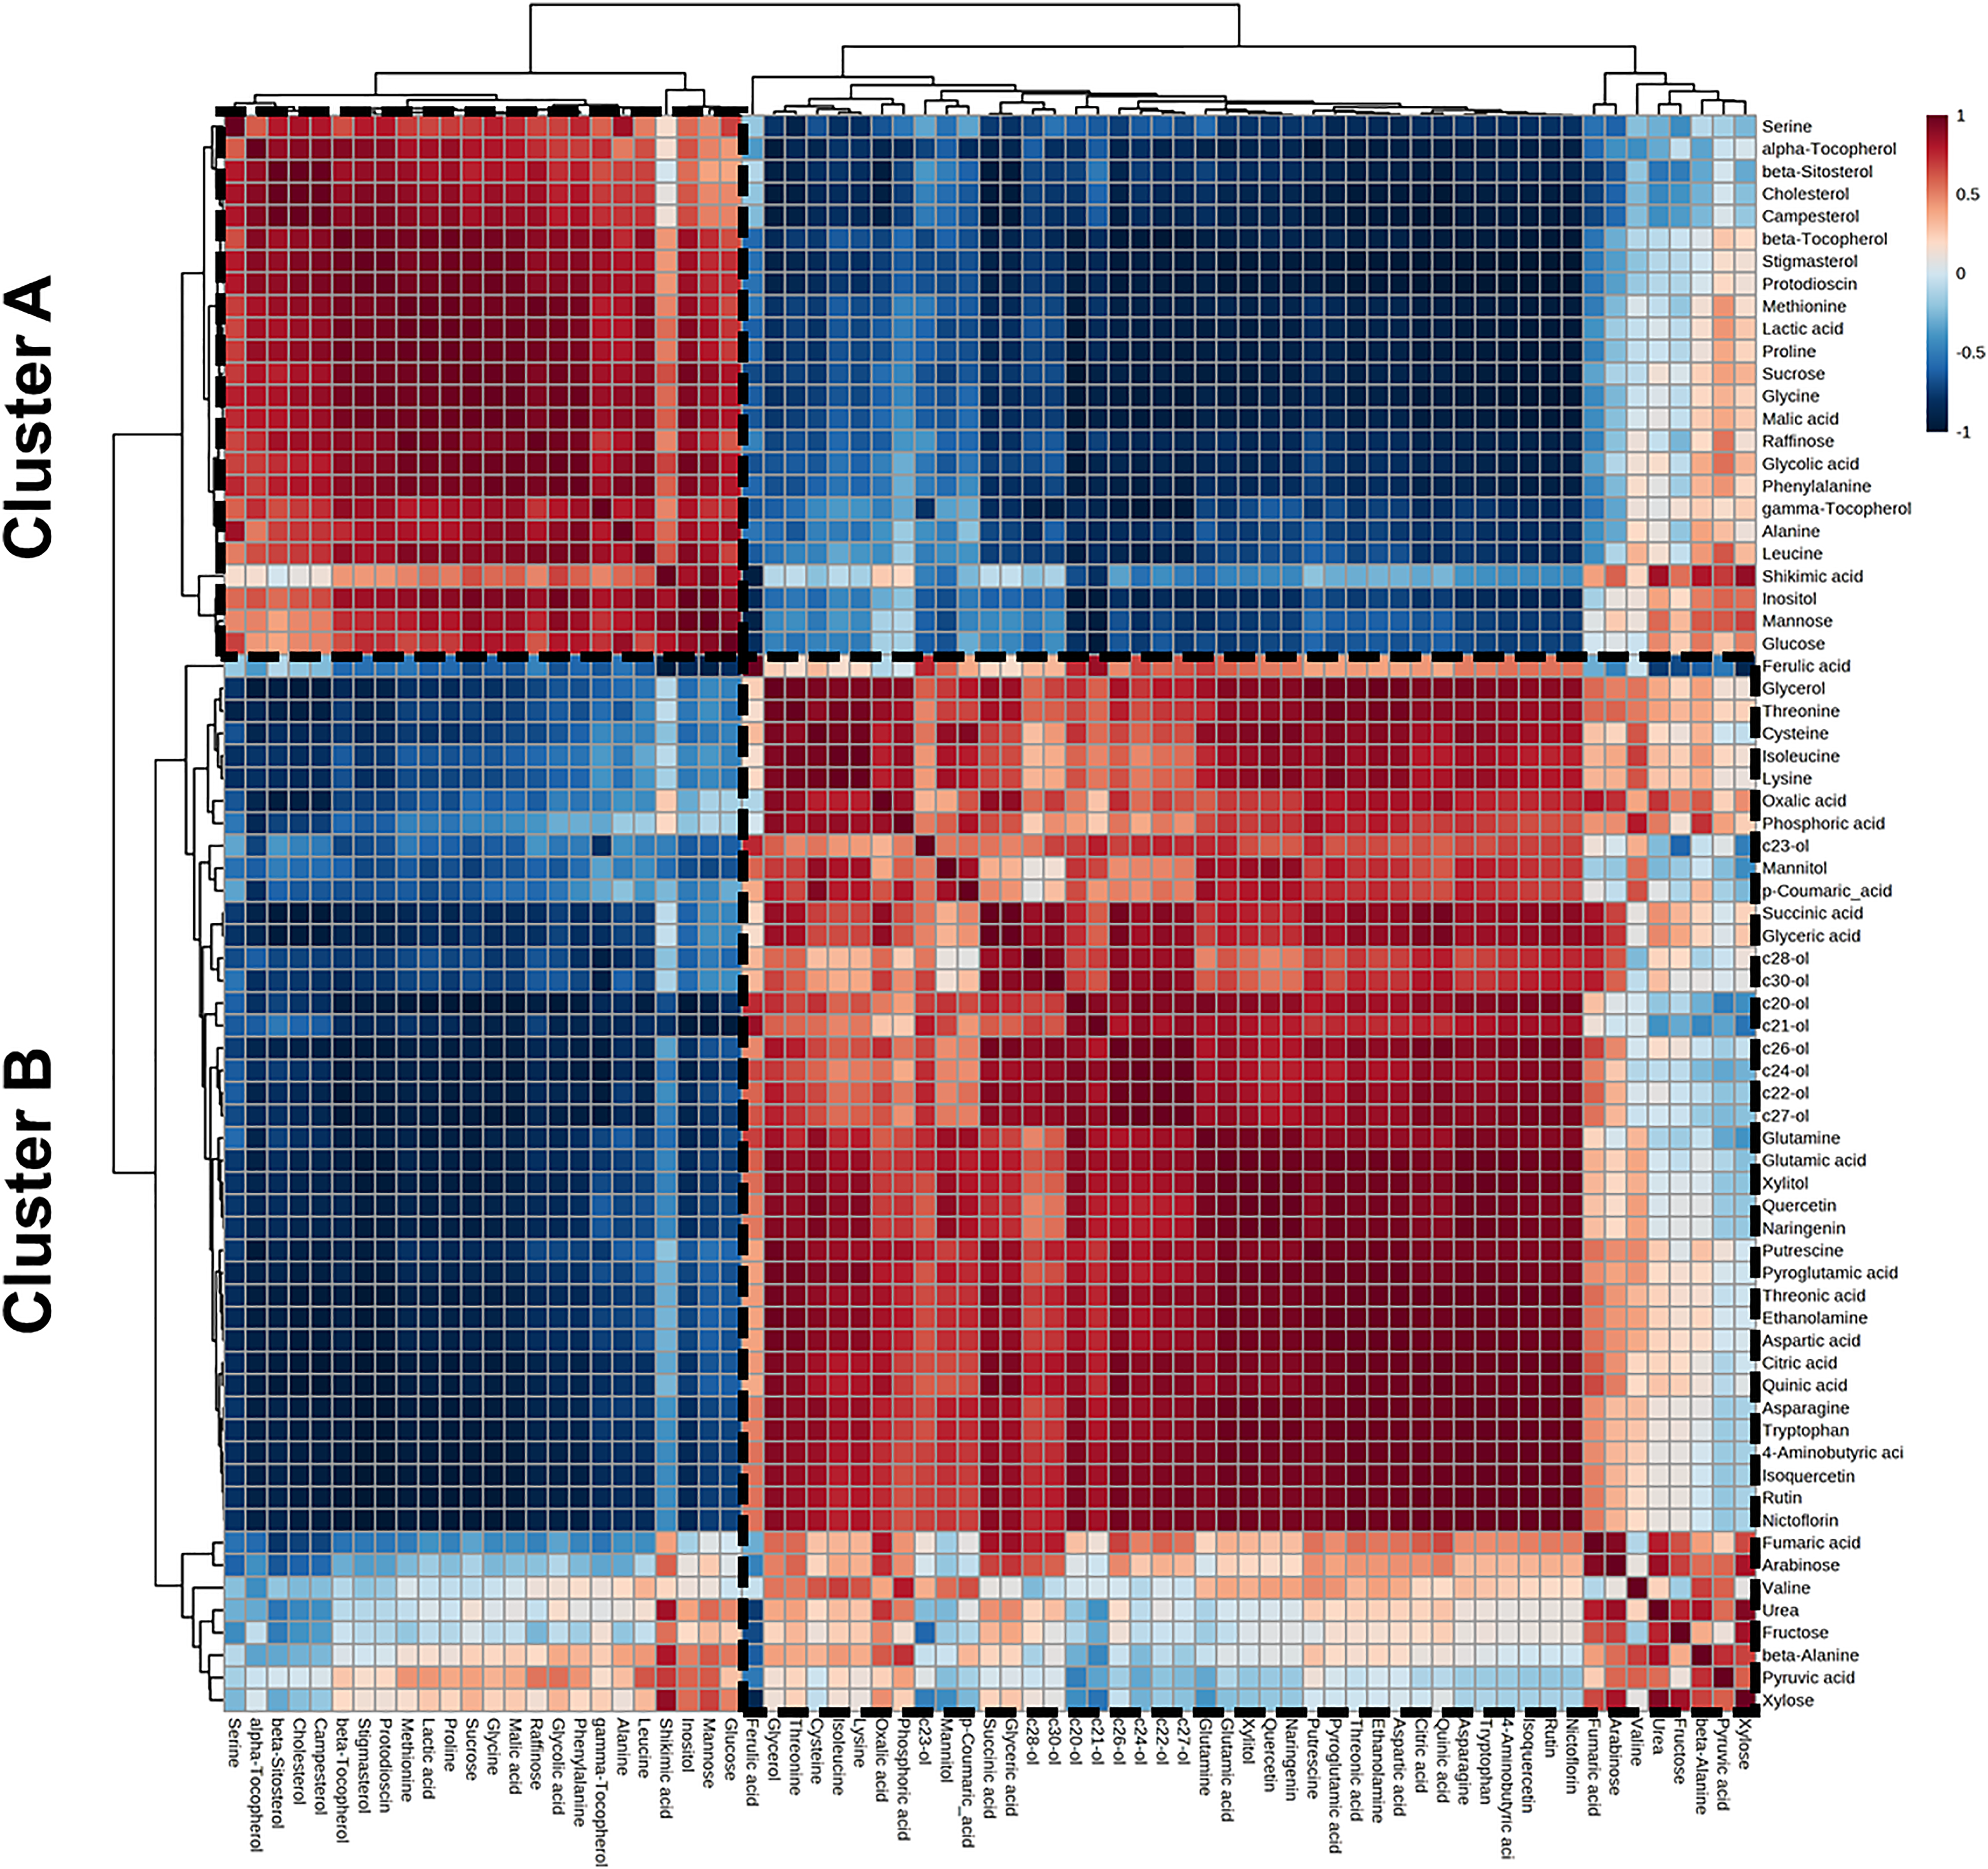
Correlation matrix of 71 metabolites in green and white asparaguses. Each square indicates a Pearson's correlation coefficient for a pair of compounds. The value for the correlation coefficient is represented by the intensity of the blue or red color, as indicated on the color scale. Hierarchical clusters are presented as a cluster tree.
Pathway Analysis
To perform biological interpretation of the results from multivariate statistical analyses, PathVisio was used to visualize the metabolite profile data in metabolic pathway diagrams (Figure 5). The metabolite profile data were transformed using unit variance scaling, which sets the standard deviation of all variables to 1, and thus makes all variables equal to the data scale to discriminate metabolic changes according to their colors (Table S1).
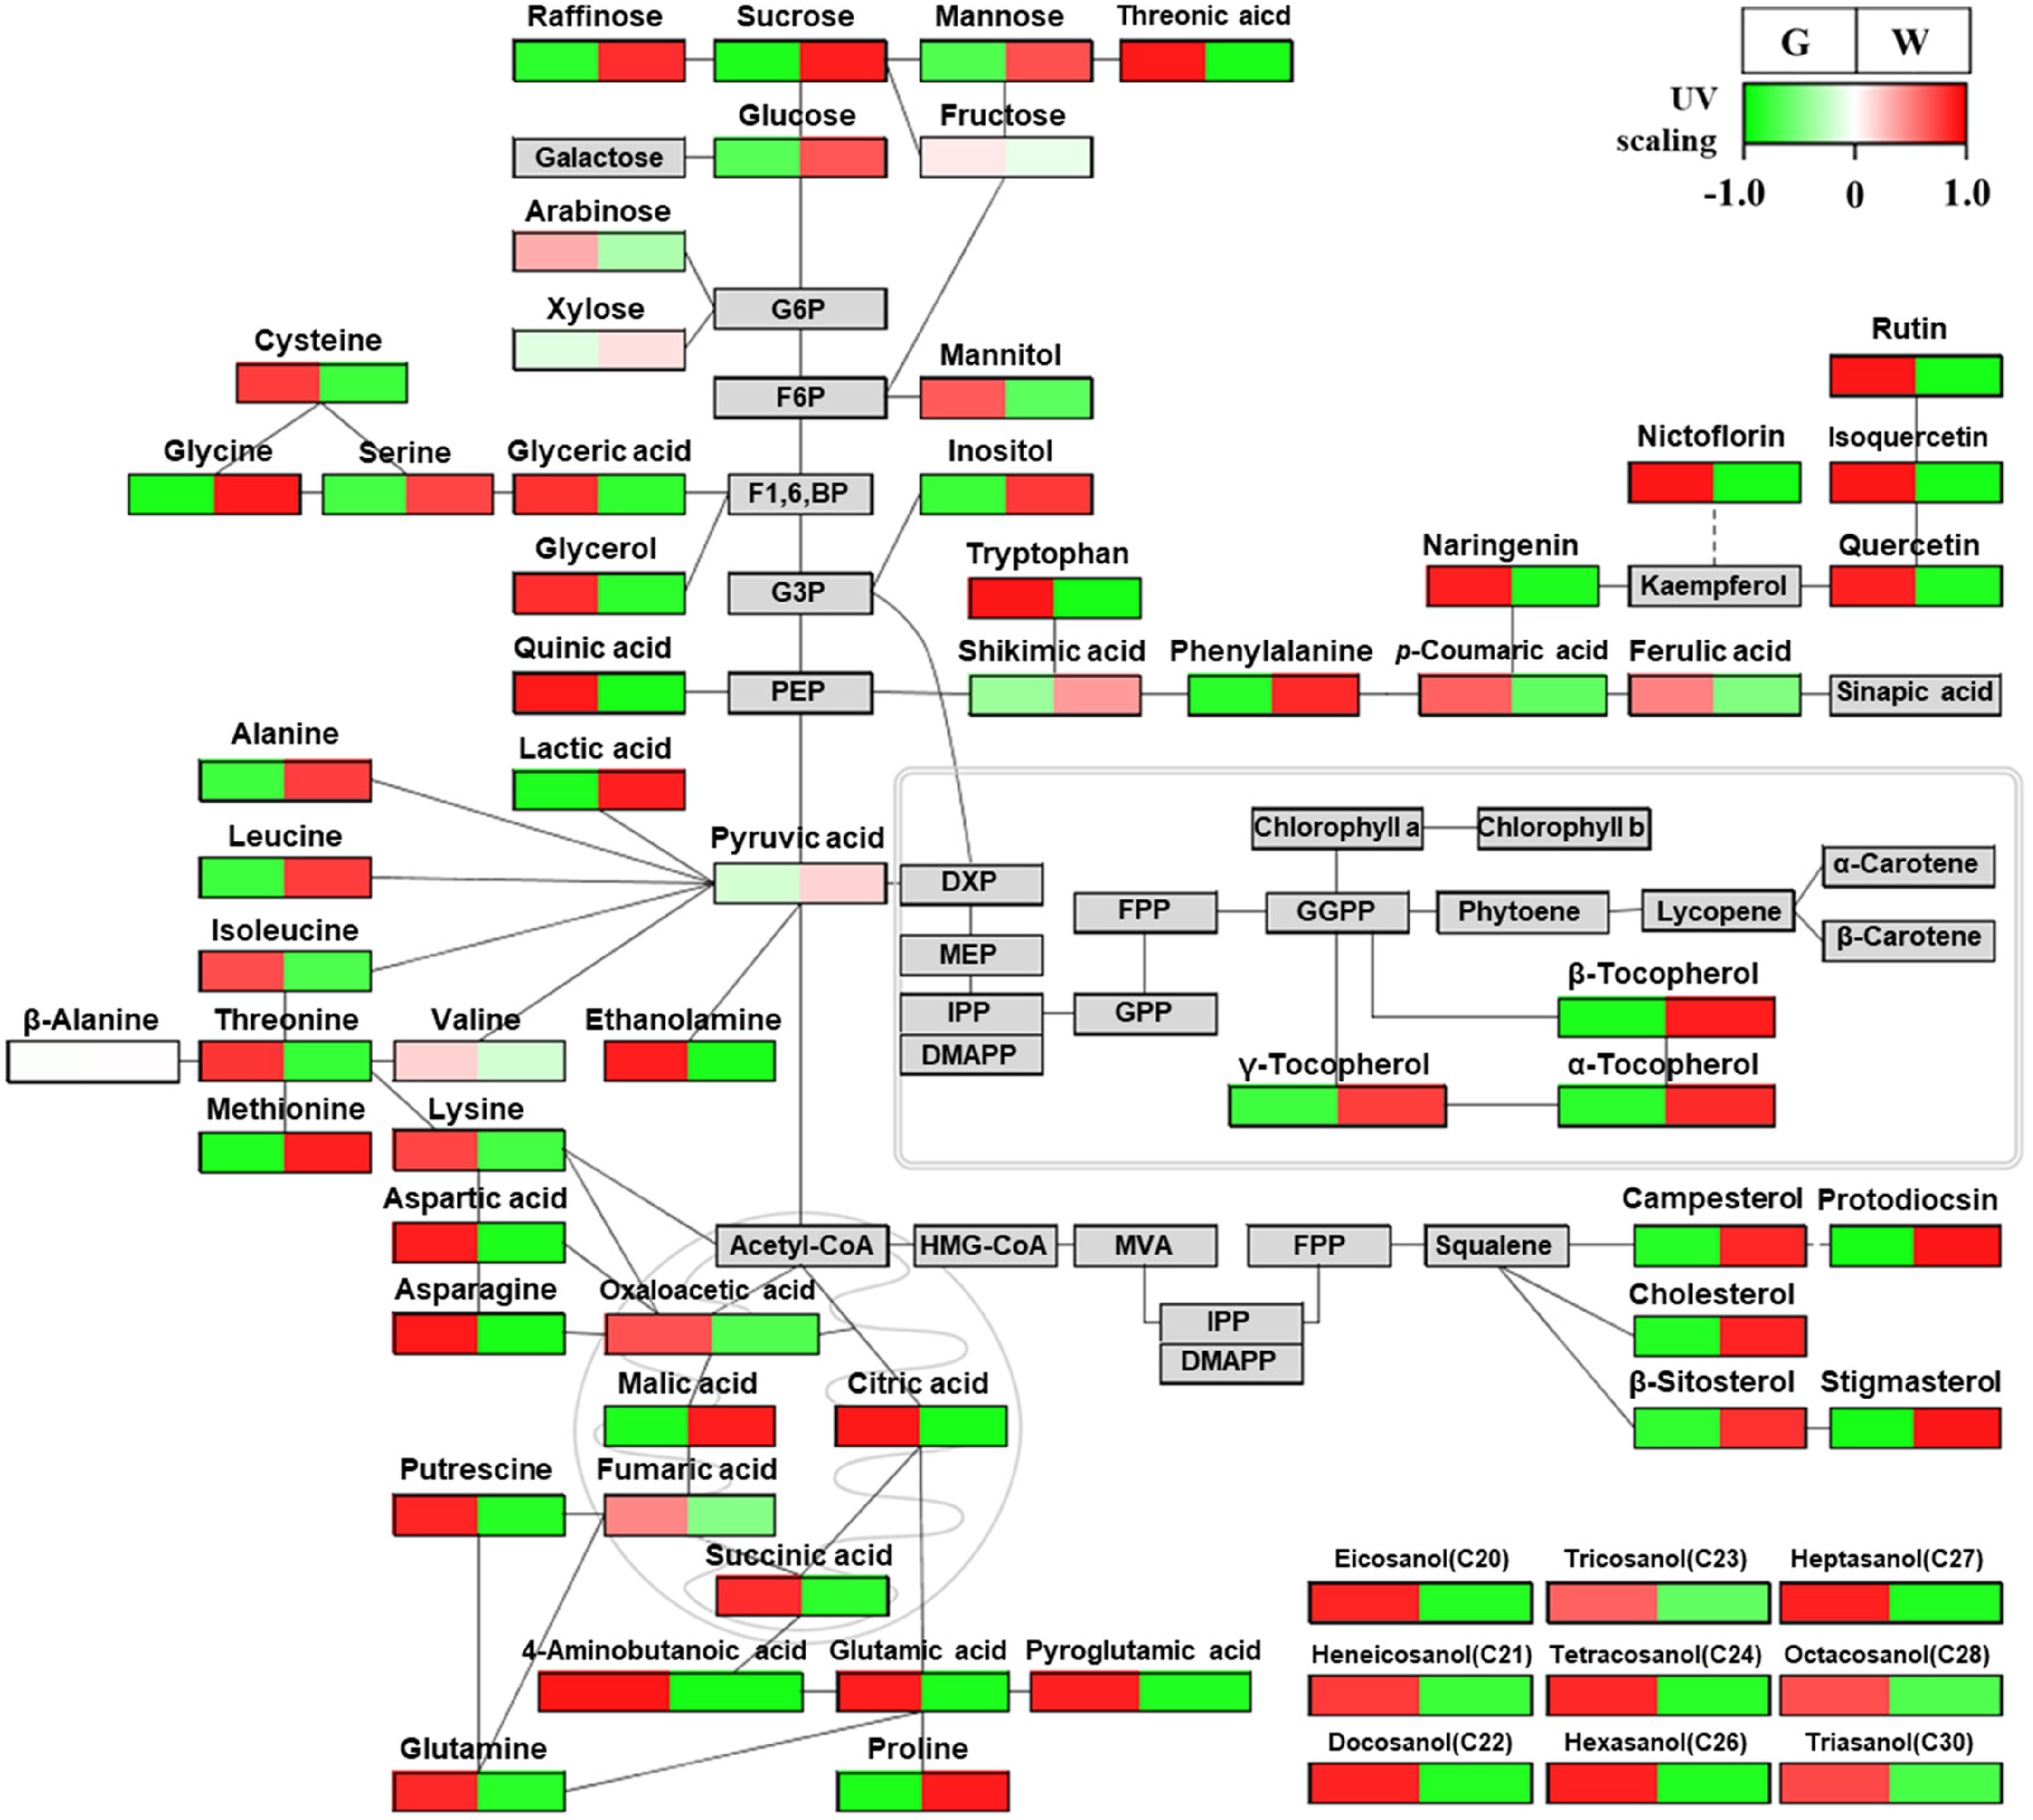
Metabolic pathway diagrams of green and white asparaguses visualized by PathVisio 3.
In the shikimate-phenylalanine biosynthesis pathway, most phenolic acids and flavonoids increased in green asparagus (Figures 3 and 5). However, the precursors of phenolic acids and flavonoids, such as shikimic acid and phenylalanine, were higher in white asparagus than green asparagus. These results are consistent with the multivariate statistical results, which indicated that phenolic acids and flavonoids were negatively correlated with shikimic acid and phenylalanine (Figure 4). Furthermore, in the PCA, phenolic acids and flavonoids were significant contributing metabolites in green asparagus, whereas shikimic acid and phenylalanine were important metabolites in white asparagus (Figure 2). The shikimate-phenylalanine biosynthesis pathway starts with shikimic acid and proceeds to phenylalanine and p-coumaric acid (Figure 5). Subsequently, phenolic acids and flavonoids are biosynthesized via the phenylpropanoid pathway. As shown in Figure 5, the metabolites involved in the rutin biosynthesis pathway, such as p-coumaric acid, naringenin, quercetin, isoquercetin, and rutin, were higher in green asparagus than in white asparagus. Previously, we reported that 57 genes were identified related to the phenylpropanoid pathway in green and white asparaguses. 18 Twelve of these genes showed more than a fourfold difference in expression between green and white asparagus. These genes were identified as PAL, C4H, 4CL, CHS, CHI, F3H, FLS, and F3’H. Notably, among the enzyme genes, F3’H was detected only in green asparagus. In addition, we previously suggested that the high expression of F3’H in green asparagus could be vital in increasing its rutin content. However, minimal information is available on the metabolites related to these biosynthetic genes in the shikimate-phenylalanine biosynthesis pathway of asparagus. Therefore, these results revealed a relationship between gene expression (transcriptome) and flavonoid synthesis (metabolome) in asparagus.
The representative terpenoid in asparagus is protodioscin, a member of the steroidal sapogenin family synthesized from cholesterol. 18 In the terpenoid biosynthesis pathway, the levels of most terpenoids, such as tocopherols, phytosterols, and protodioscin, were higher in white asparagus than in green asparagus (Figure 5). These results were consistent with the PCA results, indicating that tocopherols, phytosterols, and protodioscin were significant metabolites in white asparagus (Figure 3). Furthermore, tocopherols, phytosterols, and protodioscin showed strong positive correlations in Pearson's correlation analysis (Figure 4). The terpenoid biosynthesis pathway is divided into the methylerythritol 4-phosphate (MEP) and mevalonic acid (MVA) pathways, which occur in the chloroplast and cytoplasm, respectively.18,20 Phytosterols are synthesized via the MVA pathway. The MVA pathway is a terpenoid pathway in squalene. 32 In contrast, tocopherols are synthesized via the MEP pathway. 32 The MEP pathway uses GGPP as a precursor to synthesize photosynthetic pigments (carotenoids and chlorophylls) and tocopherols. 33 White asparagus plants were cultivated under light-free conditions. Extending the relevance of these findings, we suggest that GGPP, which does not need to produce pigments, increases tocopherol synthesis, thereby increasing tocopherol content in white asparagus. Conversely, green asparagus has a low tocopherol content owing to the synthesis of green photosynthetic pigments and shows high primary metabolism through photosynthesis. Furthermore, we reported that 29 and 21 genes, which were included in the MVA and MEP pathways, respectively, were highly expressed in green and white asparaguses. 18 In particular, MVK, DXR, MCT, MDS, and HDR, which are involved in the MEP pathway, were only found in green asparagus. These results provide evidence for the high synthesis of photosynthetic pigments (ie, carotenoids). In contrast, white asparagus exhibited high gene expression of the MVA pathway. These genes may play essential roles in phytosterol and protodioscin synthesis. The above findings on the relationship between the transcriptome and the metabolome were based on the same asparagus cultivar (Asparagus officinalis cv. Atlas). However, a limitation is that they were harvested at different times and in different growing environments. Therefore, integrated analyses of transcripts and metabolites from the same plant will be needed in future studies.
The amino acid metabolism related to glycolysis and the TCA cycle showed a greater increase in green asparagus than in white asparagus, with the exception of glycine, serine, alanine, leucine, methionine, and proline levels. In addition, the levels of most organic acids in the TCA cycle, except for malic acid, were higher in green asparagus than in white asparagus. However, most sugars were present at higher levels in white asparagus than in green asparagus. These results suggest that green asparagus has higher energy and amino acid metabolism for plant development and growth through photosynthesis under light conditions than white asparagus. Many light-related genes encoding light-regulated proteins, photosystem I reaction center subunits, and chlorophyll A/B binding proteins, are highly expressed in green asparagus. 18 The expression levels of these genes change depending on light conditions. 18 In addition, amino acid metabolism was more active under light than dark conditions. 34 These observations are consistent with the findings of the present study.
White asparagus accumulates stress-related metabolites such as sucrose, proline, and phenylalanine, normally related to oxidative stress. 35 Light is an environmental factor that causes oxidative damage by generating reactive oxygen species (ROS). 36 To scavenge ROS, stressed plants produce antioxidant enzymes, such as superoxide dismutase (SOD), peroxidase (POD), and catalase (CAT). These results suggest dark cultivation conditions induce oxidative stress in white asparagus plants. Thus, white asparagus releases oxidative stress by synthesizing antioxidants, such as tocopherols and phytosterols.
The sulfur-containing compounds in asparagus play a prominent role in its flavor and fragrance attributes. 1 Several sulfur-containing volatiles have been identified as contributors to the representative asparagus flavor. Most of these volatiles were found in white asparagus. 1 Therefore, white asparagus is appreciated by consumers because of its flavor and aroma compared to green asparagus. 37 In this study, most amino acids showed higher levels in green asparagus than white asparagus. However, the methionine levels were higher in white asparagus than green asparagus (Figure 5). Sulfur-containing volatiles are most commonly formed from methionine. 38 These results suggest that sulfur-containing volatile metabolism may be more active in white than green asparagus.
Conclusions
In summary, 71 metabolites, including amino acids, organic acids, sugars, sugar alcohols, phenolic acids, terpenoids, policosanols, and flavonoids, were identified in green and white asparagus samples. Green asparagus showed high energy and amino acid synthesis under light cultivation conditions for plant development and growth by photosynthesis. In contrast, white asparagus accumulated stress-related metabolites in a lightless cultivation environment. Furthermore, flavonoid synthesis was activated upon exposure to light, whereas terpenoid biosynthesis was activated under dark culture conditions. Comparing the antioxidant capacities of green and white asparagus, the DPPH and ABTS scavenging activities were at least twice as high as those of white asparagus. The results of this study provide metabolomic information to elucidate the cultivation condition-specific metabolism of asparagus and information for evaluating antioxidant properties.
Supplemental Material
sj-docx-1-npx-10.1177_1934578X241238922 - Supplemental material for A Comprehensive Metabolite Profile of Green and White Asparagus (Asparagus officinalis L.) and Their Antioxidant Properties in Differing Cultivation Conditions
Supplemental material, sj-docx-1-npx-10.1177_1934578X241238922 for A Comprehensive Metabolite Profile of Green and White Asparagus (Asparagus officinalis L.) and Their Antioxidant Properties in Differing Cultivation Conditions by Tae Jin Kim, Young Jin Park, Tae Gyu Yi, Woo Duck Seo, Nam Il Park and Jae Kwang Kim in Natural Product Communications
Footnotes
Authors’ Contributions
TJK carried out the experiments, prepared most of the data, and wrote the paper; YJP carried out statistical analysis and wrote the paper; TGY carried out the experiments and wrote the paper; WDS reviewed and edited the paper; JKK and NIP managed the research process, and reviewed and edited the paper. All authors read and approved the final manuscript.
Declaration of Conflicting Interests
The authors declared no potential conflicts of interest with respect to the research, authorship, and/or publication of this article.
Ethical Approval
Not applicable.
Funding
The author(s) disclosed receipt of the following financial support for the research, authorship, and/or publication of this article: This work was supported by a grant from the Nakdonggang National Institute of BiologicalResources (NNIBR), funded by the Ministry of Environment (MOE) of the Republic of Korea (NNIBR20243112), and “Cooperative Research Program for Agriculture Science & Technology Development (Project No. PJ01706903)” funded by the Rural Development Administration (RDA), Republic of Korea.
Statement of Human and Animal Rights
Not applicable.
Statement of Informed Consent
Not applicable.
Supplemental Material
Supplemental material for this article is available online.
References
Supplementary Material
Please find the following supplemental material available below.
For Open Access articles published under a Creative Commons License, all supplemental material carries the same license as the article it is associated with.
For non-Open Access articles published, all supplemental material carries a non-exclusive license, and permission requests for re-use of supplemental material or any part of supplemental material shall be sent directly to the copyright owner as specified in the copyright notice associated with the article.