
Abstract
Mychonastes sp. 247 is a newly isolated freshwater microalga. Mychonastes sp. 247 methanolic extract (ME) suppresses the growth of A549 human non-small-cell lung cancer (NSCLC) cells. However, the underlying mechanism of this anticancer effect remains unclear. The present study aimed to reveal the underlying mechanism of the anticancer effect of ME in A549 cells. The components of ME, their cytotoxicity in normal cells, and their inhibitory effect on the growth and migration of two-dimensional and three-dimensional cultured cancer cells were investigated. We also showed that ME upregulated the mRNA levels of signaling receptors and transporters of retinol (STRA6) and cytochrome P450 family 26 subfamily B member 1, and increased the protein expression of phosphorylated c-Jun N-terminal kinase, B-cell lymphoma protein 2/(Bcl-2)-associated X (Bcl-2/Bax), and cleaved caspase-3. Moreover, co-treatment with N-acetyl-L-cysteine reversed the ME-induced changes in the levels of STRA6 and reactive oxygen species (ROS), confirming their role in the ME-mediated anticancer effect. To the best of our knowledge, this is the first study elucidating the pathway by which ME induces anticancer effects in lung cancer cells. Our results reveal that ME induces NSCLC apoptosis by regulating ROS levels via the STRA6 pathway, suggesting ME as a prospective anticancer agent for lung cancer treatment.
Introduction
According to the increasing demand for alternative compounds to chemical products, bioactive compounds have received attention for their therapeutic potential while having fewer side effects than some chemicals currently in use. 1 Aquatic plants, such as microalgae, are great sources of diverse bioactive compounds. 2 Presently, research on the role of microalgae has largely expanded to the medical field, such as anti-inflammatory, 3 anticancer, and antioxidant-related areas. 4 The anticancer properties of extracts from freshwater algae have been reported, such as the effect of Chlorella vulgaris on HeLa cells and those of Chlorella sorokiniana on non-small-cell lung cancer (NSCLC) cells.5,6 However, the potential therapeutic uses of approximately 72 500 algae species still remain unexplored. 7
Mychonastes sp. 247 is a freshwater microalga newly isolated from Jeju-do, Korea. Mychonastes are a species of the genus Mychonastes, which has been characterized by oval, spheroid or elliptical-shaped algae living in single units or in small crowds, 8 and studied regarding its lipid and carotenoid content.9,10 We have previously found that Mychonastes sp. 247 methanolic extract (ME) suppresses the growth of human NSCLC cells. This study aimed to further elucidate the therapeutic activity of ME, as the underlying mechanism of its anticancer effect remains unclear.
Lung cancer is the second most common cancer globally, with approximately 2.3 million new cases reported every year. 11 The 5-year survival rate of lung cancer is approximately 19%, making it the leading cause of cancer mortality in both men and women. 12 NSCLC accounts for 85% of all lung cancer cases. 13 Many patients with advanced lung cancer undergo platinum-based chemotherapy as standard treatment 14 ; however, prolonged treatment often results in drug resistance, resulting in tumor recurrence and treatment failure, especially in NSCLC cells. 15 Therefore, the development of more effective treatments is necessary to improve the prognosis of patients with lung cancer.
Reactive oxygen species (ROS) play vital roles in cell survival, proliferation, and migration. ROS interact closely with the tumor suppressor gene p53, and excessive ROS levels activate cell death-related signaling pathways. 16 This process involves the activation of mitogen-activated protein kinase (MAPK) signaling pathways, including p38, ERK, and c-Jun N-terminal kinase (JNK). ROS-induced cell death has been reported in NSCLC cells.17,18 A recent study has revealed the role of signaling receptors and transporters of retinol (STRA6), a retinoic acid-responsive gene, in ROS accumulation in cancer cells in response to DNA damage. 19 The present study aimed to reveal the underlying mechanism of the anticancer effect of ME on A549 cells, focusing on retinoic acid-related genes and proteins, as well as ROS levels.
Materials and Methods
Mychonastes sp. Cell Culture
Mychonastes sp. 247 was locally isolated from the Dumo-ri, Hangyeong-myeon, Jeju-si, and Jeju-do (Korea) and stored in the Freshwater Bioresources Culture Collection of Nakdonggang National Institute of Biological Resources (Sangju, Korea). The microalgal cells were cultivated in a BG11 medium containing 1.5 g/L of NaNO3, 0.04 g/L of K2HPO4, 0.075 g/L of MgSO4·7H2O, 0.036 g/L of CaCl2·2H2O, 0.006 g/L of citric acid, 0.006 g/L of ferric ammonium citrate, 0.001 g/L of ethylene diamine tetraacetic acid, 0.02 g/L of Na2CO3, and 1 mL of trace metal mix A5 solution. Seed cultures were maintained in 0.7-L bubble column photobioreactors (BC-PBRs) containing 0.5 L of fresh medium, incubated at 22 ± 1 °C, and irradiated at 100 µE/m2/s using 55-W fluorescent lamps with 5% (v/v) continuous CO2 bubbling at 0.1 vvm. Cultures were then scaled up to 2-L BC-PBRs under the same conditions as those used for the 0.5-L BC-PBRs. The culture medium was replaced with fresh BG11 medium every 10 days.
Preparation of ME
Mychonastes sp. 247 cells were harvested using Whatman No. 1 filter paper to prepare ME. The filtered cells were washed thrice with distilled water to remove residual ions and cell debris. For freeze-drying, the wet biomass was frozen overnight at −80 °C and lyophilized using a freeze dryer (FD8512; IlShinBioBase). Methanol (99.5%; Daejung) was added to dry cells (5 g) and sonicated using a sonicator (Powersonic 410; Hwashin Tech) for 20 min. The extract was allowed to react at RT for 1 day and then filtered (Whatman No. 2; Whatman International Ltd). The extract was concentrated using a rotary evaporator (N-2110; Eyela) and different concentrations (0, 1, 5, 10, and 20 μg/mL) were prepared using dimethyl sulfoxide (Sigma-Aldrich).
Quadrupole Time-of-Flight Mass Spectrometry and Spectral Interpretation for Sample Qualification
Quadrupole Time-of-Flight mass spectrometry was performed according to the procedures described in our previous study. 20 Briefly, liquid chromatography (LC) separation was performed with an Acquity I-Class UPLC (Waters Corp.) with an Acquity UPLC BEH C18 column (1.7 μm, 2.1 × 100 mm). A SYNAPT G2-Si system (Waters Corp.) with the MSe acquisition technique was used for MS detection. Leucine enkephaline was used as a lock mass, with an ESI+ capillary at 3 kV and ESI- at 2.5 kV. The scan mass range was set to 100-1500 m/z. Data acquisition was regulated using MassLynx 4.1 (Waters Corp.) and UNIFI1.8, with the traditional medicine library used in the processing procedure.
ME Composition
ME composition was quantified using Triple Quadrupole LC/MS (ESI) analysis. High-resolution mass spectrometry and the traditional medicine library were used to compare the quality of the ME, as shown in Table 1.
Quantification of Mychonastes sp. 247 Methanolic Extracts (ME) Compositions, Using High-Resolution Mass Spectrometer and Traditional Medicine Library.

Cell Culture
A549 cells were purchased from the American Type Culture Collection and cultured in RPMI 1640 (w: stable Glutamine, 2.0 g/L NaHCO3
Cell Viability Assay
A549 cells and hMSCs were seeded in 12-well plates at a density of 7 × 10⁴/mL and incubated overnight before treatment with ME for 24, 48, and 72 h. The LUNA-II Automated Cell Counter (Logos Biosystems) was used to quantify the number of viable cells. Images were captured using an Eclipse Ti2-U inverted microscope (Nikon) to observe morphological changes.
Three-dimensional Spheroid Culture
Cancer cell spheroids were formed by seeding 500 cells onto 96-well ultra-low attachment microplates, followed by immediate centrifugation at 2000 r/min for 5 min. Treatment with ME at different concentrations ranging from 10 to 200 µg/m was performed, after 3 days of incubation to allow for proper spheroid development and fresh ME-containing medium was added to the wells every 3 days to ensure a sufficient supply of FBS. Changes in spheroid size were determined using NIS-Elements imaging software (Nikon).
Transwell Migration Assay
The effect of ME on cell migration was investigated using 8.0 µm diameter low protein-binding Transwell inserts (Falcon; Corning Inc.). A549 cells (5 × 10⁴) diluted in serum-free media were seeded onto the upper chamber, and ME at various concentrations was added to the 24-well plates. After 24 h of incubation, cells were fixed with 4% paraformaldehyde (Sigma-Aldrich) and stained with Giemsa (Sigma-Aldrich) for the detection of successfully migrated cells.
ROS Measurement
A549 cells were seeded in 6-well plates (5 × 10⁴ cells/mL) and incubated for 24 h before exposure to 247, H2O2, or N-acetylcysteine (NAC). After 24 h of treatment, cells were stained with 10 mM DCFDA diluted in a medium for 30 min. The changes in ROS levels were detected using a Guava easyCyte system (MilliporeSigma) by DCFDA staining.
RNA Sequencing
Quality assessment was performed on the extracted RNA using the Agilent 2000 bioanalyzer (Agilent Technologies). The library was generated using the NEBNext Ultra II Directional RNA-Seq Kit (New England Biolabs). Next, the isolated mRNA was fragmented and synthesized using a Poly(A) RNA Selection Kit (Lexogen). Illumina indexes 1-12 were used for indexing.
Quality control of the raw sequencing data was performed using FastQC (https://www.bioinformatics.babraham.ac.uk/projects/fastqc/) and HiSeq X 10 (Illumina) for high-throughput paired-end 100 sequencing. The reads were connected to the reference genome using TopHat 21 and the expression levels were based on the Fragments Per Kilobase Million (FPKM) mapped reads from Cufflinks. 22 EdgeR (R Development Core Team, 2016) and ExDEGA (E-biogen, Inc.) were used for quantile normalization, mining, and graphical visualization of the results. A more detailed description was provided in our previous study. 23
Gene Ontology-Based Network Analysis
The STRING database (http://string-db.org/) was used to evaluate the biological functions of the genes with ≥2-fold change following treatment with ME Analysis of the interaction networks was performed based on Gene Ontology (GO) terms. To obtain highly associated pathways, network generation was optimized based on the obtained expression profiles. We investigated 25,737 unique genes and identified 10 differentially expressed genes, among which 7 were upregulated and 3 were downregulated. These genes were categorized according to their biological features and roles in cancer cell proliferation using the ExDEGA program. 24 Multiple Experiment Viewer (MeV) tool and hierarchical cluster analysis were used to evaluate cell proliferation-related genes regulated with ≥2-fold expression changes in ME-treated A549 cells.
Cell Lysis and Immunoblotting
Whole cell lysates were prepared using a mixture of mammalian cell lysis buffer (GE Healthcare) and phosphatase inhibitor cocktail (Sigma-Aldrich). Proteins denatured at 95 °C for 5 min were separated by SDS PAGE gels were blotted onto polyvinylidene difluoride membranes using a 10× Cooling-Free Wet Transfer Buffer (Translab Technologies). Membranes were blocked for 1 h in 5% skim milk diluted in Tris-buffered saline with Tween-20 (TBST) and washed with TBST, incubated with the primary antibodies overnight at 4 °C, and then incubated with the corresponding secondary antibodies for 1 h at room temperature. Protein bands were imaged using the ChemiDoc MP system (Bio-Rad Laboratories), using the Immobilon Forte Western HRP substrate (MilliporeSigma). Primary antibodies were purchased from Abcam (Stra6), Santa Cruz Biotechnology (p53, ERK, p-ERK, and p-JNK), and Cell Signaling Technology (B-cell lymphoma protein 2-associated X [Bax], B-cell lymphoma protein 2 [Bcl-2], PARP, cleaved PARP, Caspase-3, Cleaved caspase-3, JNK, p-p38, p38, and GAPDH). Anti-rabbit and anti-mouse antibodies were purchased from Cell Signaling Technology.
Statistical Analysis
Statistical analyses were performed using GraphPad Prism software (GraphPad). Results are expressed as the mean ± standard error of the mean. Tukey's test was used to calculate the significance level of the data. Statistical significance was set at P < .05.
Results
Analysis of the Components of ME
We investigated the components of ME based on a traditional medicine library (Figure 1 and Table 1). Positive and negative (ES+, ES−) electrospray ionization TOF mass spectrometry was performed to detect both the positively and negatively charged components. The results showed that β-sitosterol tetra-O-acetyl-β-D-glycopyranoside, Azedarachin C, and glycocholic acid had the highest response values.

Analysis of the components in Mychonastes sp. 247 ME. Quadrupole time-of-flight mass spectrometry and spectral interpretation for the qualification of ME. The composition of ME was assessed by Triple Quadrupole LC/MS (ESI) analysis. Abbreviations: ME, methanolic extract; LC/MS, liquid chromatography/mass spectrometry.
Treatment With ME Suppresses the Growth of A549 Cells in Two-dimensional and Three-dimensional Culture Conditions
The effect of ME on the viability of A549 cells after 24, 48, and 72 h of treatment is shown in Figure 2A and B. On all 3 days of observation, exposure to 50 and 100 µg/mL ME significantly decreased the cell viability, and 20 µg/mL of ME also decreased the cell viability at 24 and 48 h. Moreover, although the number of viable cells remained above 70% after 24 h of treatment with 100 ug/mL ME, longer exposure times reduced the viability to approximately 40%. These results indicate that ME suppresses cell viability in a dose- and time-dependent manner.

Cytotoxic effects of Mychonastes sp. 247 ME in 2D and 3D culture conditions. After exposure to Mychonastes sp. 247 extract for 24, 48, and 72 h, (A) the morphological changes and (B) viability of A549 cells were observed. Identical experiments were performed on hMSCs. (C) The morphological changes and (D) cell viability of hMSCs were determined. (E) Representative microscopic images of A549 3D spheroids on days 0, 3, 6, and 10 of treatment. Cells were cultured for 4 days post-seeding to allow spheroid formation before drug treatment. Scale bar = 250 μm. (F) Quantitative analysis of spheroids on days 0, 3, 6, and 10 of treatment. Data are presented as the mean ± standard error of the mean of 3 independent experiments. . Abbreviations: ME, methanolic extract; HMSC, human mesenchymal stem cell; 2D, two-dimensional; 3D, three-dimensional. *P < .05, **P < .01, and ***P < .0001.
We evaluated the morphological changes in response to treatment with ME and observed that in untreated cells, the cells remained intact in an epithelial-like form, showing increased confluency, whereas under ME conditions, the cells began to detach from the surface, presenting a round morphology. Decreased cell viability was also evident in the changes in cell confluency after treatment with ME. Identical experiments were performed on hMSCs to investigate the effects of ME on normal cells (Figure 2C and D), and no significant changes in cell viability or confluency were observed until 72 h of treatment, indicating that ME had distinctively low toxicity on hMSCs compared to A549 cells.
To better determine how ME disrupts cancer cells in a three-dimensional (3D) environment, 3D spheroid culture was performed (Figure 2E). After 3 days of incubation, when the cells formed spheroids with an average size of 108.7 mm2, they were treated with different concentrations of ME (day 0). On day 3, the untreated spheroids reached an average of 135.5 mm2 in size whereas those exposed to 50, 100, and 200 µg/mL of ME had an average size of 124.4, 113.3, and 114.9 mm2, respectively, exhibiting a significant difference (P = .0083) from the untreated control. The spheroids displayed significantly smaller sizes under all treatment conditions after 6 days of treatment, and this suppressive effect continued until day 10. Compared to day 0, the increase in size on day 10 was 227.1% in the untreated spheroids whereas only a 48.5% increase was achieved when the spheroids were treated with 200 µg/mL of ME. Residues of disintegrated cells around the spheroids were also apparent, especially at higher concentrations. In sum, our findings confirmed the inhibitory effect of ME on the growth of two-dimensional (2D) and 3D cultured cancer cells, while exhibiting considerably lower levels of toxicity on normal cells.
ME Suppresses the Migration Abilities of A549 Cells
We performed Transwell migration assays to determine the effect of ME treatment on cell migration (Figure 3). Images of successfully migrated cells after 24 h of treatment with ME are presented in Figure 3A, which shows that Giemsa-stained cell density decreased in a concentration-dependent manner. Moreover, treatment with ME at 10 and 20 µg/mL significantly suppressed the migration of A549 cells to the lower chamber of the Transwell (Figure 3B). These results suggest that ME treatment hinders the migration ability of A549 cells.
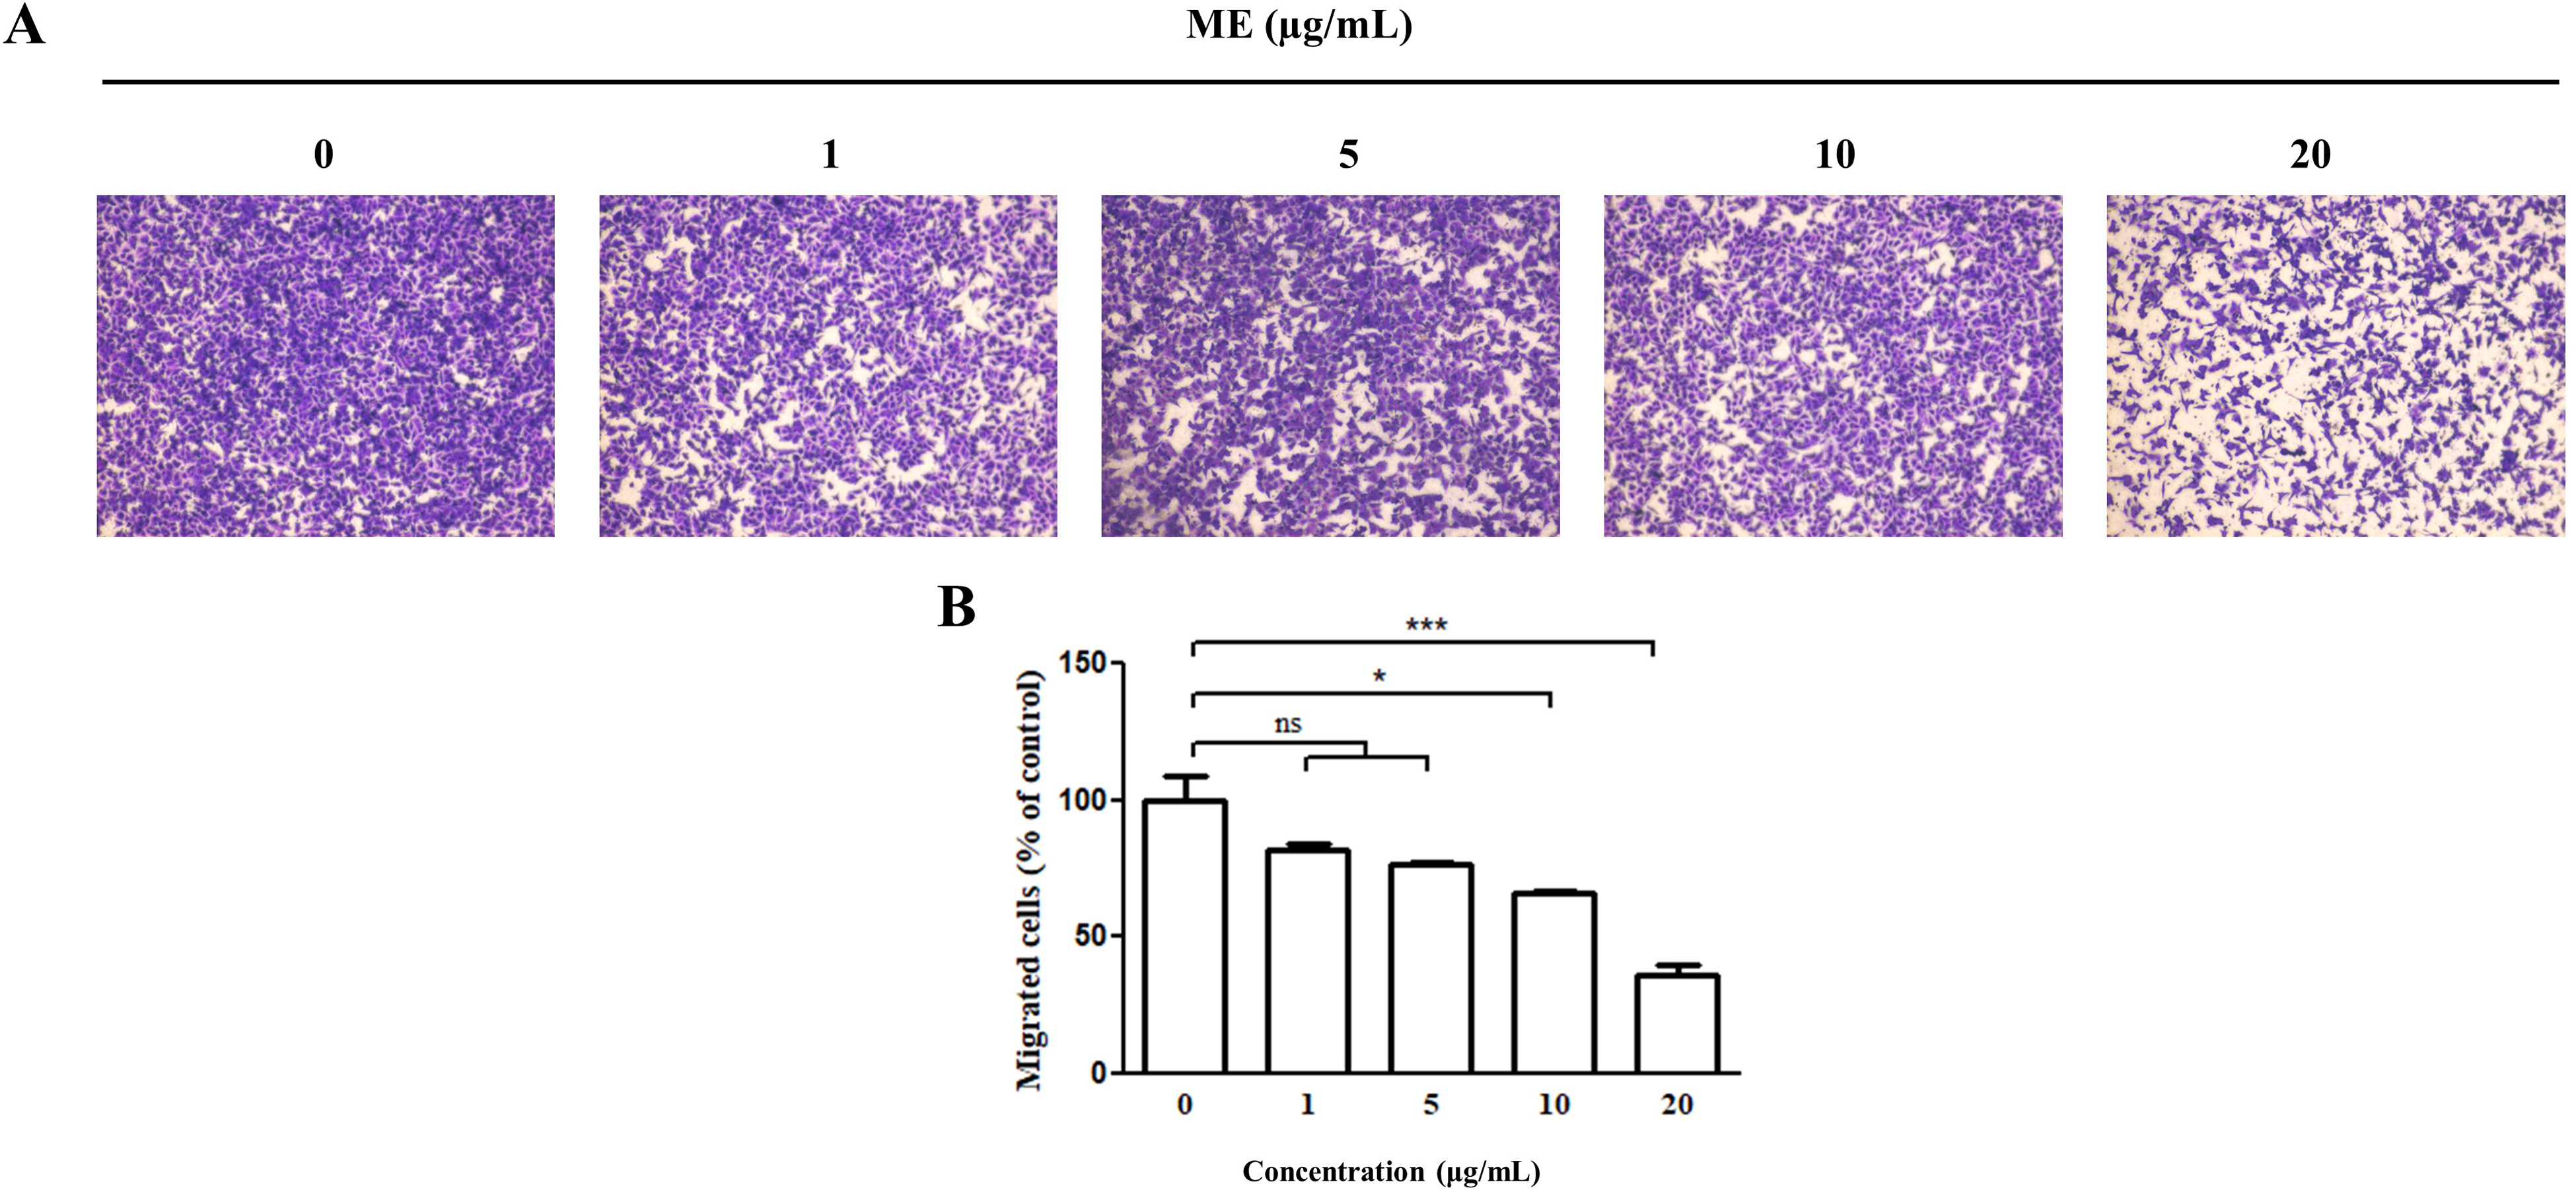
Effect of Mychonastes sp. 247 methanolic extracts (ME) on A549 cell migration. Transwell migration assay of ME-treated cells. Cells were visualized using Giemsa staining. Data are presented as the mean ± standard error of the mean of 3 independent experiments. *P < .05 and **P < .01 versus control cells.
ME Alters the Gene Expression of A549 Cells
We investigated the underlying mechanism of the effect of ME in lung cancer cells using RNA sequencing. Figure 4A shows the changes in the expression levels of genes in A549 cells after treatment with 100 µg/mL ME for 24 h. We investigated 25, 737 unique genes and identified 10 differentially expressed genes, among which 7 were upregulated and 3 were downregulated (Figure 4A). The identified genes included signaling receptor and transporter of retinol (Stra6), cytochrome P450 family 26 subfamily B member 1, and cytochrome P450 family 2 subfamily S member 1 (CYP2S1). Furthermore, protein-protein interactions were predicted based on the STRING database using GO terms (Figure 4B and C). Pathways related to vitamin A response (GO:0033189; false discovery rate (FDR)-adjusted P = .0397), retinoic acid 4-hydroxylase activity (GO:0008401; FDE-adjusted P = .0168), oxygen-containing compound (GO:19011700; FDR-adjusted P = .0034), retinol transmembrane transporter activity (GO:0034632, FDR-adjusted P = .0023), and retinol metabolism (hsa00830; FDR-adjusted P = .0023) were identified. Subsequently, we proceeded to determine the changes in the levels of the relevant proteins identified.
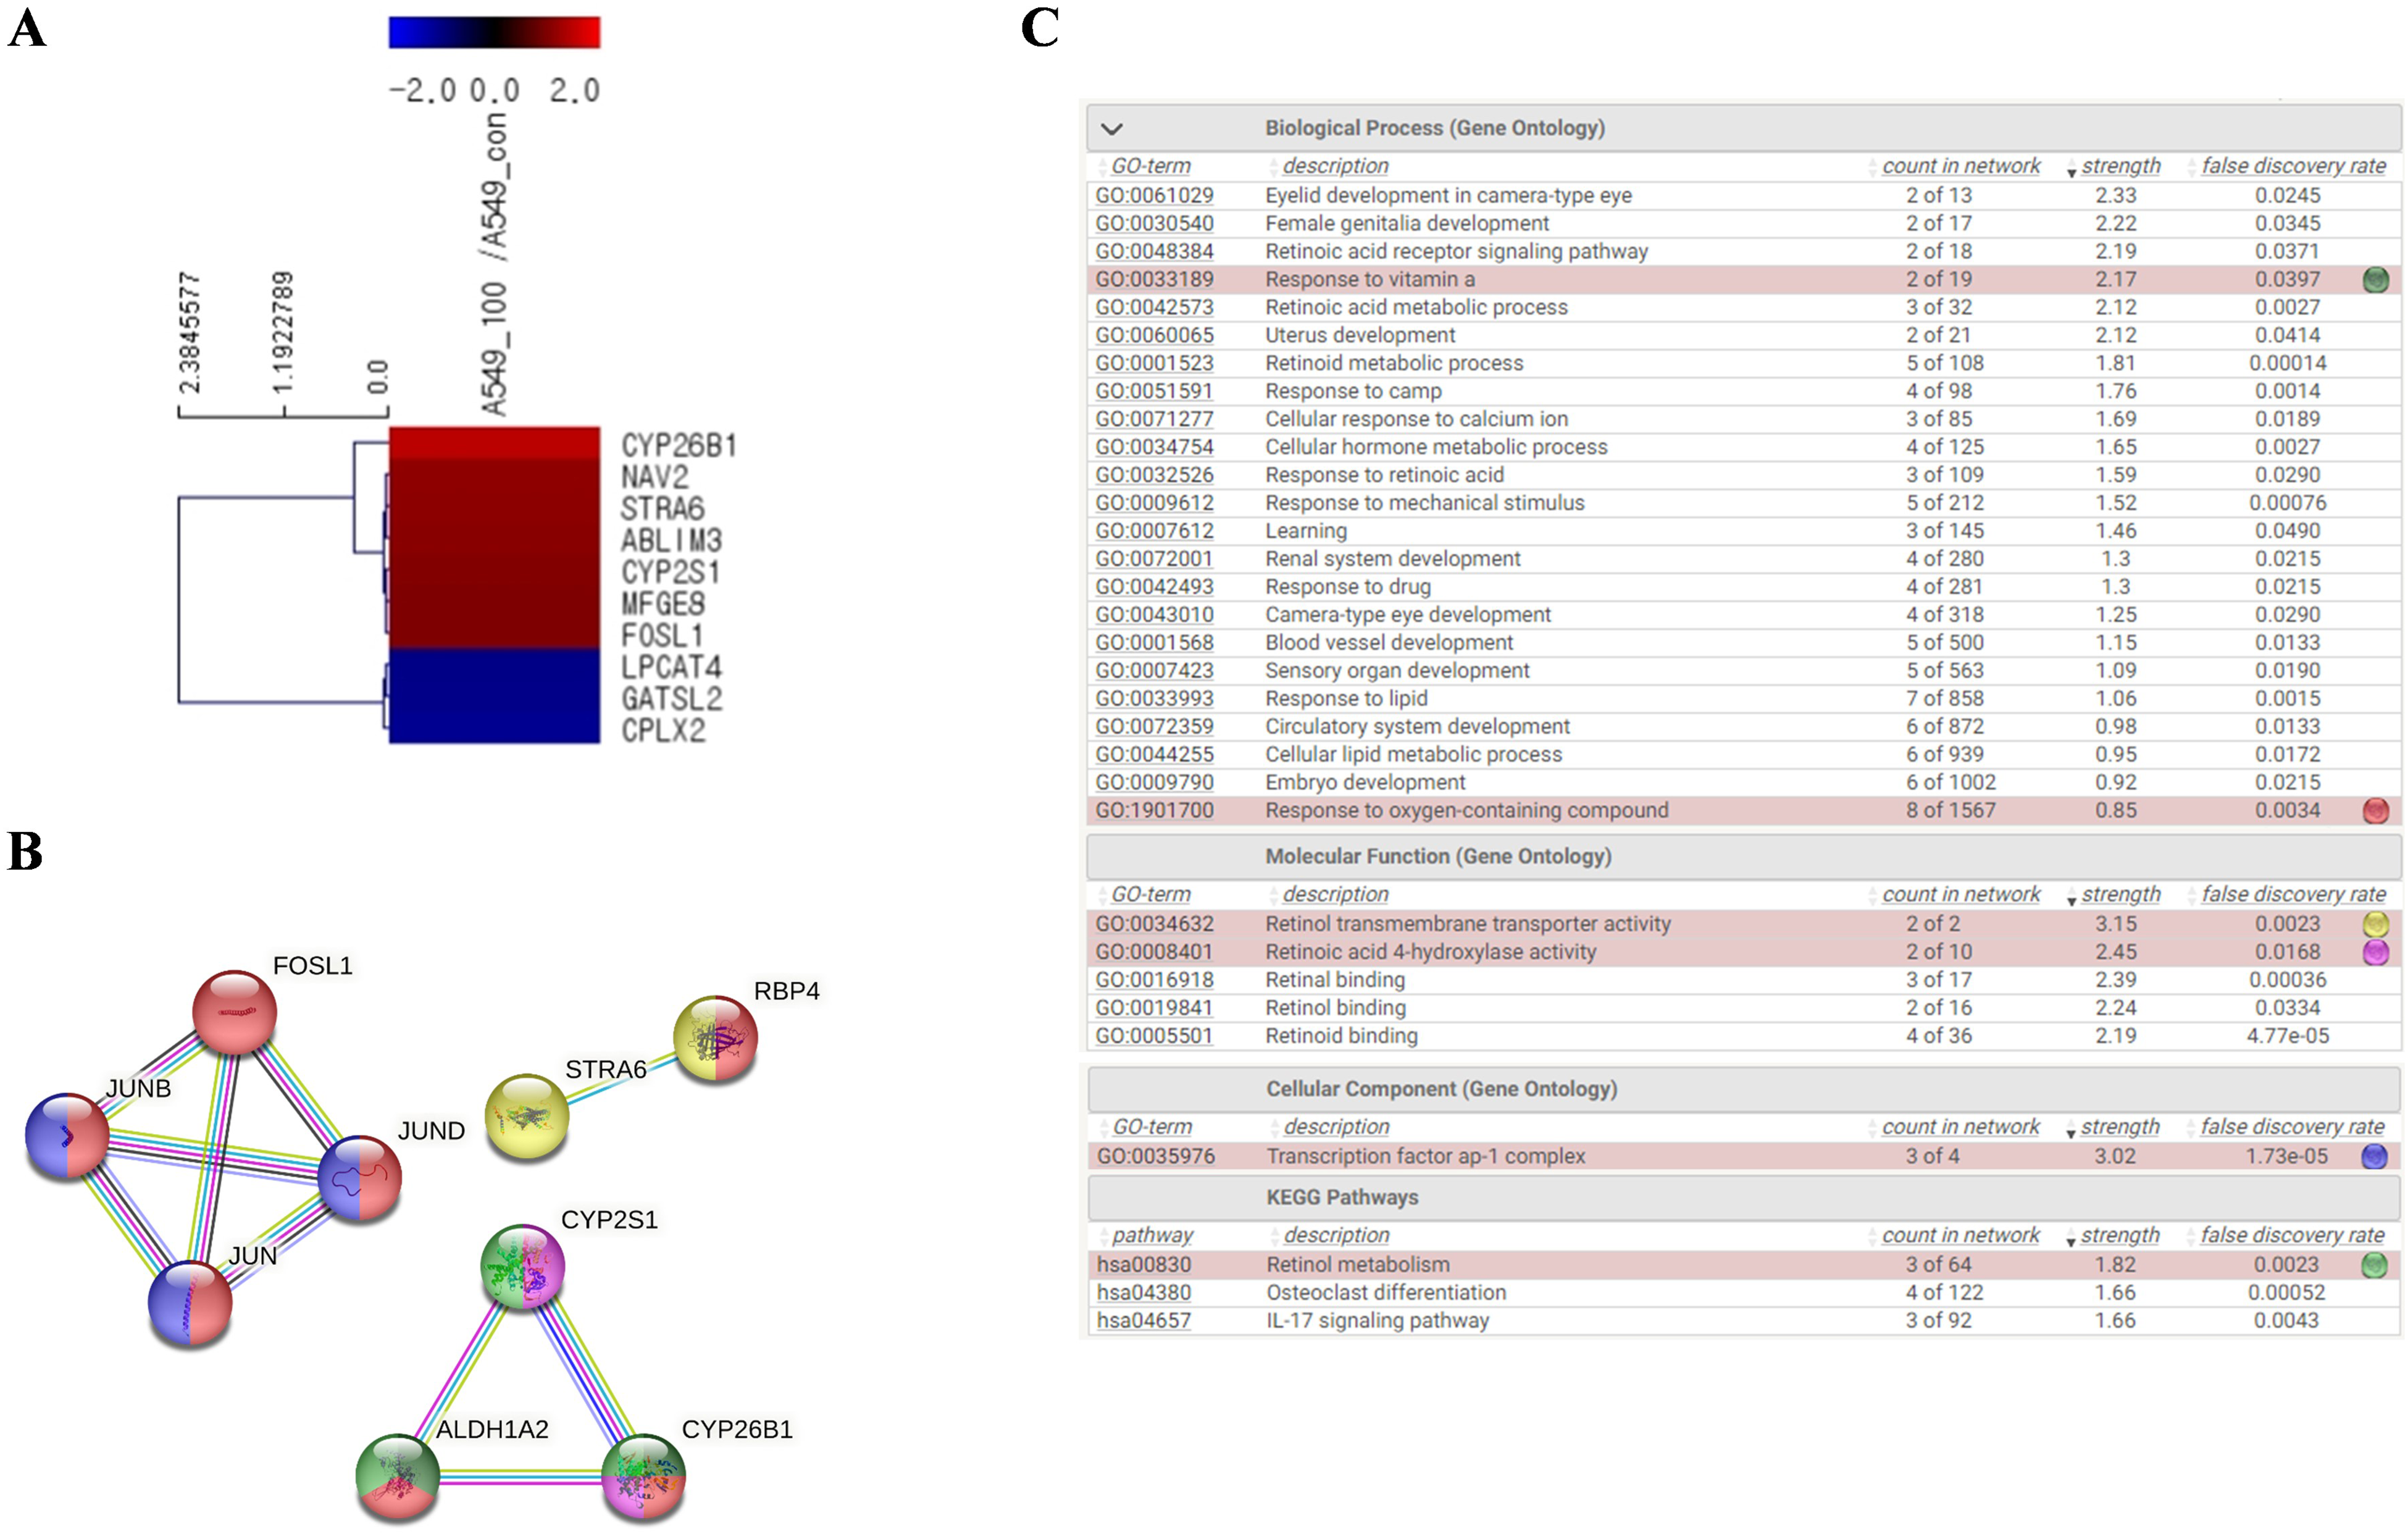
RNA sequencing analysis of differentially expressed genes and pathways in A549 cells treated with Mychonastes sp. 247 ME. Hierarchical gene clustering was performed using TM4 MeV. Red and blue colors represent genes that were upregulated and downregulated by more than 2-fold, respectively. The ratios of gene profiles are presented as a (A) heatmap and gene expression pattern. (B) Combined screenshots from the STRING website showing the results obtained upon analyzing a set of 9 proteins suspected to be involved in the signaling process (GO analysis). The insets show the accessory information available for a single protein, a reported enrichment of functional connections among the set of proteins, and statistical enrichments detected in functional subsystems. (C) GO analysis of protein–protein interactions. Enriched functions were selected and the corresponding protein nodes in the network were automatically highlighted. Abbreviations: ME, methanolic extract; GO, gene ontology; MeV, Multiple Experiment Viewer.
ME Induces Apoptosis via the Stra6-MAPK Pathway
We assessed the expression of apoptotic proteins to determine whether ME mediates its effect by inducing apoptosis in NSCLC cells. Changes in p53 and apoptosis-related protein levels after treatment were observed (Figure 5A and B). After 24 h of treatment with 100 and 200 µg/mL ME, we found a significant increase in p53 levels from 0.86 in control cells to approximately 1.23 in ME-treated cells (P = .0205). Moreover, the Bax/Bcl-2 ratio increased over 4-folds in ME-treated cells in a concentration-dependent manner (P = .0002). Cleaved PARP and cleaved caspase-3 increased in ME-treated cells compared to the control, from 0.24 to 0.57 (P = .0216) and 0.45 to 1.71 (P = .0085), respectively, further confirming the apoptotic activity in A549 cells.

Changes in the expression levels of proteins involved in apoptosis and the STRA6/MAPK pathway. Treatment with Mychonastes sp. 247 ME activates the MAPK pathway of apoptosis by regulating STRA6 and p53. (A) Western blotting analysis of the protein expression levels of p53, Bax, Bcl-2, cleaved PARP, PARP, caspase-3, and cleaved caspase-3. (C) Western blotting analysis of the protein expression levels of STRA6, p-p38, p38, p-JNK, JNK, p-ERK, and ERK. (B, D) Quantification of the protein expression levels. The density of the bands was quantified and normalized to GAPDH. Abbreviations: MAPK, mitogen-activated protein kinase; STRA6, signaling receptor and transporter of retinol; Bcl-2, B-cell lymphoma protein 2; Bax, (Bcl-2)-associated X; PARP, poly (ADP-ribose) polymerase; JNK, c-Jun N-terminal kinase; ERK, extracellular signal-regulated kinase; GAPDH, glyceraldehyde-3-phosphate dehydrogenase; ME, methanolic extract.*P < .05, **P < .01, and ***P < .001.
As the RNA sequencing results suggested the involvement of Stra6 and genes related to retinol-regulating pathways, we investigated the changes in the related proteins using western blotting (Figure 5C and D). STRA6 protein expression levels significantly increased in 200 µg/mL ME-treated cells compared to the control, from 0.71 to 1.58 (P = .0003). The level of phosphorylated (p) p38 was determined against p38 expression, which revealed an increase in the level of p-p38/p38 from 0.77 to 1.27. The p-JNK/JNK levels also significantly increased in ME-treated cells compared to control cells (>2-fold) (P = .0011). Moreover, p-ERK/ERK levels were downregulated from 1.34 in control cells to 0.73 in 200 µg/mL ME-treated cells (P = .0003). Thus, we were able to speculate that ME treatment induced apoptosis by signaling the STRA6-MAPK pathway in A549 cells.
ME Treatment Signals the STRA6-MAPK Pathway via ROS Induction
Based on the above results, we hypothesized that ROS is involved in the activity of ME via STRA6. 19 The ROS levels in A549 cells after 24 h of exposure to ME (Figure 6) were analyzed. Exposure to H2O2 (positive control) and 100 µg/mL ME induced significant increases in the ROS levels (83.68% and 52.33%) compared to the control (39.21%). An increase in the fluorescence intensity was also apparent in the images of the cells obtained by the fluorescence-activated cell sorting system; ME increased the fluorescence levels of the cells after 24 h of treatment (Figure 6B), and this ME-induced increase in ROS levels was rescued by co-treatment with NAC, a ROS inhibitor. Moreover, the role of ROS in the cytotoxic effect of ME was confirmed by measuring the relative cell viability of A549 cells under NAC-positive and -negative conditions. The results revealed that while 200 µg/mL of ME decreased the relative cell viability, this toxic effect was diminished in cells co-treated with NAC (Figure 6C). We also determined the protein levels of STRA6 and PARP to identify the changes in their expression in response to the co-treatment (Figure 6D and E). Exposure to ME increased the level of cleaved PARP; however, co-treatment with NAC reversed these effects. Moreover, the increase in STRA6 levels after exposure to ME was also alleviated in co-treatment conditions with NAC, suggesting the role of ROS in ME-treated A549 cells.

Regulation of ROS levels in response to treatment with Mychonastes sp. 247 methanolic extract (ME). Changes in the ROS levels in A549 cells were determined by DCFDA assay following treatment with ME for 24 h. H2O2 was used as a positive control. (A) Results were analyzed using the Guava easyCyte system. (B) Fluorescent images of the cells stained with DCFDA after treatment with ME or co-treatment of ME and NAC. (C) Relative cell viability of cells after treatment of ME or co-treatment of ME and NAC. (D) Western blotting analysis of the protein levels of STRA6, Caspase-3, and cleaved caspase-3. (E) Quantification of the protein expression levels. The density of the bands was quantified and normalized to GAPDH. *P < .05, **P < .01, and ***P < .001. Abbreviations: ns, not significant; NAC, N-acetyl-l-cysteine; STRA6, signaling receptor and transporter of retinol; ME, methanolic extract; ROS, reactive oxygen species
Discussion
Mychonastes, a species of freshwater green microalgae, has been previously studied for its lipid and carotenoid content.9,10 Despite research regarding its anticancer effects, the mechanism of Mychonastes in NSCLC cells has not yet been elaborated. In the cancer microenvironment, ROS levels increase due to uninhibited cell proliferation, leading to the downregulation of tumor suppressor genes and the activation of oncogenes. 25 The oxidative stress defense system is highly activated in cancer to modulate intracellular ROS levels; therefore, cancer cells are more vulnerable to extracellular oxidative stress than normal cells, 26 making ROS a promising target for the development of anticancer drugs. 27 In the present study, we investigated the anticancer effect of ME on A549 lung cancer cells in response to intracellular oxidative stress.
We analyzed the content of ME and revealed that β-sitosterol tetra-O-acetyl-β-D-glycopyranoside (C43H68O10) was the most abundant component. Previous studies show that treatment with β-sitosterol induces hepato- and prostate-carcinoma apoptosis by inducing ROS production.28,29 Therefore, β-sitosterol may be the main component mediating the effects of ME in increasing ROS levels.
Tumor cells exist in a microenvironment with different levels of nutrient supply, cell-to-cell interactions, and pressure, 30 and the discrepancies between 2D and 3D cell culture methods often hinder the process of drug development. Therefore, investigating the efficacy of 3D in vitro cell culture models is crucial to obtain substantial data before proceeding to in vivo trials. 31 In this study, we confirmed that ME significantly reduced the viability of 2D and 3D cultured A549 cells, while exhibiting lower toxic effects on normal cells. Moreover, the significant reduction in the size of A549 spheroids by treatment with ME indicates its potential as a cancer therapeutic candidate.
ROS participates in the migration and invasion of cancer cells during metastasis. Extracellular ROS induces growth factor-related signaling through the activation of phosphoinositide 3-kinase, protein kinase B (Akt), and MAPK, including p38, JNK, and ERK. 32 In this study, we confirmed that ME inhibited cancer cell migration by promoting the phosphorylation of p38 and JNK. These results suggest that endogenous, but not extracellular, ROS may be involved in the regulation of cancer cell migration by ME. Therefore, the anti-migratory effect of ME combined with its growth inhibitory effect may synergistically suppress cancer progression.
Retinol, also known as retinoic acid and vitamin A, is converted from provitamin A carotenoids. 33 Microalgae-derived carotenoids, including zeaxanthin, fucoxanthin, astaxanthin, and lutein, exhibit anticancer, anti-inflammatory, and antioxidant activities. 2 El-Baz et al 34 reported that zeaxanthin isolated from microalgae modulates oxidative stress through retinoic acid receptors. Therefore, microalgal carotenoids may act on human cells via retinoic acid receptors. Additionally, the effect of retinol on oxidative stress remains controversial.35–37 However, STRA6, the receptor for retinoic acid uptake, induces mitochondrial depolarization and intracellular ROS.19,38 In the present study, treatment with ME increased the mRNA and protein levels of STRA6 and increased intracellular ROS levels via mitochondrial dysfunction. Furthermore, co-treatment with the ROS inhibitor, NAC, reversed the effects of ME on cancer cells. Collectively, these results suggest that carotenoids in ME, such as luteoxanthin, may induce intracellular ROS production via STRA6.
In conclusion, this study revealed for the first time that ME induces apoptosis in lung cancer cells by increasing intracellular ROS via the STRA6-MAPK signaling pathway. Additionally, our findings indicate that treatment with ME suppresses the growth of both 2D and 3D cultured lung cancer cells while exhibiting less detrimental effects on normal cells. This study suggests ME as a promising biosource for the treatment of lung cancer.
Footnotes
Author Contributions
S.L. contributed to the formal analysis, investigation, validation, methodology, resources, and writing of the original draft. EH. contributed to the formal analysis, investigation and methodology. K.J.Y., J.Y.J., Y.-S.C. and C.-S.L. contributed to the formal analysis, investigation, resources and writing–original draft. H.-J.J. contributed to the conceptualization, data curation, formal analysis, investigation, validation, and writing the original draft. Z.-H.K. contributed to the conceptualization, formal analysis, funding acquisition, project administration, writing, review, and editing.
Declaration of Conflicting Interests
The author(s) declared no potential conflicts of interest with respect to the research, authorship, and/or publication of this article.
Funding
The author(s) disclosed receipt of the following financial support for the research, authorship, and/or publication of this article: This work was supported by the Nakdonggang National Institute of Biological Resources funded by the Ministry of Environment of the Korean government (grant number NNIBR202303101).