
Abstract
Backgound/Objectives
Urolithins (UROs) are the metabolites derived from the gut microbial action on ellagitannins and ellagic acid-rich foods. Following their absorption in the intestine, UROs are transported through the systemic circulation to various tissues where they can express their biological function as antimicrobial, anti-inflammatory, and anticancer agents. In addition to blood plasma, where they can be found as glucuronide and sulfate conjugates, they are also found in urine. Therefore, the interactions of UROs with serum proteins are of great clinical interest.
Methods
A powerful technique for examining these urolithin-serum protein interactions is fluorescence spectroscopy. Bovine serum albumin (BSA) is a particularly suitable model protein because it is readily available, affordable, and similar to human serum albumin. This work aimed to study the binding of UROs (urolithin A, UROA and urolithin B, UROB) and their glucuronide conjugates (UROAG and UROBG) to BSA by quenching the intrinsic fluorescence of protein.
Results
The spectra obtained showed that the binding process is influenced by the polyphenol's structure and the conjugation process with the glucuronide. The calculated Stern Vollmer binding constants (Ksv): UROA and UROB Ksv were 59236 ± 5706 and 69653 ± 14922, respectively, while for UROAG and UROBG, these values were 15179 ± 2770 and 9462 ± 1955, respectively, which showed that the binding affinity decreased with glucuronidation. Molecular docking studies confirmed that all of the studied molecules will bind favorably to BSA. The preferential binding site for both UROs and UROGs is Sudlow I, while UROs will also bind to Sudlow II. URO-Gs can bind to BSA in the cleft region with lower binding scores than for the Sudlow I binding site.
Conclusion
The aglycone's higher hydrophobicity increases the binding affinity to BSA, thus reducing its bioavailability in the blood.
Keywords
Introduction
Urolithins (UROs) are secondary metabolites that are produced by gut microbiota by the hydrolysis of ellagitannin-containing foods such as fruits (pomegranates, strawberries, and raspberries), nuts (walnuts), and oak-aged wines. 1 Therefore, their concentration is higher in the gut,1,2 while their concentrations in plasma, urine, feces,1,3–5 and the internal organs 6 is lower.
Gut microbiota metabolize ellagitannins (ET), hydrolysable tannins, to ellagic acid (EA), which is poorly absorbed in the intestines and its bioavailability is consequently low.7,8 EA undergoes decarboxylation at one of its lactone rings yielding urolithin M-5 (pentahydroxy-urolithin). Following that, successive removal of hydroxyl groups leads to the formation of several types of isomers. Thus, tetrahydroxy-urolithin isomers M-6 and urolithin D are formed by removing only one hydroxyl group. Removal of the second hydroxyl group leads to urolithin M-7 and urolithin C, as trihydroxy-urolithins. Finally, the dihydroxy-urolithins, urolithin A, and isourolithin A, are formed by removal of the third hydroxyl group. Isourolithine A is a precursor for the formation of monohydroxy-urolithine (urolithine B). 9 The resulting UROs are benzocoumarins, which have a lipophilic structure that allows them to pass biological barriers easily. 10 Compared with other dietary polyphenols, released gut UROs have the highest bioavailability. 5 This allows them to be found in the blood plasma at high concentrations as aglycons and in the form of glucuronide conjugates.
One of the most common UROs is urolithin A (UROA), as well as its conjugate, which can reach concentrations in human plasma ranging from 0.024 to 35 μM. 10 UROA is also the most biologically active urolithin. Its biological effect is manifested by stimulating autophagy in dysfunctional mitochondria. This is a process, otherwise known as mitophagy, of removing old and damaged mitochondria, making room for new mitochondria, and thereby improving cell performance. 11 As a result, UROA enhances muscle endurance and prevents aging and neurodegenerative diseases. A purified form of UROA has been used to make a dietary product called Mitopure. Mitopure has been determined to be safe for human use by the U.S. Food and Drug Administration (FDA). 12
Distinguishing urolithin in circulation is of clinical importance. Since they differ in the hydroxyl substitution on the urolithin nucleus, UV spectroscopy is used for their detection. Also, conjugation with methyl, glucuronide, and sulfate groups can be seen by UV spectroscopy and used as a diagnostic method for identifying these metabolites.5,8 Conjugated UROs are more abundant in the circulation than free ones, although their activity is reduced. However, once they enter the tissue, deconjugation occurs, recovering their function. 11
It has long been known that polyphenols react with proteins, and that the interaction is structurally dependent. The mechanism of reactions and the degree of binding of polyphenols to serum proteins are examined in order to better understand the nature and the strength of these interactions. 13 It contributes to elucidating the absorption, distribution, and metabolism of polyphenols. Serum albumin is the crucial soluble protein in circulation, involved in transport of different compounds. Bovine serum albumin (BSA) is the most commonly used as a model for other serum albumin proteins because it has about 80% sequence homology and structural similarity to human serum albumin (HSA). BSA is a globular protein, with a predominantly helical structure and has a molecular weight of 66,463 kDa. 14 Mature BSA has 583 amino acids, organized into 3 homologous α-helix domains (I, II, and III). 14 Each domain is divided into 2 subdomains, A and B. BSA has 2 tryptophan residues. 15 Their different positions relative to the molecule's surface renders them differently accessible to the ligands. Ligands act as fluorescence quenchers and can be aromatic or heterocyclic compounds, including UROs. 16 Their binding to BSA affects their structure and leads to conformational changes that can be detected by fluorescence. 17 Besides its intrinsic carrier function, BSA can be modified into nano-particles that have the ability to transport hydrophobic molecules.18,19 The interaction of albumin with UROs may affect their metabolism, efficacy, and body distribution, as well as their physiological functions. 20 In accordance, Xue et al have recently reported enhanced anticancer activity of UROB after binding to albumin. Regarding that UROs have many anti-inflammatory, antioxidant, antidiabetic, and anti-cancer activities, they also have a pharmacological potential and thus interactions with carriers are of a special interest.21,22 To boost our knowledge of the transport and distribution of UROs in vivo, the primary focus of this study was to assess binding affinities of different UROs and their glucuronide-conjugates (UROGs) to BSA using Trp fluorescence quenching and molecular docking.
Results and Discussion
The conformational changes of BSA before and after addition of UROs and UROGs (Figure 1) were monitored by measuring the internal fluorescence of BSA tryptophan residues. These measurements have shown that changes in emission spectra of tryptophan residues are a general response to ligand binding and are an effective way to assess how the properties of the ligand itself affect the interaction with the protein molecule.

Chemical structure of ellagic acid metabolites: (A) Utolithin-A (UROA; 3,8-dihydroxy-6Hbenzo[c]chromen-6-one); (B) Urolithin-B (UROB; 3-hydroxy-6H-benzo[c]chromen-6-one); (C) Urolithin-A glucuronide (UROAG; (8-hydroxy-6-oxo-6H-dibenzo[b,d]pyran-3-yl beta-D-glucopyranosidUROnicacid); (D) Urolithin-B glucuronide (URO-BG; 3,4,5-trihydroxy-6-(6-oxobenzo[c]chromen-3-yl)oxyoxane-2-carboxylic acid).
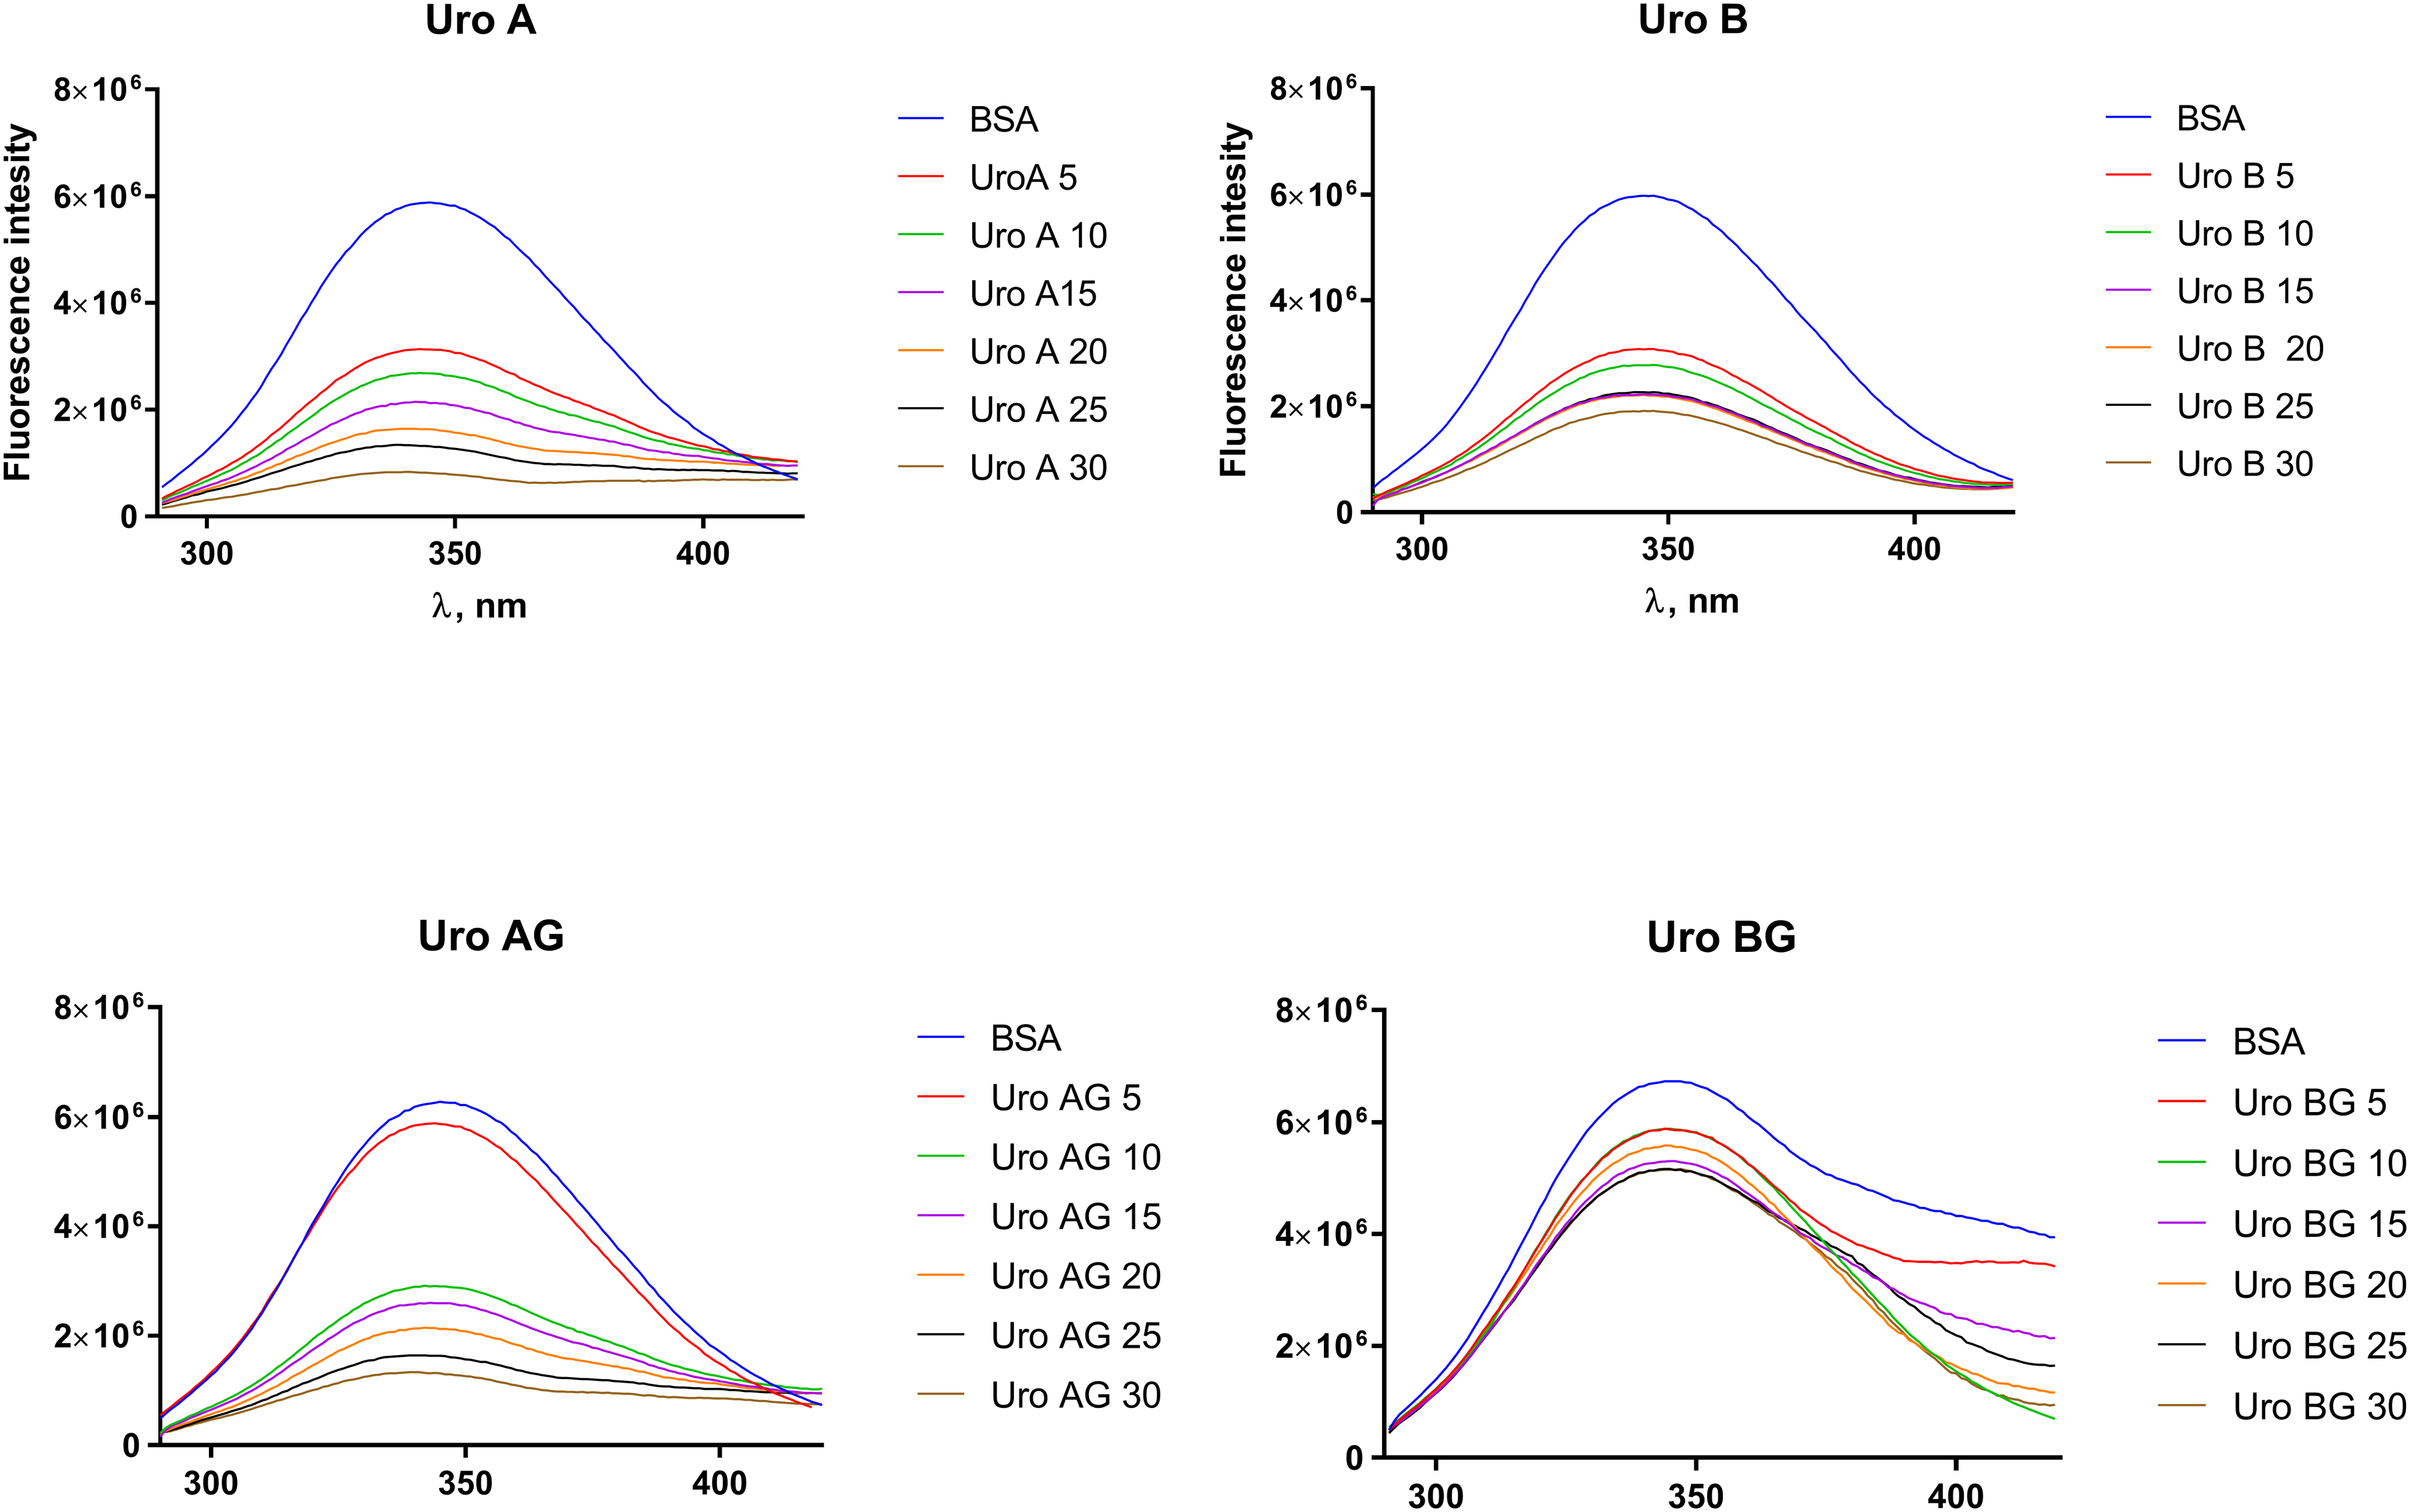
Emission spectra of BSA (3 μM) at λex 282 nm (pH 7.0) in the presence of increasing concentration of (a) UROA; (b) UROB; (c)UROAG; (d) UROBG.

Tryptophan fluorescence quenching of BSA (3 μM) at pH 7.0 plotted as the extinction of BSA tryptophans (F/F0 ×100) against polyphenol concentration of UROA, UROAG, UROB, and UROBG. The fluorescence emission intensity was recorded at λex 282 nm, and the λem maximum occurred at 350 nm. All data were corrected for quencher fluorescence.
Figure 4 shows the Stern-Volmer plots of the fluorescence quenching of BSA with various concentrations of URO and UROG. Table 1 contains the calculated constants: Stern-Volmer (KSV) and bimolecular quenching (kq) constant at physiological pH. UROA, unlike UROB and its conjugates UROAG and UROBG, is more reactive in quenching BSA fluorescence. The bimolecular quenching constant (kq) shows the efficiency of quenching and allows one to verify whether quenching occurs as a consequence of protein-ligand complex formation that affects tryptophan’s microenvironment. The Stern-Volmer plot for UROA is not linear but is curved upwards, concave to the y-axis (Figure 3), for all concentration ranges of UROA, indicating that BSA could be quenched by both a static and dynamic mechanism, or there is a “sphere of action model.” This model assumes the existence of a sphere of volume around the fluorophore within which a quencher will cause quenching with a probability of unity. Quenching occurs when the quencher is near the fluorophore of the protein in the moment of excitation. In this model, no ground state complex is formed. The modified form of the Stern-Volmer plot was used to analyze the quenching data when both static and dynamic mechanisms were present (Figure 5).

Stern-Volmer plot describing tryptophan quenching of BSA (3 μM) at pH 7.0 in the presence of different concentrations of (a) UROA, (b) UROAG, UROB, and UROBG. Fluorescence emission intensity was recorded at λex 282 nm, and the λem maximum occurred at 350 nm.

A modified form of Stern-Volmer plot describing tryptophan quenching of BSA (3 μM) at pH 7.0 in the presence of different concentrations of UROA based on equation 2.
Stern-Volmer (KSV) and Bimolecular (kq) Quenching Constants, for the Interaction of UROs With BSA.
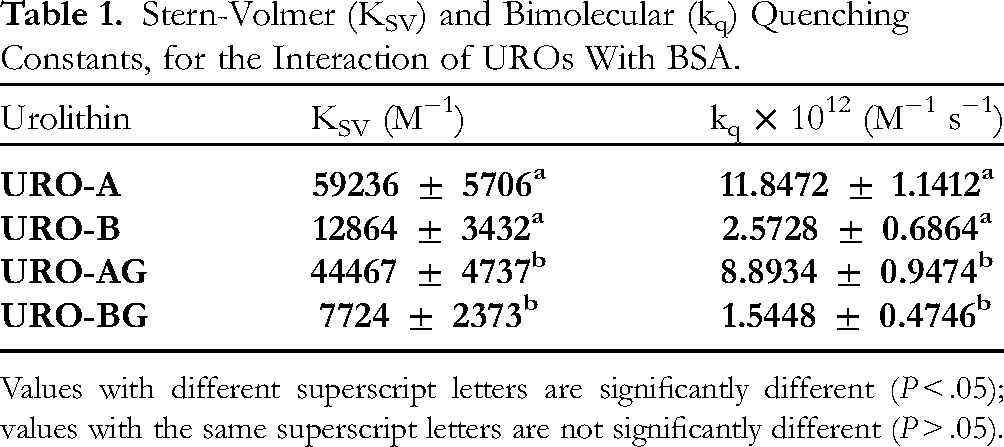
Values with different superscript letters are significantly different (P < .05); values with the same superscript letters are not significantly different (P > .05).
The linear Stern-Volmer plots for UROB and UROGs indicate one type of quenching mechanism. Which quenching mechanism will occur depends on whether the value of kq is 1 × 10¹⁰ M−1s−1. If so, it will be dynamic. The kq values of UROs and UROGs are 100 to 400 fold higher (Table 1), indicating a stable BSA-urolithin complex. A static quenching mechanism is dominant in this system. EA has also been reported to quench BSA fluorescence with a quenching constant that is several orders of magnitude higher than the maximum value of diffusion-limited quenching in water. 23
To complement the spectroscopy measurements, molecular docking studies of UROs and UROGs to BSA were performed. Analysis of docking results has shown that the highest energy binding site for all investigated UROs is located in Sudlow I site (Figure 6).

The high affinity binding sites for URO and URO-G ligands on BSA protein as found by docking study. Docked ligands and Trp 213 are shown in stick representations. Color code: UROA—red; UROB—green; UROAG—blue; UROBG—yellow; Trp 213—magenta.
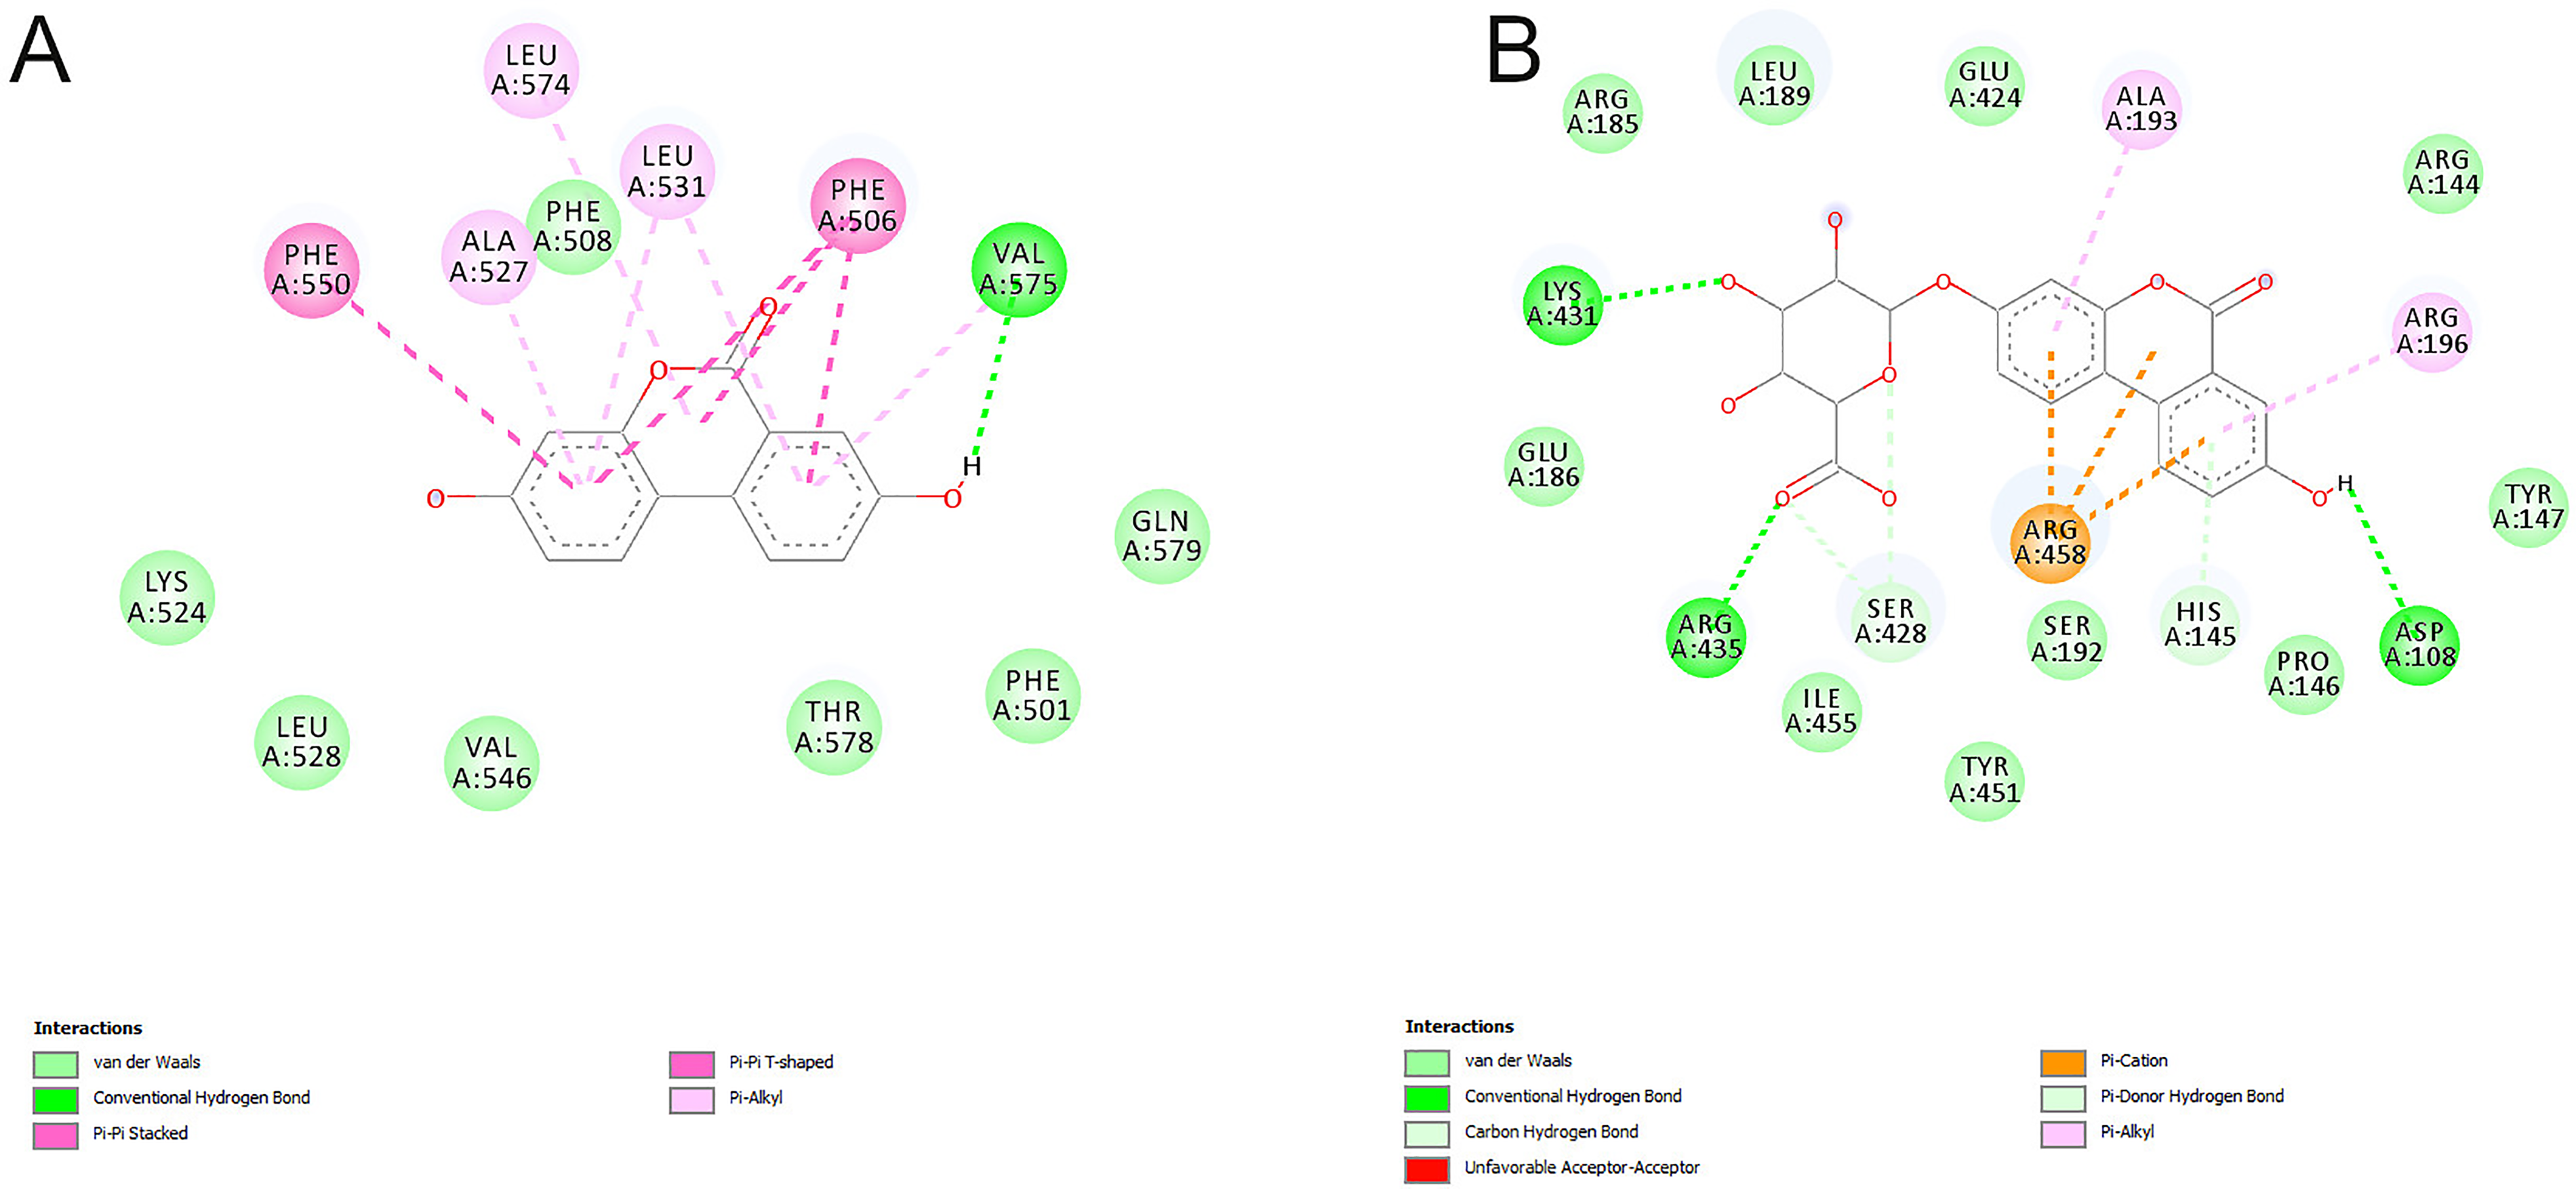
Binding of both aglycons, with similar binding energy (Table 2) is predominantly driven by formation of hydrogen bonds (with Arg 217 and Arg 256) and amide-π stacking interactions with the backbone amide group of Ile 289. Binding is further stabilized by formation of multiple π-alkyl and van der Waals interactions (Figure 7A and B). Due to an additional hydroxyl group in position 8, the UROA ligand forms 2 additional hydrogen bonds with Ser 286 and Ala 260.
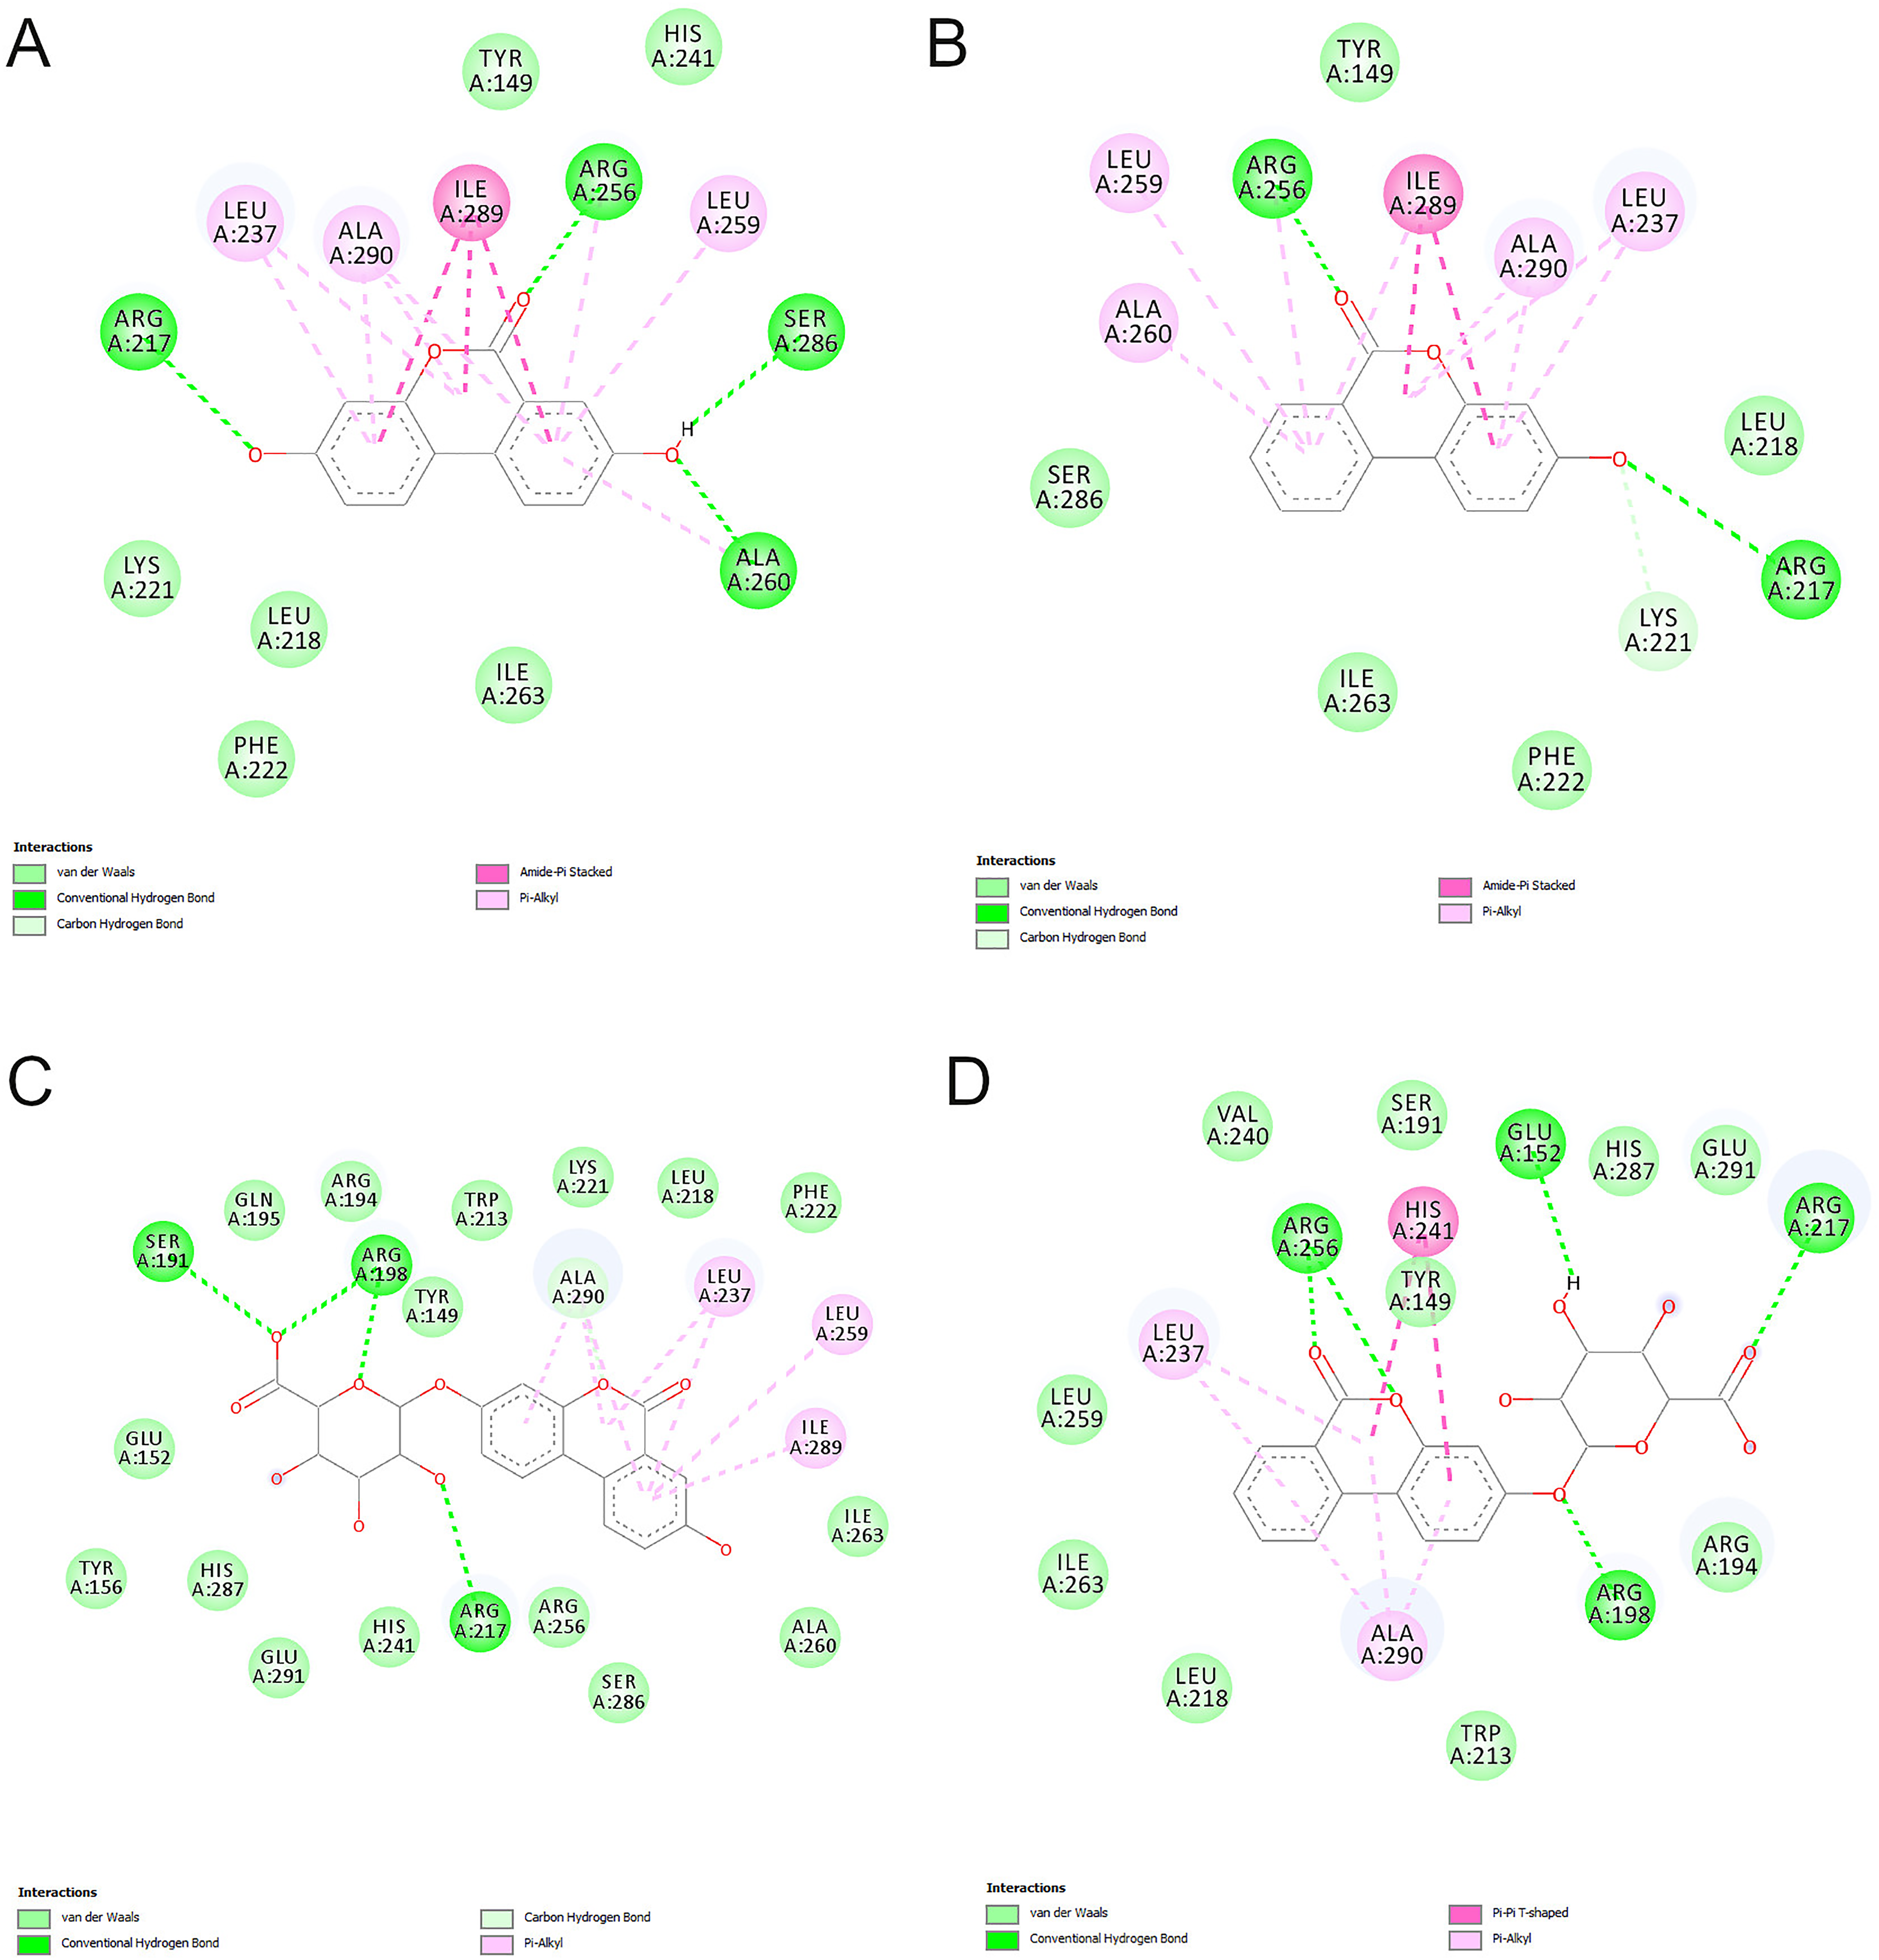
The 2D protein-ligand interaction diagrams for the highest energy binding site (Sudlow I) for UROA (A), UROB (B), UROAG (C), UROBG (D) (Note: the residue numbers correspond to residue numbers in 4F5S structure).
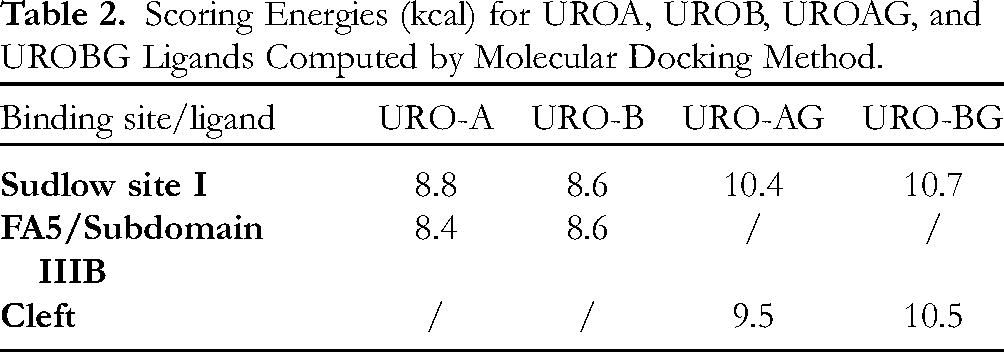
Scoring Energies (kcal) for UROA, UROB, UROAG, and UROBG Ligands Computed by Molecular Docking Method.
Binding of 2 glycosylated UROs to the Sudlow I binding site is somewhat different than the binding of aglycons. The aglycon part of UROAG forms predominantly nonpolar interactions with BSA amino acids (π-alkyl and van der Waals interactions) while the sugar moiety forms 4 strong hydrogen bonds with residues Ser 191, Arg 198, and Arg 217. On the other hand, the aglycon part of UROBG forms a bifurcated hydrogen bond with Arg 256 and a π-π T-shaped interaction with the imidazole ring of His 241. However, binding of the sugar part of UROBG is enabled through formation of only 3 hydrogen bonds with Glu 152, Arg 198, and Arg 217. A higher total number of hydrogen bonds and additional π-π T-shaped interaction makes the binding of UROBG 0.3 kcal stronger than that of UROAG (Table 2).
Fluorescently active Trp 213 is buried in the hydrophobic pocket of BSA in close proximity to the Sudlow I binding site. The results of the docking study have shown that the distance between docked UROs and UROGs and Trp 213 is between 3.2 and 5.1 Å (Figure 6–inlet) explaining the quenching of florescence upon ligand binding. However, the Sudlow I binding site is large, versatile, and highly ordered, so binding of the ligands will not induce significant conformational changes in BSA structure, and thus no shifts in the florescence emission maxima were observed. 24
The second high affinity binding site for aglycons is located at the IIIB subdomain of BSA, and it overlaps with the fatty acid 5 (FA5) binding site (Figure 6). This binding site is composed of nonpolar and aromatic amino acids. The main interactions with aglycons are: π-π stacking, π-π T-shaped, π-alkyl and van der Waals interactions (Figure 8A). Only one hydrogen bond with a backbone carbonyl group from Val 575 is formed. Based on the docking scores, binding to this site is slightly less favorable (Table 2) and will likely occur once the Sudlow I binding site is saturated. However, due to the small size and highly nonpolar nature of the FA5 binding site, the sugar moiety cannot be accommodated thus, and the docking study has not found any UROGs bound at this location.
The 2D protein-ligand interaction diagrams for the UROA bound to the FA5 binding site (A) and UROAG bound to the cleft binding site (B). (Note: the residue numbers correspond to residue numbers in 4F5S structure).
The second high affinity binding site for glycosylated UROs is located in the cleft between subdomains IIA and IIIA (Figure 6). This binding site is composed mainly of polar and charged amino acids (Figure 8B) and a number of hydrogen bonds and cation-π interactions with UROG ligands are formed.
BSA, due to its similarity in structure to HSA, is used as a model system for studying interactions with polyphenolic metabolites. 17 The BSA structure is predominantly α-helical with 2 tryptophan residues at position 134 within subdomain IB and position 213 within subdomain IIA 23 that possess intrinsic fluorescence. The first residue is positioned on the molecule's surface, while the second is in the hydrophobic pocket of BSA (Figure 6)4,25,26. Based on this, fluorescence quenching is used to measure binding affinity.
The fluorescence comes from the indole group of tryptophan, where the absorption spectrum appears at ∼280 nm and the emission spectrum at 340 nm. When Trp is buried deep in a hydrophobic pocket, a blue shift in fluorescence emission may occur. If the protein unfolding should occur due to the binding of the quencher, the emission can be shifted toward a higher wavelengths (redshift). 13 The binding of URO and UROG did not change the fluorescence of the BSA emission spectra upon binding (Figure 2), indicating that the quenchers were present in the close proximity of the Trp residue. However, no change occurred to the microenvironment of that Trp residue. This further suggests that there were no significant conformational changes in the BSA structure, regardless of the mechanism of URO interaction.
Stern-Volmer plots are linear for UROB, UROAG, and UROBG, indicating that these molecules interact with both Trp residues simultaneously. UROA has 2 hydrogen bond donors in the 2-hydroxyl groups, compared to the single hydrogen donor of UROB, allowing the formation of a higher number of hydrogen bonds. Similarly, the number of hydrogen acceptors is higher in UROA than in UROB. These effects result in a higher quenching constant for UROA, indicating a higher binding affinity to BSA. Thanks to hydrophobic interactions and hydrogen bonds, phenolic compounds have a high affinity for proteins, and as a consequence, the static mechanism predominates in comparison to dynamics. In the case of UROGs, hydrogen bonds are esterified with glucuronic acid, increasing the solubility of the structures and decreasing their hydrophobicity and hydrogen bond donors, leading to a decrease in binding affinity toward BSA. Molecular docking revealed that aglycons can bind to both binding sites, but they will bind more favorably to the Sudlow I binding site, while binding to the Sudlow II will occur with excess of the ligand. UROGs will bind to Sudlow I only as the Sudlow II site will not be accessible to their bulkier and more hydrophilic structure. UROGs can also possibly bind in the BSA cleft but the binding score will be lower than for Sudlow I. The higher binding score in Sudlow I obtained for UROGs in comparison to UROs is due to the fact that aglycons have lower molecular weight and a smaller number of functional groups that can form interactions with the protein, consequently yielding somewhat lower binding scores.
The diversity of physiological properties attributed to EA and its metabolites, UROs, can be modified and/or enhanced through interactions with the main circulatory carrier protein, serum albumin. For instance, upon binding to BSA, EA and UROB exhibit enhanced anti-cancer properties as evidenced by a decrease in the cytotoxic IC50 value. 20 Additionally, the interaction of EA, UROA, and UROB with BSA increases the DPPH scavenging properties of the protein. 23 Understanding how these metabolites interact with serum carrier protein can help modify their potential application.
Conclusion
UROs are not found in nature and therefore must be consumed as either ET-rich food or dietary supplements. Certainly, they end up in the digestive tract, from where they must be transported further through the circulation. Examining the interactions of UROs with serum albumins is of great importance for better understanding of their pharmacological activity, metabolism and transport throughout the circulatory system.
The binding affinity of different conjugated and free UROs to BSA was assessed by measuring the intrinsic Trp fluorescence. The results demonstrated a measurable effect on the BSA binding affinity toward these metabolites. Higher hydrophobicity and the amount of hydrogen donor groups, as found in UROA and UROB, are associated with higher quenching capacity of the investigated molecules. Furthermore, UROs with more hydroxyl groups had a better quenching capacity, while in glucuronidated molecules, this was diminished. Molecular docking studies confirmed that all of the studied molecules will bind favorably to BSA. The preferential binding site for both UROs and UROGs is Sudlow I, while UROs will also bind to Sudlow II. UROGs can bind to BSA in the cleft region with lower binding scores than for the Sudlow I binding site. The results obtained contribute to the understanding of the binding mechanism of free and conjugated UROs to BSA, expanding the knowledge of pharmacodynamics and mode of circulatory transport of these important metabolites. Additionally, other spectroscopic methods such as CD, FTIR, isothermal titration calorimetry, and NMR spectroscopy could be considered to obtain more detailed information about the nature of the interactions of UROs and UROGs with BSA.
Material and Methods
Materials
UROA, UROB, UROAG, and UROBG were kindly provided in a purity of 95% by Gonzalez-Sarrias. 27 UROA and UROB were synthesized as described previously. 28 UROBG was prepared as described by Lucas et al, 29 while UROAG was synthesized as described by Gonzalez-Sarrias et al. 24
BSA (Sigma-Aldrich Chemical Company; St. Louis, USA) was used without further purification. An initial stock solution of BSA (25 µM) was prepared by dissolving it in 0.1 M phosphate buffer of pH 7.0 containing 0.15 M NaCl, based on its molecular weight of 66,000 Da. BSA stock solution was kept in the dark at 4 °C. All chemical reagents were of analytical grade, obtained from commercial suppliers, and used without further purification unless otherwise specified. Double distilled water was used as a solvent to prepare solutions and buffers.
Fluorescence Spectroscopy Measurements
A spectrofluorimeter FluoroMax-4 Model F-2000 (HORIBA Jobin Yvon. Japan) equipped with a 150 W ozone-free xenon arc lamp and a slit width of 10 nm was used for fluorescence measurements. The samples were measured in a quartz cell of 1.00 cm path length.
A series of BSA solutions with increasing concentrations from 0 to 25 µM were prepared in the buffer to determine the linear concentration range for protein fluorescence. The BSA solutions were subjected to fluorescence measurement with the following instrumental parameters: the maximum excitation wavelength (λex) for BSA was set at 282 nm, and the maximum emission wavelength (λem) for BSA was measured at 350 nm. Based on the linear range of fluorescence obtained for BSA concentrations between 0 and 5 µM, a BSA solution concentration of 3 µM was chosen for fluorescence quenching experiments. A dilution series of UROs (5-30 µM) was made for each data point by adding 0.25 mL of the appropriate urolithin solution to 3 mL of BSA solution to give a final urolithin concentration in the range of 0 to 25 µM. After adding the urolithin solution to the BSA solution, the change in the fluorescence spectrum was measured within 1 min. These experiments were performed by adding equal-volume aliquots of the quencher to the protein solution to avoid dilution errors in titration-type experiments. All experiments were performed in triplicate. All data are expressed as the mean and standard deviation. The fluorescence quenching data were analyzed as relative fluorescence intensity obtained from equation of (F0/F × 100) against urolithin concentration. The obtained quenching data were plotted at a Stern-Volmer equation of F0/F against [Q], and the quenching constant was calculated by linear regression using the following equation:
A Stern-Volmer plot indicates the type of quenching mechanism. Hence, Equation 1 was applied to determine KSV by linear regression of a plot F0/F against [Q]. A linear plot obtained from the analyzed data indicates the presence of one type of fluorophore equally accessible to the quencher. Then the quenching mechanism is static, resulting from forming a complex between the fluorophore molecule and the quencher by specific interaction. The bimolecular quenching constant is calculated and compared to the maximum value possible for diffusion-limited quenching in water (∼1010 M−1s−1). Some studies described the quenching of BSA by specific interactions with the quencher.19,20 Then the quenching constant has been several orders of magnitude higher than the maximum value of diffusion-limited quenching in water. This is because the formation of the complex takes place before any electron excitation occurs and because that complex is non-fluorescent. In the case of the dynamic mechanism, the complex building does not happen, but rather a collision between the fluorophore and the quencher. In dynamic quenching, electron excitation takes place before the quenching process. In many cases, both fluorophore quenching mechanisms occur in the presence of the same quencher. Then the Stern-Volmer plot exhibits an upward curvature, concave toward the y-axis at high [Q], and F0/F is related to [Q] by the following modified form of the Stern-Volmer equation where V is the volume of the sphere, and N is the Avogadro's constant

Molecular Docking Studies
Initial ligand structures were downloaded from the PubChem site (UROA PubChem CID: 5488186; UROB PubChem CID: 5380406; UROAG PubChem CID: 124202103, and UROBG PubChem CID: 101495881) and their geometry was fully optimized with B3LYP32,33 density-functional theory method using a standard 6–311 + + G(d,p) basis set. All quantum chemical calculations were performed with the Gaussian09 program package. 34
Molecular modelling of the UROs -BSA complexes was performed using the 3D crystal structure of BSA (PDB ID: 4F5S, Chain A 35 ) extracted from the Protein Data Bank. All heteroatoms (triethylene glycol and water) were removed from the protein structure and the protonation state of each titratable amino acid was estimated using the finite difference Poisson-Boltzmann continuum electrostatics model as implemented in the H + + 3.0 program. 36 Finally, protein structure was optimized in CHARMM program (version c35b1) using the CHARM22 protein force field 37 with 5000 optimization steps (2000 steps with steepest-descent algorithm followed by 3000 steps with Newton-Raphson algorithm).
Optimized structures of protein and ligands were further subjected to AutoDockTools (version 1.5.7. Dec_19_18) program for docking preparation. All protein residues were kept rigid and all rotatable ligand bonds were set to rotate freely during docking calculations.
The docking studies were carried out with AutoDockVina program (version 1.1.2). 38 A small grid box, with the dimensions 24 × 24 × 24 Å, was used to accommodate the ligand to move freely during the docking run. In order to cover the whole surface and volume of BSA a grid box was moved over the rectangular matrix containing protein with points 8 Å apart, so a total of 960 docking runs were produced for every ligand. From each docking run 9 binding modes with highest scoring function were kept for further analysis.
Footnotes
Declaration of Conflicting Interests
The authors declared no potential conflicts of interest with respect to the research, authorship, and/or publication of this article.
Ethical Approval
Ethical approval does not apply to this article.
Funding
The authors disclosed receipt of the following financial support for the research, authorship, and/or publication of this article: This work was funded by the Ministry of Education, Science, and Technological Development of Republic of Serbia Contract numbers: 451-03-9/2021-14/200288, 451-03-68/2022-14/200288, and 451-03-68/2022-14/200015.
Statement of Human and Animal Rights
This article does not contain any studies with human or animal subjects.
Statement of Informed Consent
This article has no human subjects, and informed consent is not applicable.