
Abstract
Periploca forrestii Schltr (P. forrestii) is a herb used in traditional Chinese medicine for its anti-rheumatoid arthritis effect. The aim of this study was to compare the pharmacokinetic properties of the 5 active components of this plant: neochlorogenic acid, chlorogenic acid, cryptochlorogenic acid, isochlorogenic acid C, and periplocin between normal rats and adjuvant-induced arthritis model rats. After the intravenous administration (177.78 mg/kg) of P. forrestii extract, samples were analyzed by ultra-performance liquid chromatography-tandem mass spectrometry. Compared with normal rats, the area under the curve [(AUC)(0-t), AUC(0-∞)], mean residence time [(MRT)(0-t), MRT(0-∞)] of neochlorogenic acid-treated rats decreased significantly, and drug clearance (CL) and apparent volume of distribution (V) increased significantly; the V of chlorogenic acid-treated rats decreased significantly, and MRT(0-t) significantly increased; the AUC(0-t) and AUC(0-∞) of cryptochlorogenic acid-treated rats decreased significantly, and CL and V increased significantly; the AUC(0-t) and MRT(0-t) of isochlorogenic acid C-treated rats decreased significantly, and V increased significantly; the AUC(0-t) and AUC(0-∞) of periplocin-treated rats increased significantly, and MRT(0-t), MRT(0-∞), CL, and V decreased significantly in model rats. The disease condition of rheumatoid arthritis in rats had a significant effect on the in vivo pharmacokinetics of P. forrestii after the intravenous administration.

Rheumatoid arthritis (RA) is a systemic immune disease. Its pathological features include cartilage and bone destruction, synovial inflammation, and vasospasm. RA can also cause joint deformities and varying degrees of disability. Globally, the incidence rate of RA is approximately 1% of the total population, and it seriously affects the quality of life and health of patients. 1 -3 Currently, the drugs for the treatment of RA include non-steroid anti-inflammatory drugs, and disease-modifying antirheumatic drugs. 4,5 However, due to the toxic side effects of these drugs, they are not suitable for long-term use. 6 Therefore, the discovery of anti-RA medicinal substances from natural medicines has become the focus of current research. Among the plants of interest, Miao’s medicinal plant Periploca forrestii Schltr (P. forrestii) is already used to treat RA in southwest China. 7
P. forrestii belongs to the genus of Periploca in Asclepiadaceae family and is included in the 2003 edition of “Quality Standards for Traditional Chinese Medicines and Ethnic Medicines in Guizhou Province”. 8 The dried root or whole plant of this plant is widely used to treat many diseases, such as soft tissue injury and RA, with considerable therapeutic efficacy. 9 Heiguteng Zhuifeng Luohuo capsule, a traditional Chinese medicine preparation that mainly composes P. forrestii, has been demonstrated to be effective in treatment of RA. 10 According to the literature, 11,12 P. forrestii mainly contains phenolic compounds, and cardiac glycosides, such as caffeoylquinic acids: neochlorogenic acid (NA), chlorogenic acid (CA), cryptochlorogenic acid (CGA), isochlorogenic acid C (ICAC), and periplocin (PC) (Figure 1); these acids have been identified to possess anti-RA pharmacological effects. 13,14 PC also has a cardiotonic action 15 and cancer cell proliferation inhibition activity, 16 and is mainly used to treat rheumatism and chronic congestive heart failure in the clinic. 17 However, to our knowledge, the activity of this herb in vivo has not been reported.

The chemical structures of neochlorogenic acid (A); chlorogenic acid (B); cryptochlorogenic acid (C); isochlorogenic acid C (D); periplocin (E); puerarin (F, internal standard).
Chinese herbal medicines are generally administered orally. However, whether the drug can exert its maximum therapeutic effect in vivo is the focus of attention. In current reports, caffeoylquinic acids could be hydrolyzed in the stomach, which results in lower bioavailability. Moreover, di-caffeoylquinic acid is relatively less bioavailable than mono-caffeoylquinic acid, 18 and this condition also occurred in the in vivo process of PC. 19 In order to avoid the pharmacological activity and bioavailability problems caused by oral administration of this compound, a pharmacokinetics study with intravenous administration was established to investigate the process in vivo of P. forrestii extract without absorption.
However, the pharmacokinetic behavior of this herbal medicine is not necessarily the same under different pathophysiological conditions. Studies have shown that under the RA state, the body is in a chronic inflammatory environment, which may lead to changes in drug transporter proteins, cell membrane permeability, and the cytochrome P450 enzyme, thereby changing the pharmacokinetic behavior of the drug in vivo, which affects its distribution and metabolism. 20,21 The aim of this study was to compare the pharmacokinetic parameters of the 5 components in normal rats and adjuvant-induced arthritis (AA) model rats after the intravenous administration of P. forrestii extract. We hope that this study will provide valuable information to guide the reasonable use of P. forrestii in a clinical setting.
Results and Discussion
Method Validation
Specificity and selectivity
No endogenous interference from plasma was observed during the retention time of NA (1.41 minutes), CA (1.87 minutes), CGA (2.00 minutes), ICAC (4.25 minutes), PC (4.93 minutes), and the internal standard (IS) (2.25 minutes), which were determined under selected chromatographic and mass spectrometric conditions (Figure 2).

(A) Blank plasma; (B) Blank plasma spiked with neochlorogenic acid (2), chlorogenic acid (3), cryptochlorogenic acid (4), isochlorogenic acid C (5), periplocin (6), and puerarin (1); (C) Rats plasma sample collected after the intravenous of 177.8 mg/kg Periploca forrestii Schltr extract.
Linearity and Lower Limits of Quantitation
The calibration curve was constructed from the peak area ratios of the 5 components against plasma concentrations. Table 1 shows the standard curve and linear range of the 5 components. All 5 components exhibited good linearity (R 2 > 0.9973) in plasma. The lower limits of quantitation (LLOQ) of NA, CA, CGA, ICAC, and PC were 1.1, 5.2, 5.1, 1.0, and 0.2 ng mL−1, respectively.
Calibration Curve and LLOQ for the 5 Analytes in Rat Plasma.

Abbreviations: CA, chlorogenic acid; CGA, cryptochlorogenic acid; ICAC, isochlorogenic acid C; LLOQ, lower limit of quantitation; NA, neochlorogenic acid; PC, periplocin.
Precision and Accuracy
The quality control (QC) samples at 3 concentrations (low, medium, and high) were measured on the same day (intraday) and on 3 consecutive days (interday) to calculate precision and accuracy. All values of the assays are shown in Table 2, the intraday precision relative standard deviation (RSD) (%) was 2.3%-11.0% for the 5 components, and the interday RSD (%) were 2.5%-10.9%. The accuracy of the 5 components ranged from 89.1% to 112.6% in intraday measurements, and from 85.3% to 113.5% in interday measurements, indicating that the results met the relevant precision and accuracy requirements.
Summary of Precision and Accuracy of the 5 Analytes in Rat Plasma (N = 5, 3 days).
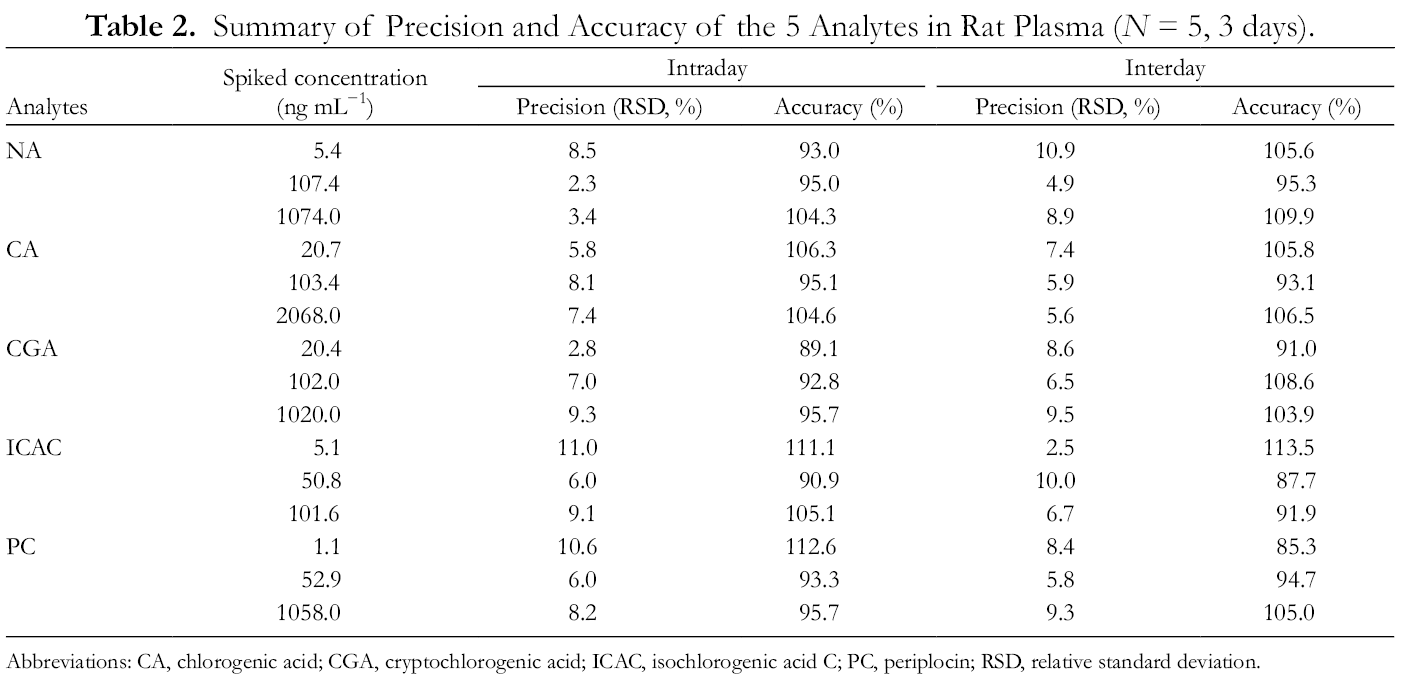
Abbreviations: CA, chlorogenic acid; CGA, cryptochlorogenic acid; ICAC, isochlorogenic acid C; PC, periplocin; RSD, relative standard deviation.
Extraction Recovery and Matrix Effect
The extraction recoveries of the 5 components were in the range of 85.1%-105.0%, and the matrix effect was in the range of 87.5%-107.6%, which indicated that the method had good reproducibility, and there was no significant matrix effect that affected the detection of the components (Table 3).
Summary of Recovery and Matrix Effect of the 5 Analytes in Rat Plasma (N = 5).
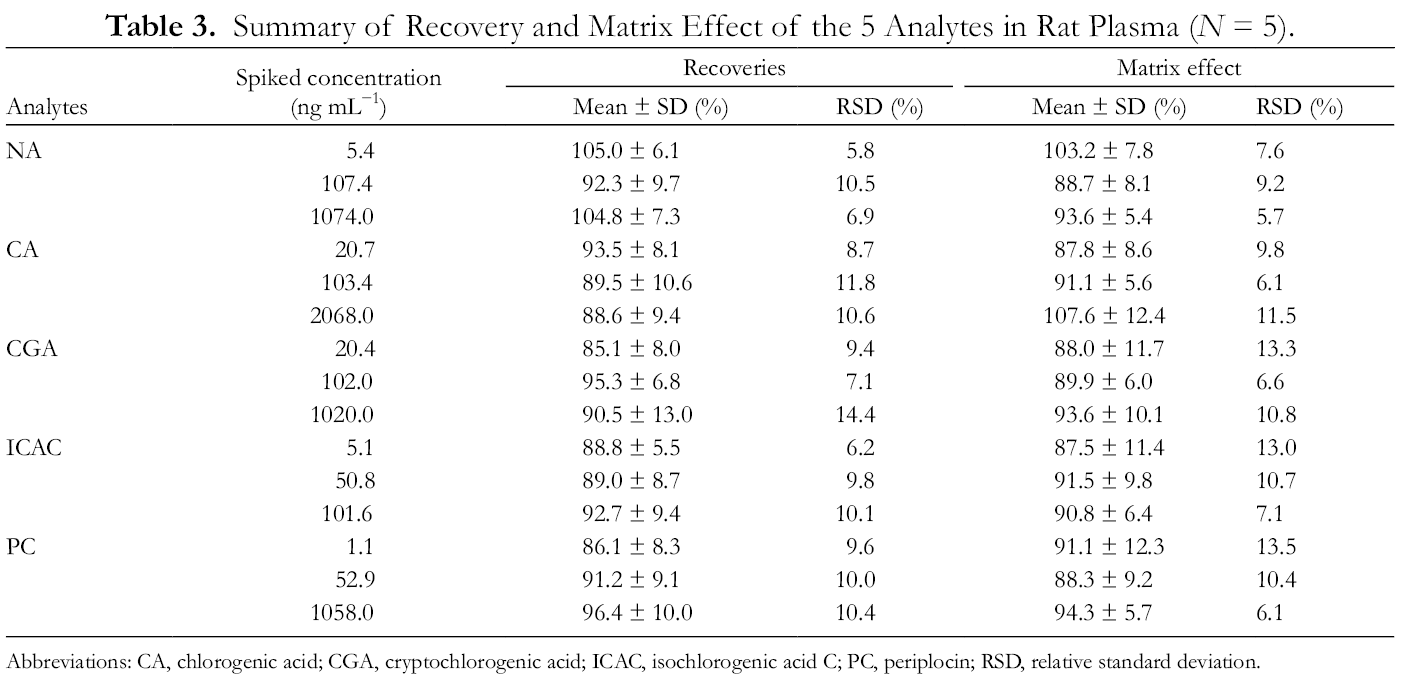
Abbreviations: CA, chlorogenic acid; CGA, cryptochlorogenic acid; ICAC, isochlorogenic acid C; PC, periplocin; RSD, relative standard deviation.
Stability
The stability of the QC samples at 3 concentrations (low, medium, and high) of the 5 components were treated under the conditions shown in Table 4, including at room temperature for 6 hours, refrigeration for 8 hours, and 3 freeze–thaw cycles. The RSD% of the stability rates was less than 12.7%, which indicated that these 5 components had good stability within acceptable limits.
Summary of Stability of the 5 Analytes in Rat Plasma (N = 5).

Abbreviations: CA, chlorogenic acid; CGA, cryptochlorogenic acid; ICAC, isochlorogenic acid C; PC, periplocin; RSD, relative standard deviation.
aMean ± SD.
Dilution Effect
Dilution integrity experiments, for plasma samples with concentrations above the upper limit of quantitation, were carried out by 50 times dilution of plasma samples. The results showed that the RSD% was less than 12.5% (Table 5), which indicated that the developed method could be applied for high-concentration plasma samples that exceed the linear ranges during quantitative analysis.
Summary of Dilution Effect of the 5 Analytes in Rat Plasma (N = 5).

Abbreviations: CA, chlorogenic acid; CGA, cryptochlorogenic acid; ICAC, isochlorogenic acid C; PC, periplocin; RSD, relative standard deviation.
Pharmacokinetic Study
The mean plasma concentration of NA, CA, CGA, ICAC, and PC in the 2 groups versus the time profile following the intravenous administration of P. forrestii extract is shown in Figure 3. The plasma concentration of the caffeoylquinic acids declined rapidly, within 1 hour of intravenous administration. PC declined more rapidly and was almost completely eliminated within 1 hour of intravenous administration. Their estimated pharmacokinetic parameters are presented in Table 6; the results are expressed as mean ± SD.

The mean plasma concentration versus time profile of the 5 components following the intravenous administration of Periploca forrestii Schltr extract in normal and adjuvant-induced arthritis model rats. Each value represents mean ± SD (n = 5).
Estimated Pharmacokinetic Parameters of the 5 Components (mean ± SD, N = 5).

Abbreviations: AUC, area under the curve; CA, chlorogenic acid; CGA, cryptochlorogenic acid; CL, drug clearance; ICAC, isochlorogenic acid C; MRT, mean residence time; NA, neochlorogenic acid; PC, periplocin; V, apparent volume of distribution.
*P < .05, **P < .01 compared with the normal group.
In comparison, the pharmacokinetics of the 5 components changed significantly when P. forrestii extract was administered to AA model rats. In model rats, the AUC(0-t), AUC(0-∞), MRT(0-t), and MRT(0-∞) of NA significantly decreased, and CL and V significantly increased; the V of CA decreased significantly, and MRT(0-t) increased significantly; the AUC(0-t) and AUC(0-∞) of CGA decreased significantly, and CL and V increased significantly; the AUC(0-t) and MRT(0-t) of ICAC decreased significantly, and V increased significantly; the AUC(0-t) and AUC(0-∞) of PC increased significantly, and MRT(0-t), MRT(0-∞), CL, and V decreased significantly, compared with those of the normal rats. The results suggested that the disease condition of RA in rats had significant effects on the pharmacokinetics behavior of these 5 components. These changes may impact treatment; however, this needs to be investigated further in combination with pharmacodynamic approaches.
With caffeoylquinic acids (NA, CA, CGA, and ICAC), as shown in Table 6, the AUC generally decreased, whereas the CL and V generally increased in the AA model rats compared to normal rats, which indicated that caffeoylquinic acids were eliminated faster in the AA model rats. In contrast, PC exhibited the opposite trend, as the AUC increased, and CL and V decreased, which indicated that the pharmacokinetic characteristics of different compound categories under the disease condition of RA in rats changed significantly. The results showed that the RA state could change the pharmacokinetic characteristics of the 5 components of P. forrestii extract after intravenous administration. Especially, PC was reported as a toxic medicine with anti-inflammation features, the excessive use of which leads to premature ventricular episodes, ventricular fibrillation, and atrial adverse reactions, such as fibrillation and atrioventricular block. 22 Our results showed that there was a higher concentration of PC in the blood of AA model rats than normal rats, which suggested that we should attach great importance to this.
CA, a component with a special difference in pharmacokinetic parameters compared to the other caffeoylquinic acids used in this study, exhibited a significantly increased MRT and significantly decreased V in the AA model rats, compared to the normal rats, which indicated that CA was eliminated more slowly in AA model rats than in normal rats, and thus, the residence time was extended to characterize better the role of this component. It was speculated that the reason for this difference might be because the vascular response was the central part of the inflammatory response. Inflammation leads to tissue vasodilation and increased capillary permeability, 23 and, mainly due to these changes, may lead to changes in drug-metabolizing enzymes, cell membrane permeability, transport proteins, and microbial flora, thereby changing the distribution, metabolism, and excretion processes in vivo, thus causing changes in pharmacokinetic parameters. 24 However, this hypothesis is unconfirmed and needs to be validated by further studies.
Conclusions
This study mainly compared the pharmacokinetic differences of 5 components in P. forrestii extract in normal rats and AA model rats. The results demonstrated that the pharmacokinetic profiles of the 5 components were significantly different in model rats compared to normal rats, which indicated that the pathological condition can alter the pharmacokinetics of drugs in vivo. Therefore, under a pathological condition, it is necessary to pay special attention to adjusting the dosage of drugs to avoid toxic side effects. These pharmacokinetic results may provide a basis for further research on P. forrestii.
Experimental
Chemicals and Reagents
P. forrestii, purchased from the medicinal materials market in Wandongqiao, Guiyang, Guizhou, China, was authenticated as the dried root of P. forrestii by Professor Qing-De Long (Department of Pharmacognosy, Guizhou Medical University, China). Reference samples of CA (batch no. 110753‐201415, purity: ≥98%) and PC (batch no. 111793‐200901, purity: ≥98%) were purchased from the National Institutes for Food and Drug Control (Beijing, China), and the IS, puerarin (batch no. BCY-0245, purity: ≥98%), from Jiangxi Cao Caoyuan Biotechnology Co., Ltd. (Jiangxi, China). Reference substances of NA (batch no. AB7050442), CGA (batch no. AB7061002), and ICAC (batch no. wkq17120111), all purity ≥98%, were purchased from Sichuan Weikeqi Biological Technology Co., Ltd. (Sichuan, China). Freund’s complete adjuvant (CFA) (batch no. 1002630097) was bought from Sigma-Aldrich (St Louis, MO, USA), and saline from Guizhou Kelun Pharmaceutical Co., Ltd. (Guizhou, China). Distilled water was used for all experiments, purchased from Guangzhou Watson’s Co., Ltd. (Guangzhou, China).
Preparation of P. forrestii Extracts
P. forrestii (6 kg) was extracted with 70% ethanol, twice, in an 8:3 ratio for 1.5 hours and 1.0 hour, respectively. After filtration, the filtrates were combined, and concentrated to 1 g mL−1 under reduced pressure (in terms of crude drug amount). The mixture was extracted 3 times with a water-saturated n-butanol solution. The n-butanol solutions were combined, the solvent recovered under reduced pressure, and the residue dried under vacuum at 45 ℃. The extraction rate was 3.68%. The contents of NA, CA, CGA, ICAC, and PC in P. forrestii extract were 0.63%, 2.65%, 0.93%, 0.58%, 0.37%, respectively.
Chromatographic Conditions
Samples were analyzed by ultra-performance liquid chromatography-tandem mass spectrometry (UPLC-MS). Chromatographic separation was carried out with an UPLC BEH C18 column (2.1 mm × 50 mm, 1.7 µm; Waters Crop, Milford, MA, USA). The separation flow rate was 0.30 mL min−1, the column temperature was 45 °C, and total time of a single run was 6.0 minutes. The mobile phase was 0.1% aqueous formic acid (A) — 0.1% formic acid acetonitrile (B). The gradient elution was used as follows: 5% B (0 minutes), 15% B (2 minutes), 18% B (3.8 minutes), 95% B (4.5 minutes), 85% B (4.7 minutes), 5% B (5 minutes), and 5% B (6 minutes). The injection volume was 1 µL.
MS analysis was performed with a Water Triple-Quadrupole Mass Spectrometer, equipped with an electrospray ionization source. The main working parameters were set as follows: the capillary voltage, 3.0 kV; ion source temperature, 120 ℃; desolvation temperature, 350 ℃; nebulizer gas (N2), 650 L h−1; and collision gas (Ar), 0.15 mL min−1. The scanning mode was single-ion monitoring for the 5 components and puerarin (IS). The optimized mass parameters are shown in Table 7.
Mass Spectrometric Conditions.
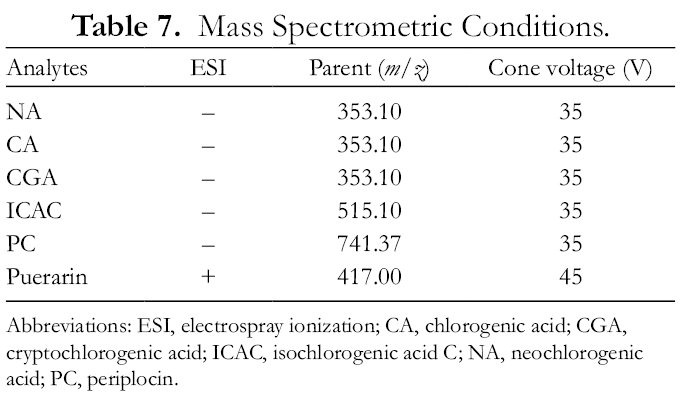
Abbreviations: ESI, electrospray ionization; CA, chlorogenic acid; CGA, cryptochlorogenic acid; ICAC, isochlorogenic acid C; NA, neochlorogenic acid; PC, periplocin.
Preparation of Calibration Standards of QC Samples
Stock solutions of NA, CA, CGA, ICAC, and PC were separately weighed and dissolved in methanol to obtain final concentrations of 1.074, 1.034, 1.020, 1.016, and 1.058 mg mL−1, respectively. Stocks were serially diluted with methanol to yield a working standard solution, from which standard curves for each component were generated. The appropriate amount of puerarin was dissolved in methanol to obtain the IS solution (20 ng mL−1), working standard solution (100 µL) ,and IS solution (50 µL), which were added to blank plasma (100 µL) to prepare the calibration standard solutions at final concentrations of NA, CA, CGA, ICAC, and PC at 1.1-2148.0, 5.2-4136.0, 5.1-2040.0, 1.0-510.0, and 0.2-2116.0 ng mL−1, respectively. The QC plasma samples that contained NA (5.4, 107.4, and 1074.0 ng mL−1), CA (20.7, 103.4, and 2068.0 ng mL−1), CGA (20.4, 102.0, and 1020.0 ng mL−1), ICAC (5.1, 50.8, and 101.6 ng mL−1), and PC (1.1, 52.9, and 1058.0 ng mL−1) were prepared in the same way.
Method Validation
The method validation assays were carried out according to the nonclinical drug pharmacokinetic study technical guideline (China Food and Administration 2014) and the Bioanalytical Method Validation Guideline (Chinese Pharmacopoeia 2015, Vol. 4).
Specificity and Selectivity
Specificity and selectivity were assessed by comparison of the chromatogram of blank plasma: blank plasmas spiked with NA, CA, CGA, ICAC, PC, and IS, and plasma sample obtained after the intravenous administration of P. forrestii.
Linearity and the LLOQ
Calibration curves were constructed, as described in the section “Plasma Samples Preparation”. Linearity was evaluated by plotting the peak area (y) of analytes to IS versus the nominal concentration (x) of analytes using a 1/x weighted least-squares linear regression. 25 A signal-to-noise ratio ≥10 was defined as the LLOQ.
Accuracy and Precision
The QC samples at 3 concentrations (low, medium, and high) were measured on the same day (intraday) and on 3 consecutive days (interday) to calculate precision and accuracy. Precision was expressed as the relative standard deviation (RSD, %), and accuracy was calculated using the following equation: mean of the (measured concentration/spiked concentration) ×100%. The analysis of samples was repeated 5 times.
Recovery and Matrix Effect
The extraction recovery of the analytes was calculated by comparison of the peak area ratios of pretreated QC samples at low, medium, and high concentrations with those of post-extracted supernatant spiked with the reference standard at the same concentrations. The effect of the matrix was determined by comparison of the peak area of the supernatant after plasma extraction with that of the analytes dissolved in the same concentration of methanol. The analysis of QC samples was repeated 5 times.
Stability
The stability of the QC samples at 3 concentrations (low, medium, and high) after preparation was investigated under 3 conditions: post-preparation stability (at approximately 20 ℃ for 6 hours), refrigeration stability (at 4 ℃ for 8 hours), and freeze–thaw cycles (3 times, at −20 ℃ to 20 ℃). The stability was determined on 3 days.
Dilution Effect
For plasma samples in which the drug concentration exceeded the linear range, they were diluted with blank plasma before analysis; thus, it was necessary to examine the dilution effect on plasma samples. The method was as follows: a high-concentration standard plasma sample that contained NA (6873.6 ng mL−1), CA (14476.0 ng mL−1), CGA (7140.0 ng mL−1), ICAC (609.6 ng mL−1), and PC (1481.2 ng mL−1) was diluted with blank plasma (2 × 5 × 5 times) to the corresponding concentration. Five replicates were analyzed, and the result was expressed in the form of recovery.
Pharmacokinetic Studies
Drug administration and plasma sample collection
Healthy specific-pathogen-free Sprague-Dawley rats of 225 ± 15 g were supplied by Changsha Tianqin Biotechnology Co., Ltd. (Changsha, China, certificate No. SCXK [Xiang] 2014‐0010). Rats were housed at 20-25 ℃ in a humidity of 50%. They were fed with standard laboratory food and water, and acclimatized to the environment for 1 week prior to the experiment.
The rats were randomly divided into 2 groups (n = 5 per group): normal group and model group (AA). Following methods from the literature, 26,27 0.1 mL of CFA was injected into the right hind footpad of each rat in the model group on day 1, while the rats in the normal group were injected with the corresponding amount of physiological saline. After the primary injection, the rats were injected with CFA/physiological saline (0.1 mL) again on day 7. On day 21, the 2 groups of rats were injected with 177.78 mg/kg of P. forrestii extract in the tail vein.
Before the experiment, rats were fasted for 12 hours and received water ad libitum. The next day, rats were injected with the P. forrestii extract in the tail vein. At 0.0833, 0.1667, 0.3333, 0.5, 0.6, 1, 1.33, 1.67, 2, and 2.5 hours after the intravenous administration, approximately 0.25 mL of venous blood was placed in a 1.5 mL plastic centrifuge tube coated with heparin sodium, and centrifuged at 6000 rpm for 6 minutes, following which 100 µL of plasma was separated and stored in a refrigerator at −20 ℃ until analysis.
Plasma Samples Preparation
The plasma sample (100 µL) was mixed with methanol (100 µL) and 50 µL of puerarin (20 ng mL−1), and vortexed for 30 seconds. Then, 50 µL of 10% formic acid was added, vortexed for 30 seconds, and 400 µL of methanol was added. This was vortexed for 5 minutes, and sonicated for 10 minutes. After centrifugation at 12 000 rpm for 10 minutes, the supernatant was placed in a centrifuge tube until dry with a stream of nitrogen at 37 °C. The residue was reconstituted with 200 µL of the initial mobile phase solution and centrifuged at 13 000 rpm for 10 minutes. The supernatant was placed in an injection bottle and analyzed by UPLC-MS.
Statistical Analysis
DAS2.0 software (Mathematical Pharmacology Professional Committee of China, Shanghai, China) was used to calculate pharmacokinetic parameters. The data are expressed as mean ± SD. Statistical analysis was performed using the Statistical Product and Service Solutions statistical software package (SPSS11.5, SPSS Inc., Chicago, IL, USA). P < .05 was considered statistically significant.
Footnotes
Statement of Human and Animal Rights
All procedures involving animals in this study were conducted in accordance with the Animal Ethics Committee of Guizhou Medical University (No1603125)-approved protocols.
Declaration of Conflicting Interests
The author(s) declared no potential conflicts of interest with respect to the research, authorship, and/or publication of this article.
Funding
The author(s) disclosed receipt of the following financial support for the research, authorship, and/or publication of this article: This work was supported by the National Natural Science Foundation of China (grant numbers 81660691/U1812403); Guizhou Science and Technology Department (grant numbers [2019] 5660, [2018]4006); and Guiyang Science and Technology Bureau (grant number [2017]30-29).