
Abstract
Tongluo-Qutong rubber plaster (TQRP) is a well-known traditional Chinese medicine prescription for the treatment of osteoarthritis and cervical spondylosis. Due to a lack of in vivo permeation data, the active ingredients of TQRP have not been fully elucidated, presenting a huge obstacle to quality evaluation, pharmacokinetic studies, and safety assessment of TQRP for clinical application. In this study, a selective and reproducible ultraperformance liquid chromatography tandem mass spectrometry method was developed and validated for percutaneous microdialysis and pharmacokinetic experiments. In the percutaneous microdialysis study, the mean area under the concentration–time curve (AUC0-24h) of emodin (EMO) and piperine (PIP) were 127.1 and 2603.6 h·ng/mL, respectively. In the pharmacokinetic study, ferulic acid (FA), EMO, and PIP were determined in plasma samples. The mean AUC0-32h values of FA, EMO, and PIP in plasma were 15441.5, 202.0, and 1704.5 h·ng/mL, respectively. The in vivo exposure levels of active ingredients such as FA, EMO, and PIP after dermal administration of TQRP provide insights and data to support identification of its bioactive components and further study of its mechanism of action.
In recent years, significant attention has been paid to in vivo performance after dermal administration of traditional Chinese medicine (TCM) preparations. 1 The active ingredients of TCM preparations for dermal use are extremely complex and present in low concentrations after transdermal absorption and distribution. Due to the limited availability of in vivo data and research, the active ingredients of these dosage forms have not been fully elucidated. This presents a huge obstacle for quality evaluation, pharmacokinetic studies, and safety assessment of TCM dermal preparations for clinical application. Evaluation of exposure and behavior of active ingredients in vivo after dermal administration of TCM prescriptions, therefore, plays a role in bioactive constituent discovery and determination of pharmacological mechanism.
Tongluo-Qutong rubber plaster (TQRP) is a typical Chinese patent prescription consisting of 13 different TCMs: Angelicae Sinensis Radix, Chuanxiong Rhizoma, Carthami Flos, Kaempferiae Rhizoma, Zanthoxyli Pericarpium, Piperis Fructus, Caryophylli Flos, Cinnamomi Cortex, Piperis Longi Fructus, Zingiberis Rhizoma, Rhei Radix et Rhizoma, Borneolum Syntheticum, and Camphor. It has been widely used in clinical practice for the treatment of cervical spondylosis and osteoarthritis. In the Chinese Pharmacopoeia, only borneol and camphor are specified as quality control (QC) standards, 2 which seems insufficient to indicate efficacy. Furthermore, currently available literature on TQRP is limited to studies on either content determination or pharmacodynamic evaluation of a single indicator component. 3 -5 Some active ingredients in TQRP with anti-inflammatory and analgesic pharmacological effects have previously been studied according to the indications of TQRP, such as ferulic acid (FA) from Angelicae Sinensis Radix, emodin (EMO) from Rhei Radix et Rhizoma, and piperine (PIP) from Piperis Fructus. 6 -8 However, the transdermal absorption and in vivo performance of these active components has not been reported. Pharmacokinetic studies of TQRP are, therefore, essential to understand the systemic exposure and potential side effects following topical therapy.
As a simple and sensitive sampling technique, microdialysis is widely used to study the distribution of drugs in different tissues in preclinical and clinical environments. 9,10 Microdialysis technology, combined with high-performance liquid chromatography (HPLC), mass spectrometry, and other analytical techniques, dynamically reveals the distribution of TCM ingredients and their metabolites in the body, greatly improving the in vivo analysis of TCM active components. 11 Preclinical microdialysis studies have been conducted in mice, rats, rabbits, squirrels, and dogs, 12,13 providing accurate in vivo analytical data with reduced harm to experimental animals.
In previous experiments, an analytical method was established to determine the main indicator components in TQRP and used to evaluate in vitro skin permeation. 14 In this study, we have determined the concentrations of 2 analytes (EMO and PIP) in dialysates and 3 analytes (FA, EMO, and PIP) in plasma samples after dermal administration of TQRP by establishing a ultraperformance liquid chromatography tandem mass spectrometry (UPLC-MS/MS) analytical method. This exploration of exposure to active ingredients in dermis and plasma provides data to support the clinical application of TQRP.
Results and Discussion
UPLC-MS/MS Instrumentation and Chromatographic Conditions
The selection of the mobile phase was conducted by assessing its influence on chromatographic peak shape and retention time. Methanol, acetonitrile, aqueous formic acid, and pure water were evaluated as mobile phases. The results showed that satisfactory results were obtained when pure water–acetonitrile was used as the mobile phase. Gradient elution was most effective for the separation of analyte and internal standard (IS) peaks. Since biological samples contain low drug concentrations and large amounts of interference, it is necessary to optimize the pretreatment process to remove interference and improve specificity. In this experiment, various methods were investigated for the treatment of plasma samples. The results showed that extraction with solvents such as ethyl acetate and tert-butyl methyl ether was not so effective as protein precipitation. During investigation of protein precipitants such as acetonitrile, methanol, and methanol:acetonitrile (1:1), it was found that recovery of PIP and EMO by acetonitrile precipitation from plasma was high, but FA could not be detected. Addition of hydrochloric acid to provide an acidic environment facilitates precipitation of organic acid components such as FA. Different concentrations of hydrochloric acid were compared and the best response was obtained by adding 5 µL of 5 mol/L hydrochloric acid. Compared with other methods, UPLC-MS/MS gave a lower limit of detection (LLOD) with high-throughput capability and shorter run time.
Method Validation for Rat Dialysate Samples
The validated method was successfully used to quantify free concentrations of analytes in the dermis of rats employing a microdialysis technique. This approach gave the potential to know the real concentrations of analytes present in living skin. The specificity results indicated that there was no significant endogenous interference at the retention times of EMO and PIP peaks.
After calculating the individual slopes and intercepts for each curve, the linearity of the standard curve in Table 1 was examined in 6 different runs. The slope of the obtained calibration curve did not change significantly, and the intercept obtained was close to the theoretical zero value, demonstrating good consistency of the measurement system. The calibration curves were validated over the concentration ranges of 0.4‐200 ng/mL for EMO and 2‐1000 ng/mL for PIP. The goodness of fit (r) was found to be greater than 0.993. The LLOD values of EMO and PIP were 0.2 and 1 ng/mL. The LLOQ values of EMO and PIP were 0.4 and 2 ng/mL. The LLOQ values of EMO and PIP were within the acceptance criteria for accuracy (relative error, %RE, was 0.9%-3.4%) and precision (relative standard deviation, %RSD, was 3.6%-7.4%).
Linearity for Assay of Analytes in Dialysate.

Abbreviations: EMO, emodin; PIP, piperine.
Table 2 shows satisfactory intra-assay precision and interassay precision and accuracy values, which were determined from the analysis of 6 dialysate QC samples at low, medium, and high concentrations of analytes. The stability results are summarized in Table 3. A maximum deviation of 11.4% in the microdialysates was observed, demonstrating that the analytes were stable under all conditions employed in this study.
Precision and Accuracy of Analytes in Dialysate (Mean ± SD, n = 6).
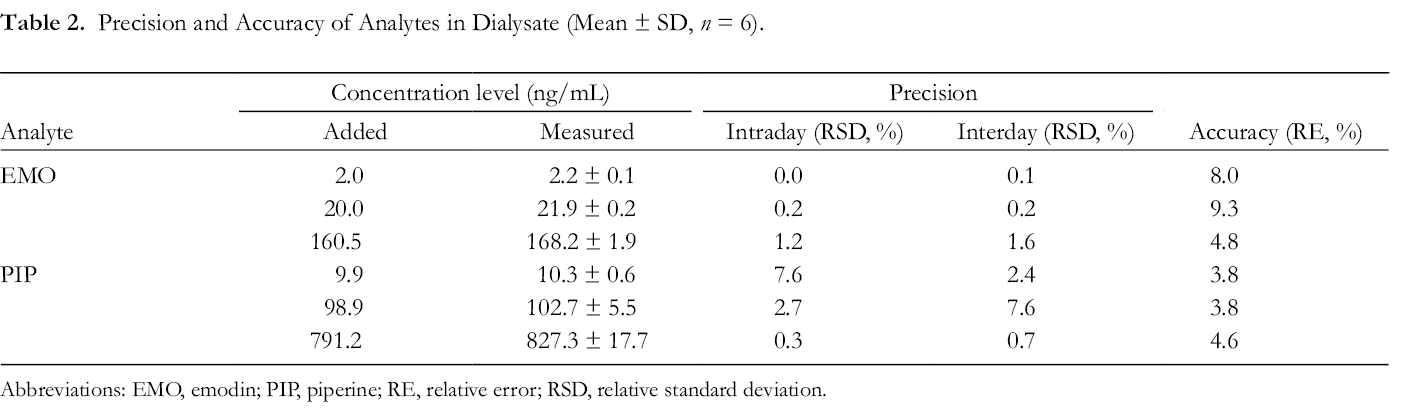
Abbreviations: EMO, emodin; PIP, piperine; RE, relative error; RSD, relative standard deviation.
Stabilities of Analytes in Dialysate (Mean ± SD, n = 6).

Abbreviations: EMO, emodin; PIP, piperine; RE, relative error.
Recovery From In Vivo Microdialysis
A linear equation was plotted of C out− C in versusC in(C in, the concentration of the standard solution; C out, the concentration in dialysate), and the slope of the line gave the recovery. Figure 1 illustrates the linear regression between perfusate (C in) and dialysate (C out); the equation and recovery are shown in Table 4.

Recovery of in vivo microdialysis. C in, the concentration of the standard solution; C out, the concentration in dialysate; EMO, emodin; PIP, piperine.
Recovery of Analytes in Dialysate (Mean ± SD, n = 3).
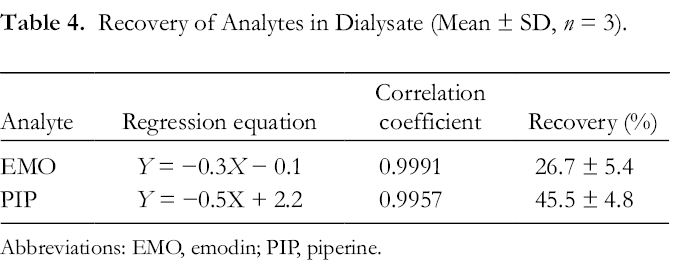
Abbreviations: EMO, emodin; PIP, piperine.
The recovery rate of the probe should consider the nature of the solvent on both sides of the dialysis membrane. Initially, the perfusion solution was imitated with a physiological saline solution, but almost no analytes were detected. Using 30% ethanol in saline solution as the receiving medium gave higher percutaneous permeation. 14 The effect of flow rate on the recovery of the probe should also be considered. Generally, a lower flow rate could sufficiently increase exchange between the perfusion solution inside the dialysis membrane and the in vivo environment. Therefore, considering the time cost, the flow rate was set at 1 µL/min. Comparing the recovery values of the 2 analytes, the lower recovery rate of EMO may be due to its stronger lipophilicity. This is consistent with the reports that lipophilic components are easily adsorbed on microdialysis probes, resulting in lower recovery in vivo. 15
Microdialysis Study
The validated UPLC-MS/MS method was successfully applied to determine the concentrations of EMO and PIP in subcutaneous tissue following transdermal administration of TQRP (containing 199.6 µg/kg EMO and 4924.2 µg/kg PIP). All of the pharmacokinetic parameters for the dialysate samples were obtained using WinNonlin 8.1.
The results from the percutaneous microdialysis study are shown in Figure 2. EMO and PIP were detected in the dialysate samples, indicating that the 2 active ingredients can penetrate into the tissue fluid of the dermis through living skin. The pharmacokinetic parameters for the dialysate samples are summarized in Table 5. The concentrations of the 2 active components were significantly increased after 4 hours and the maximum concentration (C max) values of EMO and PIP were 12.6 and 233.3 ng/mL, respectively. The profiles revealed that TQRP provides a degree of sustained release and slower onset rate as a preparation for transdermal administration. During 4‐24 hours, the levels of the 2 active components were stable without significant fluctuations. Transdermal administration provided a constant drug concentration for a long time, avoiding peak and valley phenomena and thus reducing side effects of the drug. According to the experimental results, the mean retention times of EMO and PIP were 11.6 and 12.4 hours, respectively, and no significant decrease of concentration was observed over 12‐24 hours. To ensure safety, it is recommended that the TQRP preparation is used for longer rather than replaced every 12 hours in clinical practice. The tiny amount of FA contained in the rubber plaster and the limitation of the solvent and sampling location in the microdialysis sampling method made it difficult to detect FA in the dialysis sample.

Mean dialysate concentration–time profile after transdermal Tongluo-Qutong rubber plaster delivery (mean ± SD, n = 5).
Main Pharmacokinetic Parameters of Analytes in Dialysate After Transdermal Administration of TQRP (Mean ± SD, n = 5).

Abbreviations: AUC, area under the concentration–time curve; C max, maximum concentration; EMO, emodin; MRT, mean residence time; T max, time of reaching C max; TQRP, Tongluo-Qutong rubber plaster.
Method Validation for Rat Plasma Samples
No endogenous interference was observed at the retention times of the analytes or IS in blank plasma, which proved the specificity of the assay. Regression equations, linear ranges, and correlation coefficients are listed in Table 6. All calibration curves showed good linearity with correlation coefficients larger than 0.99. The LLOD values of FA, EMO, and PIP were 10, 0.5, and 5 ng/mL. The LLOQ values of FA, EMO, and PIP were 20, 1, and 10 ng/mL. The LLOQ values were within the acceptance criteria of accuracy (%RE was 2.6%-4.2%) and precision (%RSD was 3.6%-10.4%). The precision, accuracy, extraction recovery, and matrix effect for all analytes in rat plasma are summarized in Tables 7 and 8. Intra- and interday precision values were less than 4.6% and 4.8%, and the accuracy was within 11.6% in plasma, indicating the overall reproducibility of the method. Average extraction recoveries of FA, EMO, and PIP at 3 QC levels were 36.8%-39.3%, 84.9%-92.0%, and 40.7%-49.8%, respectively. The efficiency of extraction recovery was within acceptable limits. Matrix effect values were 95.4%-115.8% for FA, 29.0%-37.0% for EMO, and 49.4%-60.4% for PIP at 3 QC levels. No significant matrix effect was observed during the overall determination, which indicated that no coeluting substance influenced the ionization of the analytes or IS. The stabilities of FA, EMO, and PIP in rat plasma under the described conditions are listed in Table 9. The results demonstrated that all analytes were stable in rat plasma on storage at ambient temperature for 6 hours, on storage for 30 days at −20 ℃, during freeze–thaw cycles and on storage in the autosampler at 4 °C for 24 hours. The stability data satisfy the requirements of a routine pharmacokinetic study.
Linearity for Assay of Analytes in Rat Plasma.

Abbreviations: EMO, emodin; FA, ferulic acid; PIP, piperine.
Precision and Accuracy of Analytes in Rat Plasma (Mean ± SD, n = 6).

Abbreviations: EMO, emodin; FA, ferulic acid; PIP, piperine; RE, relative error; RSD, relative standard deviation.
Extraction Recovery and Matrix Effect of Analytes in Rat Plasma (Mean ± SD, n = 6).

Abbreviations: EMO, emodin; FA, ferulic acid; PIP, piperine; RSD, relative standard deviation.
Stabilities of Analytes in Rat Plasma (Mean ± SD, n = 6).

Abbreviations: EMO, emodin; FA, ferulic acid; PIP, piperine; RE, relative error.
Pharmacokinetics Study
The validated UPLC-MS/MS method was successfully applied to determine the concentrations of FA, EMO, and PIP in rat plasma following transdermal administration of TQRP (containing 221.5 µg/kg of FA, 399.1 µg/kg of EMO, and 9848.3 µg/kg of PIP). As can be seen from Figure 3, the concentrations of EMO and PIP were significantly increased after 4 hours, which was consistent with the previous percutaneous microdialysis results, indicating that EMO and PIP were slowly absorbed into the systemic circulation after crossing the barrier of the skin. 16 However, a higher blood concentration of FA after 15 minutes illustrated that FA, as a small molecule, could penetrate the skin more easily compared with EMO and PIP, consistent with the rapid absorption of FA reported in the literature. 17

Mean plasma concentration–time profile after transdermal Tongluo-Qutong rubber plaster delivery (mean ± SD, n = 5).
Using WinNonlin 8.1 software, the pharmacokinetic parameters of the active ingredients FA, EMO, and PIP in the blood after the application of TQRP were calculated. The results are shown in Table 10. The maximum plasma concentrations of FA, EMO, and PIP were 1095.3, 24.6, and 132.6 ng/mL, respectively. The mean area under the concentration–time curve (AUC0-32h) values of FA, EMO, and PIP were 15441.5, 202.0, and 1704.5 h·ng/mL, respectively, with larger SD values attributed to the large individual absorption differences.
Main Pharmacokinetic Parameters of Analytes in Plasma After Transdermal Administration TQRP (Mean ± SD, n = 5).

Abbreviations: AUC, area under the concentration–time curve; CL/F, apparent total body clearance ; C max, maximum concentration; EMO, emodin; FA, ferulic acid; MRT, mean residence time; PIP, piperine; t 1/2, terminal elimination half-life; T max, time of reaching C max; TQRP, Tongluo-Qutong rubber plaster; Vz/F, apparent volume of distribution.
Compared with the very low concentration in microdialysis samples, FA was determined in plasma samples at a maximum concentration of 1095.3 ng/mL, demonstrating the free permeation across the skin but limited exchange in microdialysis fluid. Comparing the obtained parameters (C max, AUC0-t, and AUC0-∞) for EMO and PIP in the pharmacokinetics and microdialysis studies, weak correlations were found in both active components due to differential influences such as drug plasma metabolism, biosample pretreatment, or microdialysis recovery. With regard to the ratios of EMO and PIP in plasma and microdialysate, PIP/EMO in C max, AUC0-t, and AUC0-∞ were decreased from 18.5, 20.5, and 23.9 times in dialysate to 5.4, 8.4, and 6.7 times in plasma, illustrating the easy transportation and rapid in vivo elimination of PIP compared with EMO.
Conclusion
In summary, a selective and reproducible UPLC-MS/MS method was developed and successfully employed in percutaneous microdialysis and pharmacokinetic experiments after dermal administration of TQRP. In the percutaneous microdialysis study, the mean AUC0-24h values of EMO and PIP were 127.1 and 2603.6 h·ng/mL, respectively. In the pharmacokinetics study, FA, EMO, and PIP were determined in plasma samples. The mean AUC0-32h values in plasma were 15441.5, 202.0, and 1704.5 h·ng/mL for FA, EMO, and PIP, respectively. The exposures of active ingredients such as FA, EMO, and PIP in vivo after dermal administration of TQRP provide insights and data to support identification of its bioactive components and further study of its mechanism of action.
Experimental
Materials
TQRP (batch no. 161206) was provided by Henan Lingrui Pharmaceutical Co., Ltd. FA (99.0% purity, batch no. 110773‐201614), EMO (98.7% purity, batch no. 110756‐201512), PIP (98.9% purity, batch no. 110775‐201706), and carbamazepine (as IS, 98.5% purity, batch no. 110723‐201413) were all purchased from the National Institute for the Control of Pharmaceutical and Biological Products (Beijing, China). Acetonitrile and methanol of HPLC grade were obtained from Fisher Scientific Co. (Fair Lawn, NJ, USA). All reagents were of analytical grade and water obtained from a Milli-Q purification system (Millipore, Billerica, MA, USA) was used for all experiments.
Sprague-Dawley rats (weighing 250 ± 20 g; Vital River Experimental Animal Tech. Co. Ltd; Tianjin, China; License: SCXK 2016‐0006, Tianjin, China) were housed at room temperature with free access to drinking water.
UPLC-MS/MS Instrumentation
All of the samples were analyzed using a UPLC/UV/MS/MS system consisting of an Agilent series 1290 UPLC system and an Agilent 6460 triple quadrupole mass spectrometer (Agilent Technologies, Santa Clara, CA, USA). The chromatographic separation of analytes was performed on an Acquity UPLC HSS T3 C18 column (100 × 2.1 mm, 1.8 µm, Waters, CA, USA) at a column temperature of 40 °C. Chromatographic separation was achieved with gradient elution using a mobile phase consisting of water (A) and acetonitrile (B). The UPLC gradient schedule was set as follows: 20%→50% B at 0.0‐9.0 minutes; 50%→90% B at 9.0‐10.0 minutes; 90%→90% B at 10.0‐13.0 minutes; 90%→20% B at 13.0‐14.0 minutes; 20%→20% B at 14.0‐17.0 minutes. Efficient separation and symmetrical peaks were obtained at a flow rate of 0.3 mL/min. The injection volume of samples was set at 5 µL. The detection of analytes was in multiple reaction monitoring mode (MRM) using electrospray negative ionization (ESI). The ESI configuration was set as follows: gas temperature 350 °C; gas flow rate 11 L/min; nebulizer 20 psi; capillary 4000 V. Data acquisition and elaboration were performed using the Agilent Mass Hunter Workstation.
Preparation of Standard Solutions
For microdialysis standard solutions, stock solutions of EMO and PIP were prepared in methanol and further diluted with saline:ethanol (70:30, v/v). For plasma QC samples, stock solutions of FA, EMO, and PIP were prepared in methanol. The stock solution of each analyte was further diluted with methanol to obtain the working solution. Samples of working solutions (100 µL) at different concentrations were evaporated under nitrogen flow and then reconstituted in 100 µL blank plasma to obtain calibration standard samples of the analytes. The QC samples were prepared from the same blank plasma at low, medium and high concentration levels, which were used to develop the analytical method during the analytical run. All solutions were kept at 4 °C and brought to room temperature before use.
Sample Preparation
The dialysate samples (5 µL) were directly injected into the LC-MS/MS system for analysis. Plasma samples were prepared according to the following steps: HCl (10 µL, 5 mol/L) was added to plasma sample (100 µL) in a 1.5-mL plastic centrifuge tube. After vortex-mixing for 30 seconds, the IS (500 µL, 200 ng/mL) was added and the mixture vortexed for 5 minutes and centrifuged at 3712 g for 10 minutes. The upper organic layer was carefully transferred to another tube and evaporated under nitrogen flow. The residue was reconstituted in acetonitrile (100 µL) and vortex-mixed for 3 minutes. A 5-µL aliquot was then injected into the LC-MS/MS system for analysis.
Method Validation for Microdialysis Samples
Validation was conducted in terms of specificity, linearity, accuracy, precision and stability during sample storage and processing. The specificity was assessed by comparing the chromatograms of blank dialysates with those of dialysate samples from rats to assess endogenous interference.
To evaluate linearity, the calibration curves were constructed using 6 standards ranging from 0.4 to 200 ng/mL for EMO and from 2 to 1000 ng/mL for PIP. The concentrations in dialysate samples were determined using the linear regression line (1/x) of the concentration standard versus peak area. The LLOD and lower limit of quantification (LLOQ) were used to determine the sensitivity of the method with signal-to-noise ratios of 3:1 for LLOD and 10:1 for LLOQ. Drug stability in dialysates was assessed after storage in the autosampler at room temperature for 4 hours and for 30 days at 4 ℃ after processing.
Recovery From In Vivo Microdialysis
In the microdialysis experiment, the recovery rate is usually divided into 2 types: in vitro recovery and in vivo recovery. 18 In this study, we determined the in vivo recoveries of analytes. Animals were kept in an environmentally controlled breeding room for 1 week before the experiments. Linear microdialysis probes (CMA Microdialysis AB, Kista, Sweden), featuring a membrane of 10 × 0.24 mm with a 6 kDa molecular weight cutoff (MWCO), were carefully implanted into the rat dermis after anesthetization with urethane (1.5 g/kg intraperitoneal injection). The dialysate, a series of drug concentrations (8, 16, 32, 63, and 126 ng/mL for EMO; 14, 27, 55, 109, and 218 ng/mL for PIP) in ethanol:normal saline (30:70, v/v), was perfused through the linear microdialysis probes at a flow rate of 1.0 µL/min by a microinjection pump (CMA 402, CMA Microdialysis AB, Kista, Stockholm, Sweden). After 30 minutes of initial perfusion, samples were collected every 1 hour. The results were the average of 3 replicates for each concentration.
In Vivo Percutaneous Microdialysis Experiments
Animals were kept in an environmentally controlled breeding room for 1 week before the experiments. The microdialysis method was used to determine the bioavailability of active ingredients in the dermis of rat. Linear microdialysis probes (CMA Microdialysis AB, Kista, Sweden), featuring a membrane of 10 × 0.24 mm with a 6 kDa MWCO, were carefully implanted into the dermis of 5 different rats after anesthetization with urethane (1.5 g/kg intraperitoneal injection). The dialysate, ethanol:normal saline (30:70, v/v), was perfused through the linear microdialysis probes at a flow rate of 1.0 µL/min by a microinjection pump (CMA 402, CMA Microdialysis AB, Kista, Stockholm, Sweden). After probe implantation, the animals were allowed to stabilize for 1 hour. The rats received transdermal administration of TQRP at doses of 199.6 µg/kg for EMO and 4924.2 µg/kg for PIP. To obtain sufficient samples for analysis, dialysate samples were collected every hour for the first 12 hours and every 2 hours from 12 to 24 hours. All dialysate samples were injected into the UPLC-MS/MS system for analysis.
Method Validation for Plasma Samples
Validation was conducted according to the guidelines of China Food and Drug Administration, including specificity, linearity, accuracy, precision, recovery, matrix effect and stability during sample storage and processing.
Any interference from unwanted elements at the elution times of FA, EMO, and PIP was evaluated for specificity. To evaluate linearity, the calibration curves were constructed using standards of 20‐4000 ng/mL for FA, 1‐200 ng/mL for EMO, and 10‐2000 ng/mL for PIP. Linear regression was subsequently carried out using 1/x as a weighting factor. The LLOD and LLOQ were determined as described earlier. RE and RSD on the same day and 3 consecutive days were analyzed to assess intra- and interday accuracy and precision, respectively. The recovery of analytes was determined by comparing the corresponding peak areas of the regularly pretreated QC samples at 3 concentration levels in 6 replicates with post-protein precipitated blank plasma samples at the corresponding concentration. The matrix effect of analytes was evaluated by comparing the corresponding peak areas of the post-protein precipitated blank plasma samples, dried under nitrogen, and reconstituted with the 3 QC concentration standards, in 6 replicates with the standard solutions prepared at the same concentrations diluted with acetonitrile. The stability of analytes in plasma was assessed at 3 QC concentrations in 6 replicates under different conditions. Short-term stability was assessed by reanalysis of QC samples kept at ambient temperature for 6 hours and at 4 °C in the autosampler for 24 hours. Freeze–thaw stability (−20 °C) was checked after 3 freeze and thaw cycles. Long-term stability was assessed at −20 °C in plasma for 30 days. For all plasma stability studies, the test QC samples were analyzed with freshly prepared calibration curves and the results were compared with those obtained from QC samples immediately processed at 0 hour.
Pharmacokinetics Study
Animals were fasted for 12 hours before the experiment but were free to drink water. A piece of rubber plaster (70 cm2) was pasted onto the hairless abdomen of the rat. After 24 hours, the plaster was removed. The skin was wiped softly and carefully to remove residual drug. Serial plasma samples (~0.5 mL each at 0.25, 0.5, 1, 2, 4, 6, 8, 12, 18, 24, 26, 28, 30, and 32 hours after administration) were collected in heparinized tubes by puncture of the eye vein. Four samples were taken after removing the plaster at 24 hours to observe elimination of the medicine. All samples were immediately stored at −20 ℃ until injected into the LC/MS/MS system for analysis.
Data Processing
All in vivo data analyses were conducted by a noncompartmental approach using WinNonlin 8.1. The parameters, such as the C max, time of reaching C max (T max), the AUC0-t, the MRT, and the terminal elimination half-life (t 1/2), were calculated for each individual analyte. All experimental data were expressed as the mean ± SD.
Footnotes
Declaration of Conflicting Interests
The author(s) declared no potential conflicts of interest with respect to the research, authorship, and/or publication of this article.
Funding
The author(s) disclosed receipt of the following financial support for the research, authorship, and/or publication of this article: This work was financially supported by the National Natural Science Foundation of China (81803739).