
Abstract
Vitis vinifera L. leaves from pruning are by-products of the wine industry and represent an important source of secondary raw material, thanks to their polyphenols content. Optimization of the extraction processes is a key factor for their valorization, and Design of Experiment (DOE) could be a tool to obtain the most performing extract in terms of polyphenols quality/quantity and bioactivity. Vitis vinifera Lambrusco leaves were subjected to ultrasound-assisted extractions guided by a 23 factorial design. Three independent parameters (% solvent, time of extraction, and solvent:solid ratio) were considered to evaluate the extraction process by analyzing the extraction yield, the total phenolic content (Folin-Ciocalteu assay), and the antioxidant capacity (DPPH assay). Moreover, the content of the main molecules was identified and quantified by reversed-phase high-performance liquid chromatography coupled with diode array detection and mass spectrometry. The DOE highlighted the best extraction conditions that showed slight changes considering the different evaluating parameters. The highest extraction yield was obtained by extraction with 100% water, 60 minutes of extraction time, and 30:1 solvent:solid ratio, but it was neither the richest in polyphenols nor antioxidant capacity. The latter 2 characteristics were associated with the extraction performed using 50% ethanol, 35 minutes of extraction time, and a 20:1 solvent:solid ratio. That extract also exhibited the highest quantity of flavonols.
Keywords
The concept of circular economy can be defined—in synthetic, but certainly exhaustive terms—as a self-sustaining system in which the output yields are maximized, minimizing the production of waste. What traditionally is considered a waste becomes a by-product, a secondary raw material converted into new marketable products using a panel of sustainable strategies with low environmental impact with respect to the circularity of the organic economy. 1 In this context, Vitis vinifera L. (Vitaceae) leaves from pruning are a promising example of a by-product rich in high-value biomolecules that show interesting biological activities. 2 -6 Among the various examples found in the literature, the antioxidant capacity exhibited by polyphenols is well documented, and, in vivo, seems also to be closely related to vital biological functions such as antimutagenicity, anticarcinogenity, and anti-aging. 7,8 Flavonoids, in particular, are known to exhibit antioxidant properties and, therefore, they represent essential elements in a well-balanced human diet. Moreover, this molecular category showed promising effects in agriculture, controlling weed growth, insect pests, and spread of diseases. 9 To obtain a rich flavonoids extract, the present study considered a by-product of the wine industry represented by the leaves from the pruning of V. vinifera Lambrusco. The key factors of the project were the selection and optimization of the extraction processes. In this perspective, ultrasound-assisted extraction (UAE) using water, ethanol, and their mixture was the chosen method, guided by a Design of Experiments (DOE), to improve the quality of the product and efficiency of the process. DOE enabled the estimation of the influence of 3 independent variables on the result: solvent composition (%), solvent/solid ratio, and time of extraction (minutes), in order to evaluate the effects of the extraction process parameters to maximize yields, polyphenols content, and, in consequence, increment the biological activity in terms of antioxidant capacity. Moreover, these targets were achieved following the guidelines of green chemistry oriented to the minimization of the use of organic solvents, the disposal of which would represent enormous economic and environmental costs. 10
The results reported in Table 1 highlight the significant yield difference between the extractions of the leaves obtained by modifying the parameters. Analyzing the data with the aid of the Pareto chart (Figure 1a), the ethanol-to-water ratio showed a significant negative effect, indicating that the absence of ethanol led to higher yields. However, the solvent-to-solid ratio exhibited a significant positive effect, showing that when a higher ratio is used the yield increases. Time, however, did not show a significant effect. The maximum yield (18.6%) was achieved by the extraction performed with 100% water, the highest solvent/solid ratio (30:1) and the longest extraction time (60 minutes). On the other hand, the phytocomplexes obtained using the parameters at the central point of the research (extracts 9, 10, and 11) showed a slightly lower extraction yield (16.3%) compared with the aqueous extracts, most likely due to the increase of ethanol in the solvent mixture and to the decrease in the solvent/solid ratio. However, the lower extraction yield of the latter extracts was balanced by the highest sensitivity toward polyphenols extraction (Table 1).
Matrix of the Experimental Design 23 (Coded and Real Values) With Responses in Terms of Extract Yield, TPC, and Antioxidant Activity.

TPC, total polyphenolic content. IC50, half-maximal inhibitory concentration.
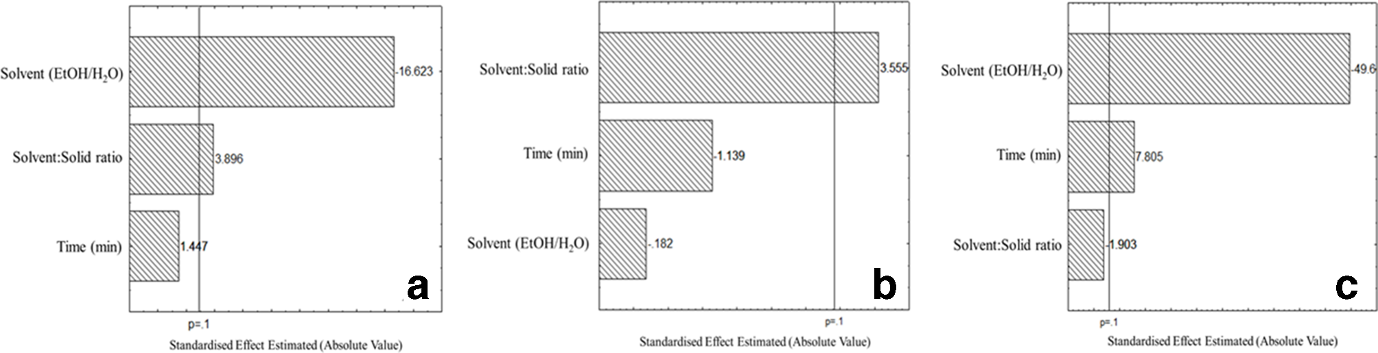
Pareto chart of the effects of the independent studied variables on (a) extract yield (P < 0.1); (b) quantification of TPC (mg gallic acid/g dried extract) (P < 0.1); (c) antioxidant activity expressed in µmol Trolox equivalent/1 g of dried extract (P < 0.1). Experimental data and conditions are shown in Table 1.
The Pareto chart describing the effect of the studied variables on the phenolic extraction (Figure 1b) indicated the solvent-solid ratio as the only variable capable of influencing the polyphenols concentration of the extracts. This variable had a significant positive effect (P < 0.1), showing that the increase of solvent to solid ratio led to higher phenolic contents. Nevertheless, the results reported in Table 1 displayed the highest phenolic content (186.9 mg GAE/g dried extract) in extract 10, performed with ethanol 50% (central points of the DOE), suggesting that polyphenols were more abundant using this solvent mixture. Therefore, the solvent % could have a relevance in the polyphenols extraction. This hypothesis was supported by the results obtained by the total polyphenolic content (TPC) quantification of extracts 7 and 8 (highest solvent-solid ratio and highest time of extraction, but, respectively, 100% water and 100% ethanol) that exhibited lower content than the extractions performed with 50% ethanol. To the best of our knowledge, the literature does not report extractions performed with the same conditions in terms of type of solvents, method, and time of extraction. Moreover, the leaves of this grape variety were never considered, even if it is among the ten most produced in Italy. 11
After the quantification performed using spectrophotometric assay (Folin-Ciocalteu method), the composition of V. vinifera Lambrusco grape leaves extracts was analyzed by liquid chromatography coupled with a diode array detector (DAD) and mass spectroscopy (MS) detector (Figure 2).

Reversed-phase high-performance liquid chromatography diode array detection chromatograms of the performed Lambrusco leaves extracts (Extr 1, 3, 5, and 7 in 100% water; Extr 2, 4, 6, and 8 in 100% ethanol; Extr 9, 10, and 11 in ethanol: water 50%). Peak a, caftaric acid; b, quercetin-3-O-rutinoside; c/d, coelution of quercetin-3-O-glucuronide and quercetin-3-O-glucopyranoside; e, kaempferol-3-O-rutinoside; f, kaempferol-3-O-glucoside; g, quercetin; h, kaempferol.
Extracts were found to be rich in flavonoids, in particular glycosylated flavonols, but one phenolic acid was also detected. All the molecules’ identification was based on the comparison of their retention times, mass, and UV spectral data, with those of standard compounds and published data. In order of elution, trans-caffeoyltartaric acid (caftaric acid) was the first to be identified. It exhibited a single charged ion at m/z 311 (ms2 m/z 179), and an UV absorption with λmax of 331 nm. Peak 2 showed an ion, in negative mode, at m/z 609, an ms2 of 301, and a UV spectrum that could lead to a flavonoid profile. Comparing its retention time with that of the pure molecules and due to the results of the enrichment process, it was identified as quercetin-3-O-rutinoside. The major peak (Figure 2, peak c/d) presented 2 peaks in the ESI-MS- spectra: m/z 477 and 463, indicating a probable coelution of 2 molecules. The ms2 analyses highlight the same fragmentation pattern with the presence of the fragment at m/z 301 (main ms3 fragments at m/z 243, 179, and 151) identified as quercetin, therefore indicating them as quercetin glycosides. Column chromatographic separation was performed to isolate the compounds and make their identification possible. This approach does not, in most cases, separate complex mixtures of flavonoids present in crude plant extracts as well as other chromatographic techniques; nevertheless, where large quantities of the flavonoids are required, as in this case for the 1H nuclear magnetic resonance (NMR) analyses, column chromatography is the method of choice. The chromatographic separation was able to isolate the 2 molecules in 1 fraction and the 1H NMR analysis allowed the precise identification of the compounds as quercetin-3-O-β-glucuronide and quercetin-3-O-β-glucopyranoside. Peak 4 and peak 5 presented an m/z of 593 and 447, respectively. Their ms2 analyses highlighted the same fragment at m/z 285. Comparing their retention times and UV spectra with those of 2 standards, they were identified as kaempferol-3-O-rutinoside and kaempferol-3-O-glucoside, respectively. To the best of our knowledge, kaemferol-3-O-rutinoside is here reported for the first time in extracts of V. vinifera leaves. At higher retention times, quercetin and kaempferol were identified, but not quantified because they were under the limit of quantitation (LOQ) in most of the extracts. Table 2 shows the data concerning the reversed-phase high-performance liquid chromatography diode array detection (RP-HPLC-DAD) quantification of the identified molecules. Caftaric acid and quercetin-3-O-β-rutinoside (rutin) were not quantifiable in the 100% ethanol extractions, and, therefore, the influence of the different parameters on their extraction could not be established by the statistical software. Nevertheless, while the yield of rutin exhibited its highest value in 50% ethanol and decreased in 100% water, those of caftaric acid reached their best in the 100% water extraction, reflecting the solubility behavior of the 2 molecules in the considered solvents. 12 The literature does not report results of analysis of by-products derived from this particular grape cultivar, but it presents data of chemical characterization of other grape leaf varieties. Moreover, each study described a different extraction method with different polyphenolic quantifications. Dresch et al 13 reported quercetin-3-O-glucuronide as the most abundant compound, but did not record the presence of kaempferol and its glycosylated derivatives. Pacifico et al, 14 instead, indicated the presence of other molecules compared with those identified in this research, most probably because of the use of a different solvent and a different grape variety. The Pareto chart, describing the effects of the independent studied variables on the antioxidant activity (Figure 1c), showed the significant contribution of the content of ethanol in the extraction solvent, and of the time of extraction in the evaluation of the bioactivity. The radical scavenging capacity is increased by the reduction of the ethanol proportion in the solvent mixture and by the increase of the extraction time. In effect, Lambrusco leaf extracts exhibited different bioactivity results (Table 1) when these 2 variables were modified, reaching the highest antioxidant activity with 50% ethanolic solution as solvent and 35 minutes of extraction time. In particular, extract 10, performed following the parameters described above, showed a half-maximal inhibitory concentration (IC50) of 7.69 ± 0.06 µg/mL, in line with the value of the positive control that exhibited an IC50 of 3.83 ± 0.14 µg/mL. In contrast, extracts prepared with 100% ethanol exhibited the lowest antioxidant activity, particularly when subjected to 10 minutes of extraction (IC50 68.40 ± 1.70 µg/mL), suggesting the need to use a percentage of water in the solvent mixture to obtain a richer extract in antioxidant compounds. On the other side, the sole use of water as extraction solvent gives better results when compared with the extraction performed with 100% ethanol, showing IC50 values for the radical scavenging activity ranging from 21.24 to 25.42 µg/mL, but still far from the values obtained with 50% ethanol. As reported in Table 2, aqueous extracts are characterized by the highest contents of caftaric acid, molecules with known antioxidant activity, which could be partially responsible for the bioactivity.
Content of Caftaric Acid and Flavonols in Vitis Vinifera Lambrusco Leaves Expressed in Milligrams of Standard Per Gram of Dried Matrix.

Experimental conditions are shown in Table 1.
In contrast, the low activity exhibited by the 100% ethanol extracts could be due to the low quantity of this compound and of quercetin-3-O-rutinoside (both under the limit of detection [LOD]), molecules present in every other extract. To the best of our knowledge, no data on the radical scavenging activity of V. vinifera Lambrusco leaves’ ultrasound-assisted extracts are present in the literature, but studies reporting the activity of leaf extracts of other grape varieties showed higher IC50 values (therefore lower activity) if compared with the present results. Férnandes et al 15 evaluated the antiradical capacity of V. vinifera leaves with DPPH assay and found an IC50 between 148 and 780 µg/mL; L. Pari and A. Suresh 16 reported a 50% inhibition of DPPH of 116.25 ± 2.74 mg/mL. The same paper showed a lower TPC compared with V. vinifera Lambrusco leaves, supporting the evidence that the extraction parameters of 50% ethanolic solution as solvent, 20:1 solvent/solid ratio, and 35 minutes of extraction time could be the most suitable for the extraction of antioxidant compounds from Lambrusco grape leaves.
Experimental
Plant Material
Vitis vinifera L. Lambrusco leaves were provided from CRPA Lab (Reggio Emilia, Italy) after being harvested in September 2016. Leaves were oven dried at 70°C for 24 hours until constant weight with a high-performance oven mod. 2100, milled through a 2 mm sieving ring of a Variable Speed Rotor Mill (Fritsch, Idar-Oberstein, Germany), and immediately stored at −20°C until further use.
Chemicals
All the solvents and reagents employed for analyses were chromatographic grade. Trolox, DPPH (1,1-diphenyl-2-picrylhydrazil), Folin-Ciocalteu reagent, methanol (≥99.9% for HPLC), acetonitrile (≥99.93% for HPLC), formic acid (98% - 100% for HPLC), ethyl acetate (≥99.8% for HPLC), acetic acid (≥99.9% for HPLC), deuterium oxide, deuterated methanol, gallic acid (TraceCERT), and silica gel were purchased from Sigma-Aldrich Italy (Milano, Italy). Ethanol absolute (≥99.8% Normapur) was purchased from VWR International Srl (Milano, Italy).
Ultrasound-Assisted Extraction
UAE was performed with Ultrasonik 104X (Ney Dental International, Bloomfield, USA) under a working frequency of 48 kHz, at room temperature. Fifteen grams of dried and milled V. vinifera Lambrusco leaves were sonicated with various percentages of hydroethanolic solvents (100% water, 50% ethanol in water, 100% ethanol) for different times, following the DOE directions. A total of 11 extracts were obtained, and each extract was prepared in triplicate. They were then filtered through Whatman No. 40 paper under vacuum, and the solutions were lyophilized and stored at −20°C until analysis.
Design of Experiments
With the objective of determining experimental conditions to lead to a maximum extraction yield, a 23 factorial experimental design, including 3 repetitions at the central point, was carried out, totalling 11 runs. 17,18 The effects of ethanol-to-water ratio (0%-100%), solvent-to-solid ratio (10-30), and time (10, 60 minutes) were evaluated, keeping fixed the extraction temperature and the ultrasound working frequency. All the analyses were performed in triplicate. The software Statistica 10.0 (Statsoft Inc., Tulsa, Oklahoma, USA) was used to assist the design and the statistical analysis of experimental information, adopting a confidence level of 90% (P < 0.1). Data are present in Pareto charts that highlight the effects of the evaluated parameters.
Determination of TPC
The determination of the TPC in grape leaves extracts was determined using Folin-Ciocalteu reagent. Each was performed in triplicate using a ThermoSpectronic Helios-γ spectrophotometer (Waltham, Massachusetts, USA), according to a previously described method. 19 The results of TPC are expressed as milligram gallic acid equivalents per g of dry extract.
HPLC Analysis
Vitis vinifera leaves extracts were subjected to RP-HPLC analysis to identify and quantify their main phytomarkers. Their characterization was performed using a JASCO modular HPLC system (Tokyo, Japan, model PU 2089) coupled to an LCQ ion trap mass spectrometer (Thermo Finnigan, Ringoes, USA), and to a diode array apparatus (MD 2010 Plus). The HPLC was equipped with an injection valve with a 20 µL sampler loop. The column used was an Eclipse-PLUS-C18 (25 mm × 0.46 cm, 5 µm; Phenomenex, Bologna, Italy) at a flow rate of 1.0 mL/min. The mobile phase consisted of water and 0.5% of formic acid (A), and acetonitrile and methanol, in equal proportions, with 0.5% of formic acid (B); the gradient evolved from an initial condition of 25% B, to 60% B at 25 minutes, 100% B at 30 minutes; it remained isocratic for 5 minutes and returned to the initial conditions, for a total run duration of 45 minutes. The various peaks were identified by comparing their UV spectra and retention times with those of pure standards. Dedicated JASCO software (ChromNAV ver 2.02.01) was used to calculate peak area by integration.
Standard Solution and Calibration Procedure
Individual stock solutions of caftaric acid, quercetin-3-O-β-rutinoside, quercetin-3-O-β-glucuronide, kaempferol-3-O-β-rutinoside, and kaempferol-3-O-β-glucoside were prepared in methanol. Six different calibration levels were prepared within the following range: 1-50 µg/mL for caftaric acid, quercetin-3-O-β-rutinoside, kaempferol-3-O-β-rutinoside and kaempferol-3-O-β-glucoside, and 10-400 μg/mL for quercetin-3-O-β-glucuronide. Each calibration solution was injected into the HPLC in triplicate. The calibration graphs were provided by the regression analysis of peak area of the analytes versus the related concentrations. The analyses of the phytocomplexes (8 mg/mL) were performed under the same experimental conditions. Three batches of extractions were tested. LOD and LOQ were calculated following the approach based on the standard deviation of the response and the slope as presented in the “Note for guidance on validation of analytical procedures: text and methodology,” European Medicine Agency ICH Topic Q2 (R1) (Table 3). 20
Retention Time (RT), Calibration Range, Correlation Coefficient, Limit of Detection (LOD), and Limit of Quantitation (LOQ) of the Reversed-Phase High-Performance Liquid Chromatography Diode Array Detection Analysis.

Mass Spectrometry
The RP-HPLC-DAD was coupled to a Mass Spectrometer Thermo Finnigan (Ringoes, USA) LCQ ion trap, and the analyses were performed using the following parameters: spray voltage 4.5 kV, sheath gas flow rate 30, auxiliary gas flow rate 5, capillary voltage 10 V, capillary temperature 200°C, in ion negative mode. During the MS/MS experiments, an opportune energy was applied for the simultaneous monitoring of precursor and fragmented ions.
Column Chromatography
Extract 10 (highest TPC) was subjected to separation in a chromatographic column using silica gel (Sigma Aldrich, Milano Italy) to characterize better the main compounds that coeluted in the HPLC analyses. A mixture of ethyl acetate, formic acid, acetic acid, and water was used for the separation (300:11:11:20). The fractions were collected, analyzed by HPTLC, dried, and stored at -20°C until further analyses.
1H NMR Spectroscopy
The 1H NMR spectra were recorded on a Varian Gemini-400 spectrometer at 399.97 MHz at a temperature of 303 K. Extracts (8 mg/mL) were dissolved in D20:CD3OD (1:2) in a 5 mm NMR tube. 1H NMR spectra were run using a standard pulse sequence s2pul, with 45.0 degrees pulse, 3.00 seconds acquisition time, 8 repetitions, 6400 Hz spectral width, and 0.33 Hz Fid resolution.
Spectrophotometric DPPH Assay
The DPPH assay was performed following the method described by Nostro et al. 21 Antioxidant activity was expressed as concentration providing DPPH 50% inhibition (IC50), and as µmol of Trolox equivalents/g of extract (data not shown) in order to complete the statistical analysis with the software Statistica 10.0 (Statsoft Inc., Tulsa, Oklahoma, USA) (Figure 1). All experiments were assessed in triplicate and values are reported as mean ± SD.
Footnotes
Acknowledgments
The authors are thankful for this financial support.
Declaration of Conflicting Interests
The author(s) declared no potential conflicts of interest with respect to the research, authorship, and/or publication of this article.
Funding
The author(s) disclosed receipt of the following financial support for the research, authorship, and/or publication of this article: This work was supported by the Emilia Romagna region within the Rural Development Plan 2014-2020 Op. 16.1.01 – GO EIP-Agri - FA 5C, Pr. “BIOFACE” and coordinated by CRPV.