
Abstract
This is a visual representation of the abstract.
Introduction
In today's society sustainability is becoming a necessity. Our work intends to target the 12th sustainable development goal (SDG 12), sustainable consumption and production of the United Nations (UN) 2030 Agenda for Sustainable Development 2015.
Cornus officinalis is a deciduous shrub in the genus Cornus of the family Cornaceae that is mainly distributed in China, Korea, and Japan. 1 The pericarp of its fruit is used as a raw material in the Chinese medicine industry and its seeds are a by-product (Figure 1C). The annually generated seeds, which have been estimated as high as 6000 tons, 2 have received little attention and have not been utilized effectively. At present, the most frequently used method is using the seeds as a fuel representing its low utilization efficiency. In our previous research HPLC-ESI-MS/MS was employed to investigate the compounds of the seeds for their best utilization. It was found that among the 97 identified compounds, most were tannins, classified as polyphenol. 1 1,2,3,6-tetragalloylglucose (TgG, C34H28O22, CAS 79886-50-3), as one of the identified compounds in the seeds, was determined as high as 25.6 mg/g in the seed extracts of C. officinalis, indicating the seeds as a good source of TgG. Therefore, a process was developed in this study to efficiently extract and separate TgG from the seeds of C. officinalis.

Structure (A) and purified product (B) of TgG and the seeds of Cornus officinalis Sieb. et Zucc.(C).
TgG is a polyol ester, which is classified as gallotannins, hydrolyzable tannin. It is structurally characterized by a β-D-glucose esterified with four gallic acids at the 1,2,3,6 hydroxyl groups (Figure 1). The available literature reports that TgG demonstrates several biological activities such as anti-tumor, anti-complement, anti-allergic, anti-oxidative, anti-coagulant activities, and apoptosis-inducing, src homology phosphatase 2 (SHP2) inhibition, vasorelaxant effects.3–10 However, only a few studies have reported the preparation method of TgG, which largely limited its applications.11–13 Therefore, a promising source of TgG and its effective preparation methods are warranted to unlock its potential in the pharmaceutical and food industries.
TgG, as a phenolic compound, is easily degraded in the presence of high temperature for long durations used in the conventional heat-related extraction methods, such as refluxing extraction, because of internal redox reactions, hydrolysis, and polymerizations. 14 Ultrasound-assisted extraction (UAE) can greatly reduce the extraction temperature and the contacting time, therefore avoiding degradation. In addition, ultrasound can increase the mass transfer rates by acoustic cavitation; thus, enhancing the extraction efficiency. 15 Ultrasound has been applied widely to numerous industry fields, such as processing, preservation and extraction. 14 Moreover, ultrasound, as a clean, green extraction technology, can enhance the extraction yield, reduce solvent consumption, consume less energy and produce products without contaminants. 16 Therefore, in this study UAE was used and optimized by response surface methodology (RSM).
Polyphenols have been reported to contribute to the majority of the constituents identified in the extract. 1 Polyphenols of ellagitannins and gallotannins have been structurally characterized as the derivatives of the ester of glucose and gallic acid. The presence of plenty of hydroxyl groups in the structures indicates the water-soluble feature of the seed extract, which has been proved in the previous research. Therefore water was selected as the extracting solvent. And water is a clean solvent that adapted well to the “green extraction” concept, and provide an environmental safe extraction methods. Also water has the advantage of low cost and non-toxicity.
Therefore, in this study the extraction of the by-product seeds of C. officinalis by a clean and green extracting solvent of water and extraction technology of UAE are in line with the concept of sustainable development and production (Figure 2).

Schematic presentation of the TgG preparation method from the seeds of Cornus officinalis Sieb. et Zucc.
Materials and Methods
Materials and Chemicals
Mature fruits of C. officinalis were collected in October 2021 from the Muzhi region in Luoyang, Henan, China. Prof. Ximing Lu from the Medical College at Henan University of Science and Technology, Luoyang, China, confirmed the identity of the samples. Following fruit separation, the seeds were air-dried at room temperature and subsequently stored at 4 °C prior to analysis. Voucher specimens were maintained in the college herbarium, bearing certificate no. 21-7(7).
1,2,3,6-tetragalloylglucose (with purity exceeding 98%) was procured from Yuanyie Biotech Co. Ltd located in Shanghai, China. Macroporous adsorption resins, especially D101, NKA, NKA-2,and NKA-9 were sourced from Tianjin Guangfu Fine Chemical Research Institute. The column chromatography reverse silica gel (ODS-AAG12S50) was acquired from YMC Co. Ltd based in Kyoto, Japan. Methanol and ethanol was obtained from Tianjin Chemical Reagent Supply and Marketing Company in Tianjin, China. Distilled and deionized water was utilized.
HPLC Determination of TgG
HPLC quantification was conducted using a Shimadzu Prominence LC-20A System (Shimadzu, Kyoto, Japan), which included a degasser (DGU-20A5), diode array detection system (SPD-M20A, Shimadzu), and a binary gradient pump (LC-20AB). The equipment was managed and data was acquired and processed using Labsolutions software (version 5.97, Shimadzu) to handle chromatographs. Analysis utilized a reversed-phase C18 Wondasil column (4.6 × 250 mm, 5 μm, GL Sciences, Tokyo, Japan) in conjunction with a corresponding guard column from Phenomenex, located in Torrance, CA, USA. The mobile phase consisted of MeOH:H2O:H3PO4 (30:70:0.03). Experimental parameters were as follows: a flow rate of 1.0 mL/min, a UV detector wavelength of 280 nm, a column temperature of 30 °C, and a sample injection volume of 10 μL.
Optimization of UAE
Single-factor Experiments for UAE
The influence of significant variables and their corresponding ranges on process effectiveness in UAE was assessed through a sequence of single-factor experiments. In summary, 5.0 g of crushed seeds were combined with a specific volume of deionized water within a 250 mL Erlenmeyer flask. This mixture was introduced into an ultrasonic cleaning machine (KQ-100DE, single -frequency sonication mode with the frequency of 40 kHz, Kunshan Ultrasound Co., Ltd, Jiangsu, China) for extraction under various experimental conditions: sonication time ((ranging from 10 to 60 min), sonication temperature (set between 25 and 60 °C), liquid-to-solid ratio (LSR) (ranging from 1:10 to 1:40) and sonication power (adjusted between 20 and 100 W), all aimed at refining the extraction procedure. The impact of each parameter was thoroughly explored. Subsequently, the extracts underwent filtration using a 0.45 μm micropore filter to prepare them for HPLC analysis.
Optimization of UAE by RSM
Building upon the single-factor experiments in UAE, a RSM analysis was undertaken by using Box–Behnken design (BBD). The four chosen factors, as indicated in Table 1, were labeled as X1 (sonication time in min), X2 (sonication temperature, °C), X3 (liquid-to-solid ratio in mL/g), and X4 (sonication power in W). These factors were established across three levels, represented as −1, 0, and 1. The extraction yield of TgG was adopted as the response variable for the designed experiments. The following second-order polynomial model shown in Equation (1) was used to predicate the optimized extraction condition:

Independent Variables and their Levels Used for Box−Behnken Design.

Comparison of the Extraction Efficiencies with Other Extraction Methods
Other extraction methods were applied. Briefly, 5.0 g of smashed seeds were placed in a round-bottom flask refluxing with water or 95% ethanol under the same optimized values of extraction time and LSD from UAE by RSM to effectively compare the TgG extracting yield. Finally, the extract was filtered and the TgG was analyzed in the filtrate by HPLC.
Resin Enrichment
Resin Selection
The resin was selected by the static adsorption and desorption experiments. Before experiments, the conditioned resins were stored in the distilled water. 17 The surface moisture of the resins was removed by pressing gently between the folds of filter paper. This had been termed as filter paper dried (FPD) resins. The four resins of D101, NKA, NKA-2, and NKA 9 with different polarities were used and are summarized in Table 2. The four 0.5 g FPD resins were put into different 100 mL Erlenmeyer flasks. Next, 30 mL of the seed extracting solution was added to the flask with a TgG concentration of 0.7 mg/mL. Next, the flasks were shaken at 25 °C for 12 h (100 rpm) in a shaking water bath (ZHSY-50, Zhichu Instrument Co. Ltd, Shanghai, China). After adsorption, resins were filtered and washed with 50 mL of distilled water to remove the residual solution after equilibrium. To perform desorption, 30 mL of 50% ethanol was added to the flasks as the desorption solution, following which the flasks were therefore shaken at 25 °C for 12 h (100 rpm) in a shaking water bath. The TgG contents in the adsorption and desorption solution were analyzed by HPLC.
Resins Physical Characteristics.

DVB is the abbreviation of divinylbenzene.
The selection of the resin was determined by assessing its adsorption and desorption capacities (measured through Equations 2 and 3) as well as the desorption ratio (calculated using Equation 4).
Adsorption evaluation
Desorption evaluation

Adsorption Kinetics
The adsorption kinetics was performed using the selected resins. Briefly, 0.5 g of FPD resin was place in an Erlenmeyer flask with 30 mL of the seed-extracting solution and a TgG concentration of 0.7 mg/mL. Afterword, the flask was shaken at 25 °C for 12 h (100 rpm) in a shaking water bath. Aliquots (1.0 mL) of sample solution were collected at time intervals of 0.5, 1, 2, 3, 4, and 8 h, until the equilibrium was reached, and the TgG in the samples was analyzed by HPLC and calculated by Equation 5. Two model Equations 6 and 7 were applied to evaluate the adsorption of TgG on the selected resins with time. The Equations 6 and 7 represent the pseudo-first-order model and the pseudo-second-order kinetic model respectively.


Adsorption Isotherms
The tests for adsorption isotherms on D101 resin were conducted at room temperature (25 °C) and 30 and 35 °C. Briefly, 30 mL of the seed-extracted solution of different TgG concentrations with 0.5 g of FPD resin was placed in different Erlenmeyer flasks. Next, the samples were shaken for 4 h (100 rpm) in a shaking water bath at selected temperatures. The TgG concentration at equilibrium was analyzed by HPLC. The TgG adsorption capacity on D101 resin versus the equilibrium TgG concentration was used to plot the TgG adsorption isotherms. The relationship between TgG and D101 resin was evaluated by the Langmuir (Equation 8) and Freundlich theoretical (Equation 9) models.
Langmuir model

The essential characteristics of the Langmuir isotherm can be expressed as of RL, a dimensionless constant called the separation factor or equilibrium parameter. RL can be calculated from Equation 10 as follows:
Dynamic Adsorption and Desorption Tests
The chosen D101 resin was meticulously packed into a glass column measuring 10 mm in diameter and 300 mm in length, in order to execute dynamic adsorption and desorption experiments. The resin bed's packed section was 100 mm in length. For adsorption, the seed-extracting solution containing a TgG concentration of 0.5 mg/mL was introduced. Four distinct sample flow rates, namely 2BV/h, 4BV/h, 7BV/h, and 10BV/h, were utilized. The ensuring breakthrough curves depicted the TgG concentration within the outlet solution in relation to the volume of the inlet feed solution.
Desorption activities involved a 3BV application of distilled water to eliminate the impurities, after which an ethanol solution was employed to extract the TgG from the D101 resin. Optimization of ethanol concentration (10%, 30%, and 50%) and desorption flow rates (2BV/h, 4BV/h, 7BV/h, and 10BV/h) was achieved through the dynamic desorption curves. These curves were constructed based on TgG concentration within the desorption solvent as a function of the volume of desorption solvent employed.
Reverse Phase Silica gel Purification
The desorption solution containing 50% ethanol was subjected to concentration under reduced pressure, followed by lyophilization. The resulting yield was subsequently separated on a glass column measuring 30 mm in diameter and 40 cm in length, which was packed with reverse silica gel.
In essence, the acquired crude TgG was dissolved anew in a 20% aqueous methanol solution. This solution was then introduced into a chromatography system, comprising a BT1-100 peristaltic pump (Qite Analytical Instrument Co. Ltd, Shanghai, China), a HD-21-88 detector (Qite Analytical Instrument Co. Ltd), a BS-100A-LCD automatic sample collector (Qite Analytical Instrument Co. Ltd), and a N2000 chromatographic workstation (Surwit Technology Inc., Hangzhou, China). The detection wavelength was set at 280 nm, aligning with the TgG UV absorbance peak. To attain optimal TgG separation, the mobile phase (consisting of methanol-water ratios of 30:70, 25:75, and 20:80 [v:v]) was fine-tuned. Confirmation of the TgG-containing eluent was achieved through comparing its retention time with the TgG reference solution via HPLC. The fraction enriched with TgG was collected, concentrated, and subsequently subjected to lyophilization.
NMR
Nuclear magnetic resonance (NMR) spectra were recorded on a Bruker AV-400 spectrometer (Bruker, Zug, Switzerland, using a CD3OD as solvent. Tetramethylsilane (TMS) was used as an internal standard. Chemical shifts (δ) are in ppm and the coupling constants (J) are in Hz.
Statistical Analysis
The experimental data were collected in triplicate. The experimental design and data were analyzed using the Design-Expert 8.0.6.1 (Stat-Ease Inc., Minneapolis, MN, USA). Analysis of variance (ANOVA) was used to identify the adequacy of the developed model and the statistical significance of regression coefficients.
Results
Optimization of UAE
Single-factor Analysis
Sonication time is a factor that affects the extraction efficiency of TgG from the seeds of C. officinalis. Solvent extraction involves the penetration of the extraction solvent into the powdered material, and the dissolution of TgG, and its subsequent diffusion out from the C. officinalis.
18
Thus, the appropriate duration of the extraction process greatly facilitates the extraction TgG . The effect of sonication time (10-60 min) on the yield of TgG was studied under a solvent–solid ratio of 20 mL/g, temperature of 40

Effects of different extraction parameters on the extraction yield of TgG from the seeds of C. officinalis (A: sonication time, min; B: sonication temperature, °C; C: ratio of water to raw material, mL/g; D: sonication power, W).
Sonication temperature is another vital factor that influences the yield of TgG, because of the higher amount of TgG transferred from the seeds of C. officinalis to the extraction solvent and the higher solubility of TgG under a higher extraction temperature. The effect of sonication temperature (25-60 °C) on the yield of TgG was studied under the fixed extraction conditions of the solvent–solid ratio of 20 mL/g, sonication time of 40 min, and sonication power of 60 W. As shown in Figure 3B, the amount of extracted TgG reached the highest value of 7.25 mg/g at a sonication temperature of 40 °C, followed by a decreased to 5.53 mg/g at 60 °C. The diffusion and solubility of TgG in the solvent increased with an elevation in the extraction temperature; however a higher temperature could stimulate TgG degradation because of internal redox reactions, hydrolysis, and polymerizations. 14 Therefore, sonication temperatures of 30 °C, 40 °C, and 50 °C were selected to conduct further RSM experiments.
Liquid-to-solid ratio (LSR) significantly influences the extraction yield of TgG. The effect of LSR (10:1-40:1) on the yield of TgG was studied under the fixed extraction conditions of a sonication temperature of 40 °C, sonication time of 40 min, and sonication power of 60 W. As shown in Figure 3C, the amount of extracted TgG increased from 5.05 mg/g at 10:1 LSR to 7.11 mg/g at 20:1 LSR. A higher LSR led to a lager TgG concentration difference between the extraction solvent and the seeds of C. officinalis, consequently promoting TgG mass transfer and accelerating TgG diffusion from the seeds of C. officinalis to the extraction solvent. However, no change was recorded in the amount of extracted TgG with a continuous increase in the LSR. Thus, a higher volume of solvent would absorb or scatter the ultrasonic energy to a certain extent, thereby inhibiting the increase in the amount of extracted TgG. 20 In all, LSR values of 10:1, 20:1, and 30:1 were selected to conduct the further RSM experiments.
Ultrasonic power plays a vital role in the extraction process; it works by causing extensive cavitations and generating violent shock waves and high-speed jets.
21
These effects have been reported to enhance the penetration of the extraction solvent molecules into the inner areas of the seeds of C. officinalis and improve the release of TgG into the solvent.
22
The effect of ultrasonic power (20-100 W) on the yield of TgG was studied under the fixed extraction conditions of a solvent–solid ratio of 20 mL/g, temperature of 40 °C
Mode-fitting Analysis
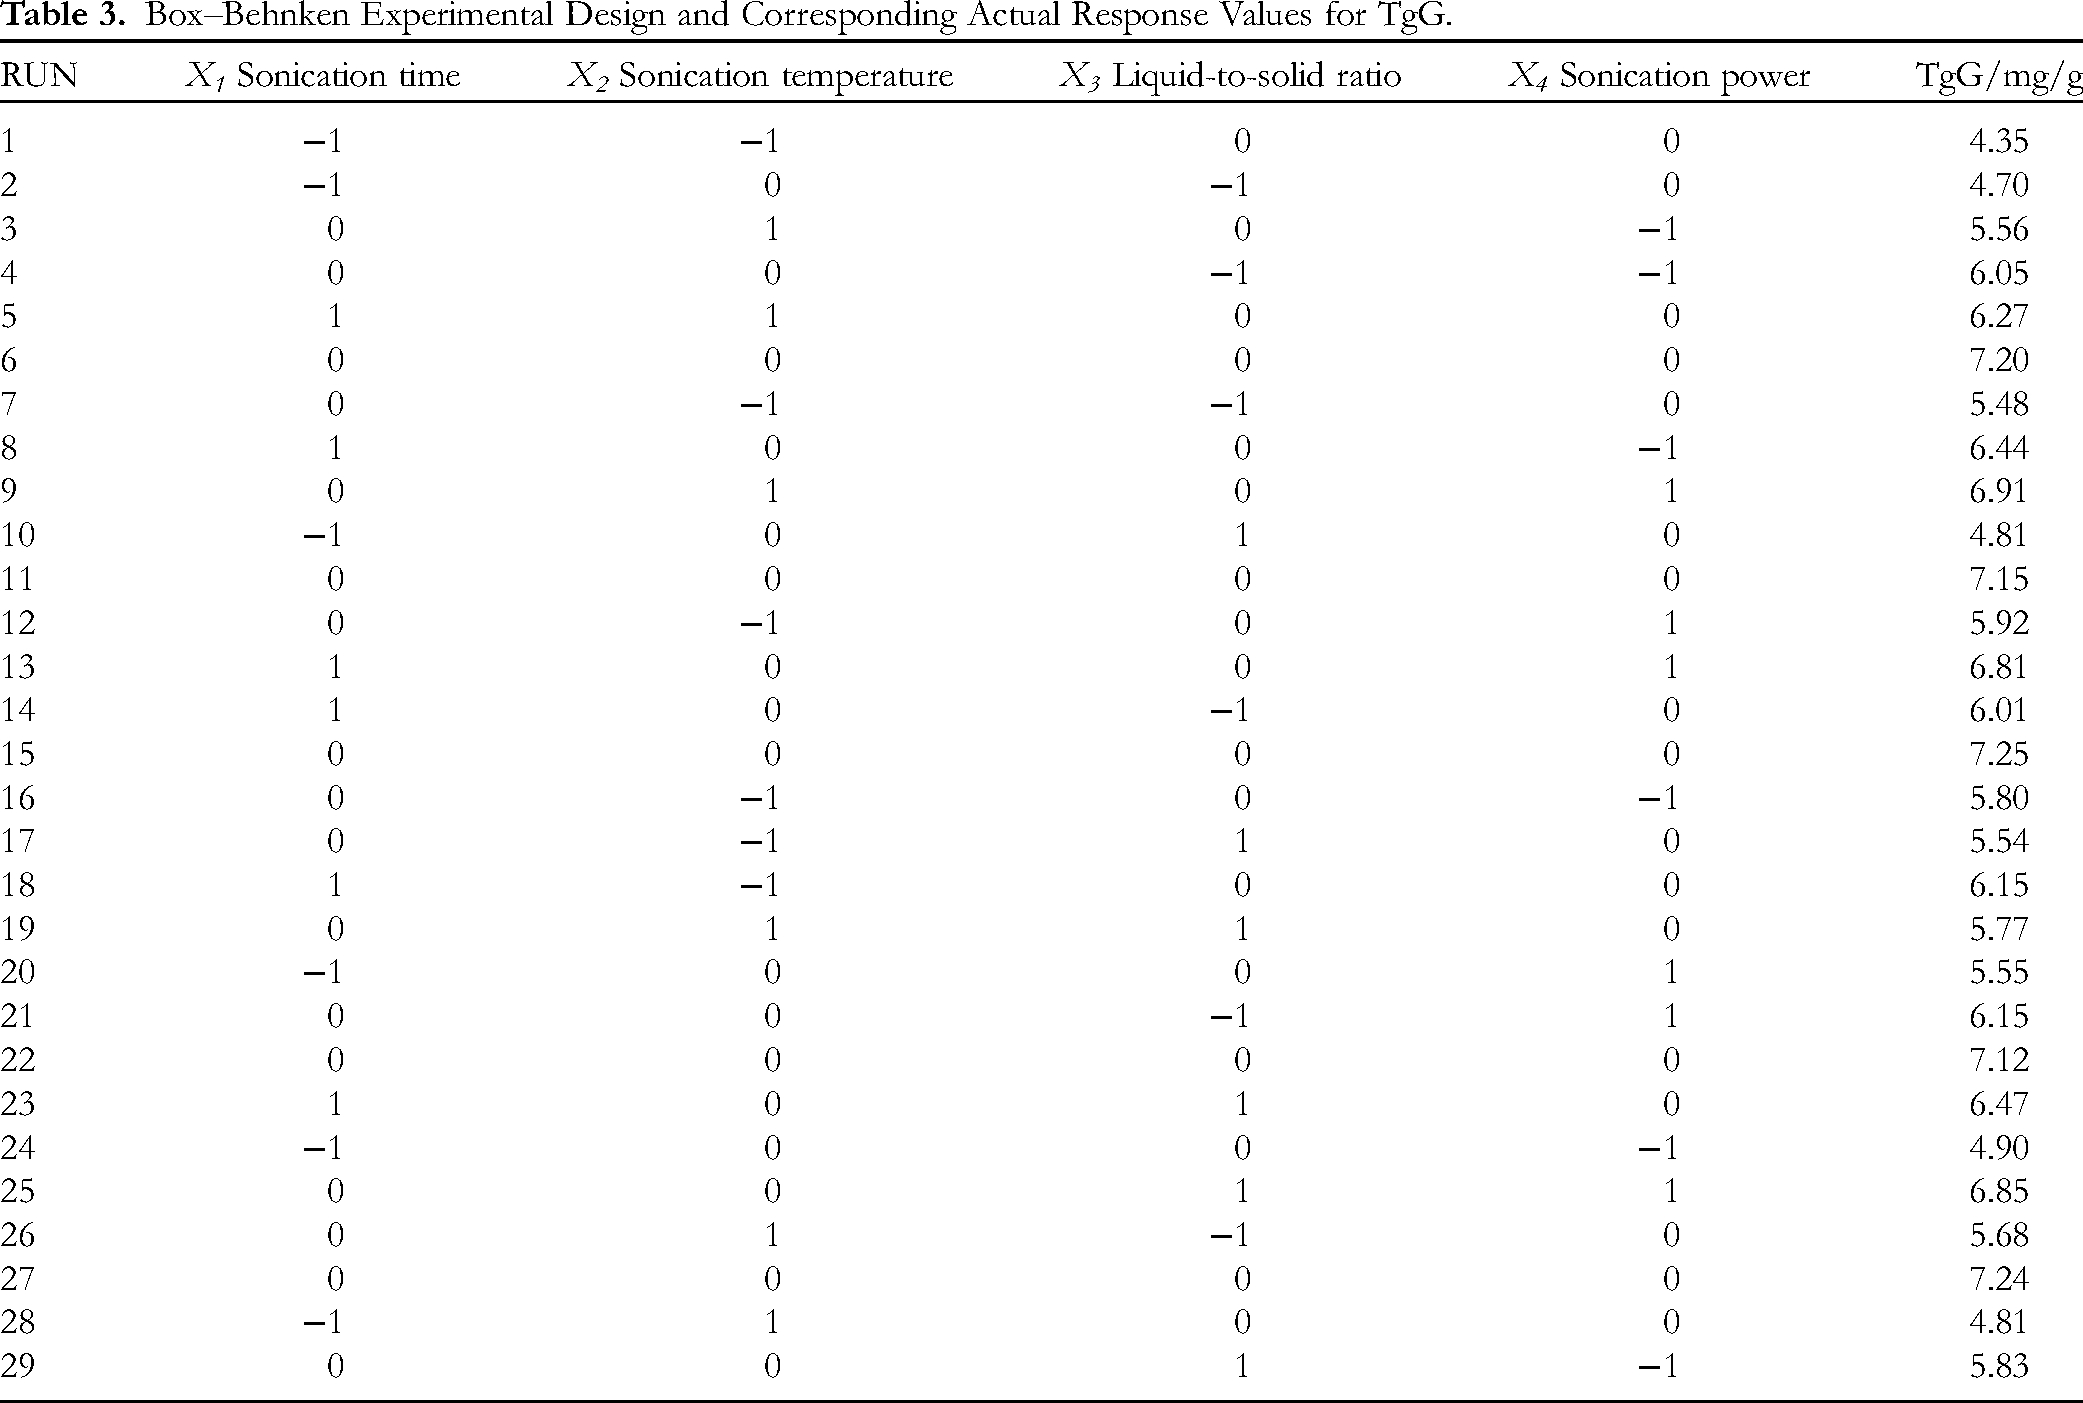
The BBD experiment design and the amount of extracted TgG obtained through UAE are depicted in Table 3. The ANOVA results of the polynomial model are presented in Table 4. The fitting quadratic polynomial model of the amount of extracted TgG (Y) and sonication time(X1), sonication temperature (X2), LSR (X3), and ultrasonic power (X4) was obtained using Equation 11: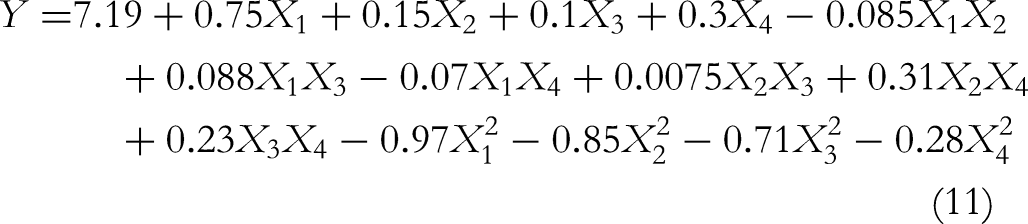
Box–Behnken Experimental Design and Corresponding Actual Response Values for TgG.
Analysis of Variance (ANOVA) for the Response Surface Model.
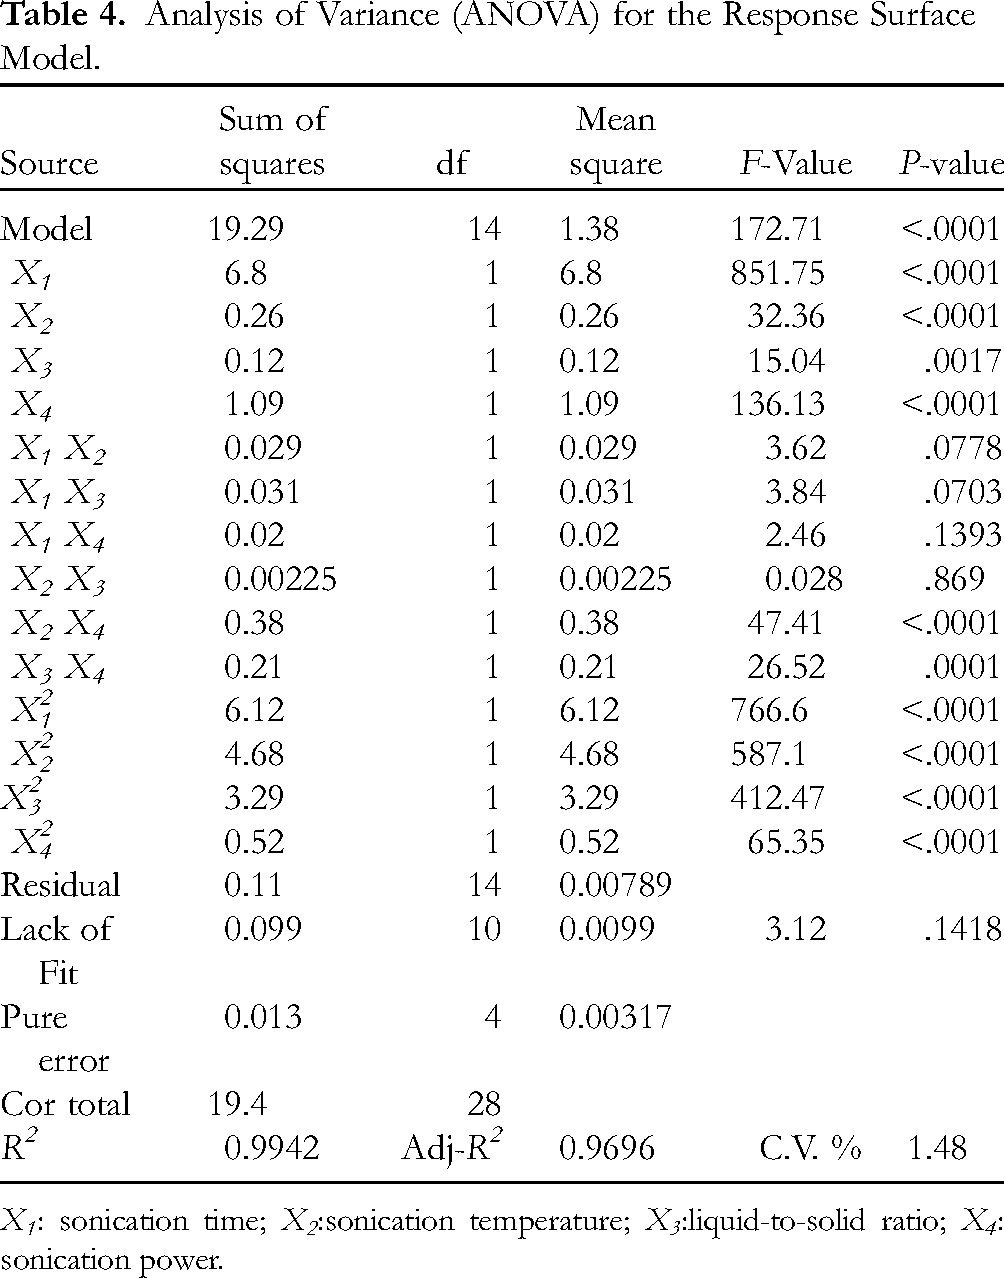
X1: sonication time; X2:sonication temperature; X3:liquid-to-solid ratio; X4: sonication power.
The determination coefficient (R2) was calculated to be 0.9942 using the quadratic regression model, indicating that 99.42% of the variations could be illustrated by the fitted model. For a good statistical model, adj-R2 should be close to R2. As shown in Table 4, adj-R2 was 0.9885, implying that only 1.15% of the total variations were not explained by the model, revealing a high degree of correlation between the observed and predicted values. A coefficient of variation (CV) value of 1.48% showed that the accuracy and the general availability of the polynomial model were adequate. According to Table 4, a high model F value of 172.71 and a low model P value (<.0001) imply the significance of the regression model 23 and indicated that a prediction model has a good fitting degree. An F-value of 3.12 and P value of .1418 implied that a lack-of-fit model was not significant.
Among these factors, independent variables (X1, X2, X3, and X4) and quadratic terms (X12, X22, X32 and X42) highly impacted the amount of extracted TgG (P < .05). A significant interaction was observed between sonication temperature and sonication power (X2X4), and LSR and sonication power (X3 X4) (P < .05). Moreover, the order of four factors affecting the amount of extracted TgG was found to be X1 > X4 > X2 > X3 according to the F value. The ANOVA results confirmed that this model can be used to navigate the design space of UAE for TgG from C. officinalis seeds.
Response Surface Optimization of Ultrasonic Extraction
The three-dimensional (3D) response surface graphs and two-dimensional (2D) contour plot were used to investigate the interactive effects of the extraction parameters on the amount of TgG from extracted the seeds of C. officinalis. When two variables within the experimental range were depicted in the plots, the other parameters were kept constant at zero level. Figure 4 shows the interaction between all the combined parameters on the amount of extracted TgG. Figure 4(A-B) depicts the interaction effects of sonication time and sonication temperature on the amount of extracted TgG. Sonication temperature exerted quadratic effects on the amount of extracted TgG. At short extraction time, the amount of extracted TgG first increased, followed by a decrease with an increase in the sonication temperature. Figure 4(C-D) shows the LSR and sonication time exerted quadratic effects on the yield of TgG when the other two variables were fixed at level zero. Similarly, Figure 4(E-F) indicates that both sonication power and sonication time strongly influenced the amount of extracted TgG. The application of a higher sonication power resulted in more sonication time and elevated TgG extraction yield. Figure 4(G-H) depicts the 3D response surface plots and contour plots at varying LSR values and ultrasonic temperatures at fixed sonication time and sonication power. From the two figures and Table 4, it can be concluded that the interaction between LSR and ultrasonic temperature was insignificant. Figure 4(I-J) displays the interaction effects of sonication temperature and sonication power on the amount of extracted TgG. At a lower sonication power, the amount of extracted TgG increased at first, followed by a decrease with an increase in the sonication power. However, the amount of extracted TgG increased with a surge in the sonication power at a fixed sonication temperature range. In addition, the ANOVA results indicated significant interactions between sonication temperature and sonication power (P < .05) and positive interaction for the amount of extracted TgG. Similarly, Figure 4(K-L) shows that sonication power and LSR demonstrated quadratic effects on the amount of extracted TgG. The mutual interaction between these two extracting parameters was significant, as evidenced by the elliptical contour plot (Figure 4L), and the ANOVA results shown in Table 4.

Two-dimensional (2D) contours and three-dimensional (3D) response surface plots show the effects of different parameters on the TgG, respectively. (A-B) Sonication time and sonication temperature, (C-D) liquid-to-solid ratio and sonication time, (E-F) sonication power and sonication time, (G-H) liquid-to-solid ratio and ultrasonic temperature (I-J), sonication temperature and sonication power, and (K-L) sonication power and liquid-to-solid ratio.
The RSM experiments results demonstrated the following optimum extraction conditions: sonication time of 43.637 min, sonication temperature of 41.903 °C, LSR of 22.017, and sonication power of 73.434 W. The maximum predicted value of the TgG was 7.454 mg/g.
Model Validation
To facilitate the validation experiment operation, the actual optimum extraction conditions were adjusted as a sonication time of 44 min, sonication temperature of 42 °C, LSR of 22:1, and sonication power of 70 W. The maximum TgG obtained in the verification experiment was 7.38 ± 0.55 mg/g (n = 3), which was close to the predicted value of 7.454 mg/g. Therefore, the RSM model was found to be highly precise.
Comparison with Other Extraction Methods
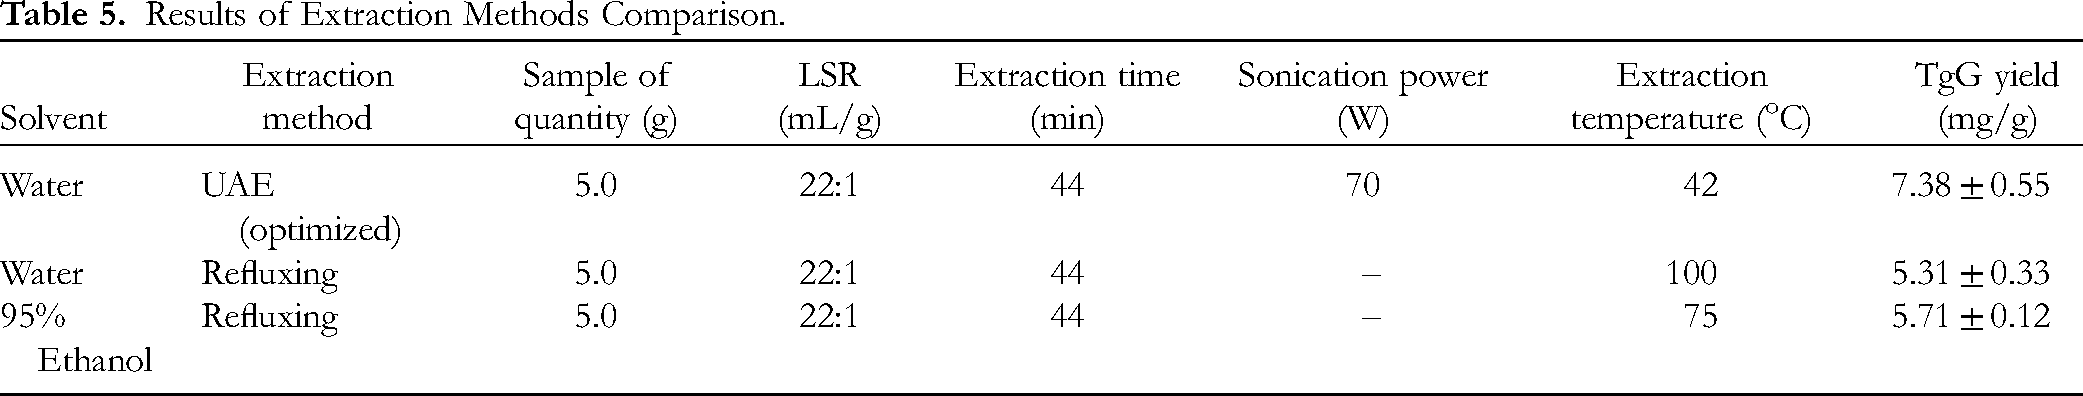
UAE is suitable to extract unstable compounds because of the high mass transfer and low extracting temperature used. In addition, it can effectively prevent the degradation of compounds. As indicated in Table 5, the optimized UAE extraction method resulted in a TgG yield of 7.38 mg/g, which was the highest among the three testing extraction methods. The TgG yield obtained by UAE was superior to that obtained from the other two refluxing extraction methods. The extraction temperature of water and 95% ethanol refluxing method used boiling points of 100 °C and 75 °C, respectively, both of which were higher than 42 °C (used in UAE). A higher extracting temperature, results in a lower TgG yield. The higher extracting temperature contributed to the polyphenol degradation via internal redox reactions, hydrolysis, and polymerizations. Therefore, UAE is the best choice for extracting TgG from the seeds of C. officinalis.
Results of Extraction Methods Comparison.
Resin Enrichment of TgG
Resin Selection
The selection of appropriate resins is guided by their adsorption and desorption capacities, which are primarily influenced by the chemical attributes and physical characteristics of the resins. 24 The chemical nature, polarity, surface area, pore diameter, and particle diameter of the four resins are documented in Table 2. As depicted in Figure 5, the D101 resin demonstrated the most favorable adsorption performance, exhibiting an adsorption capacity of 31.89 ± 3.0 mg/mL. This capacity was slightly superior to that of the NKA resin, which recorded a value of 27.20 ± 2.2 mg/mL. Additionally, it was considerably higher than the capacities of NKA-2 and NKA-9 measuring 12.24 ± 1.0 and 9.64 ± 1.2 mg/mL, respectively. The desorption capacity of the D101 resin was established at 30.66 ± 1.5 mg/mL, surpassing the capacities of the other three resins.
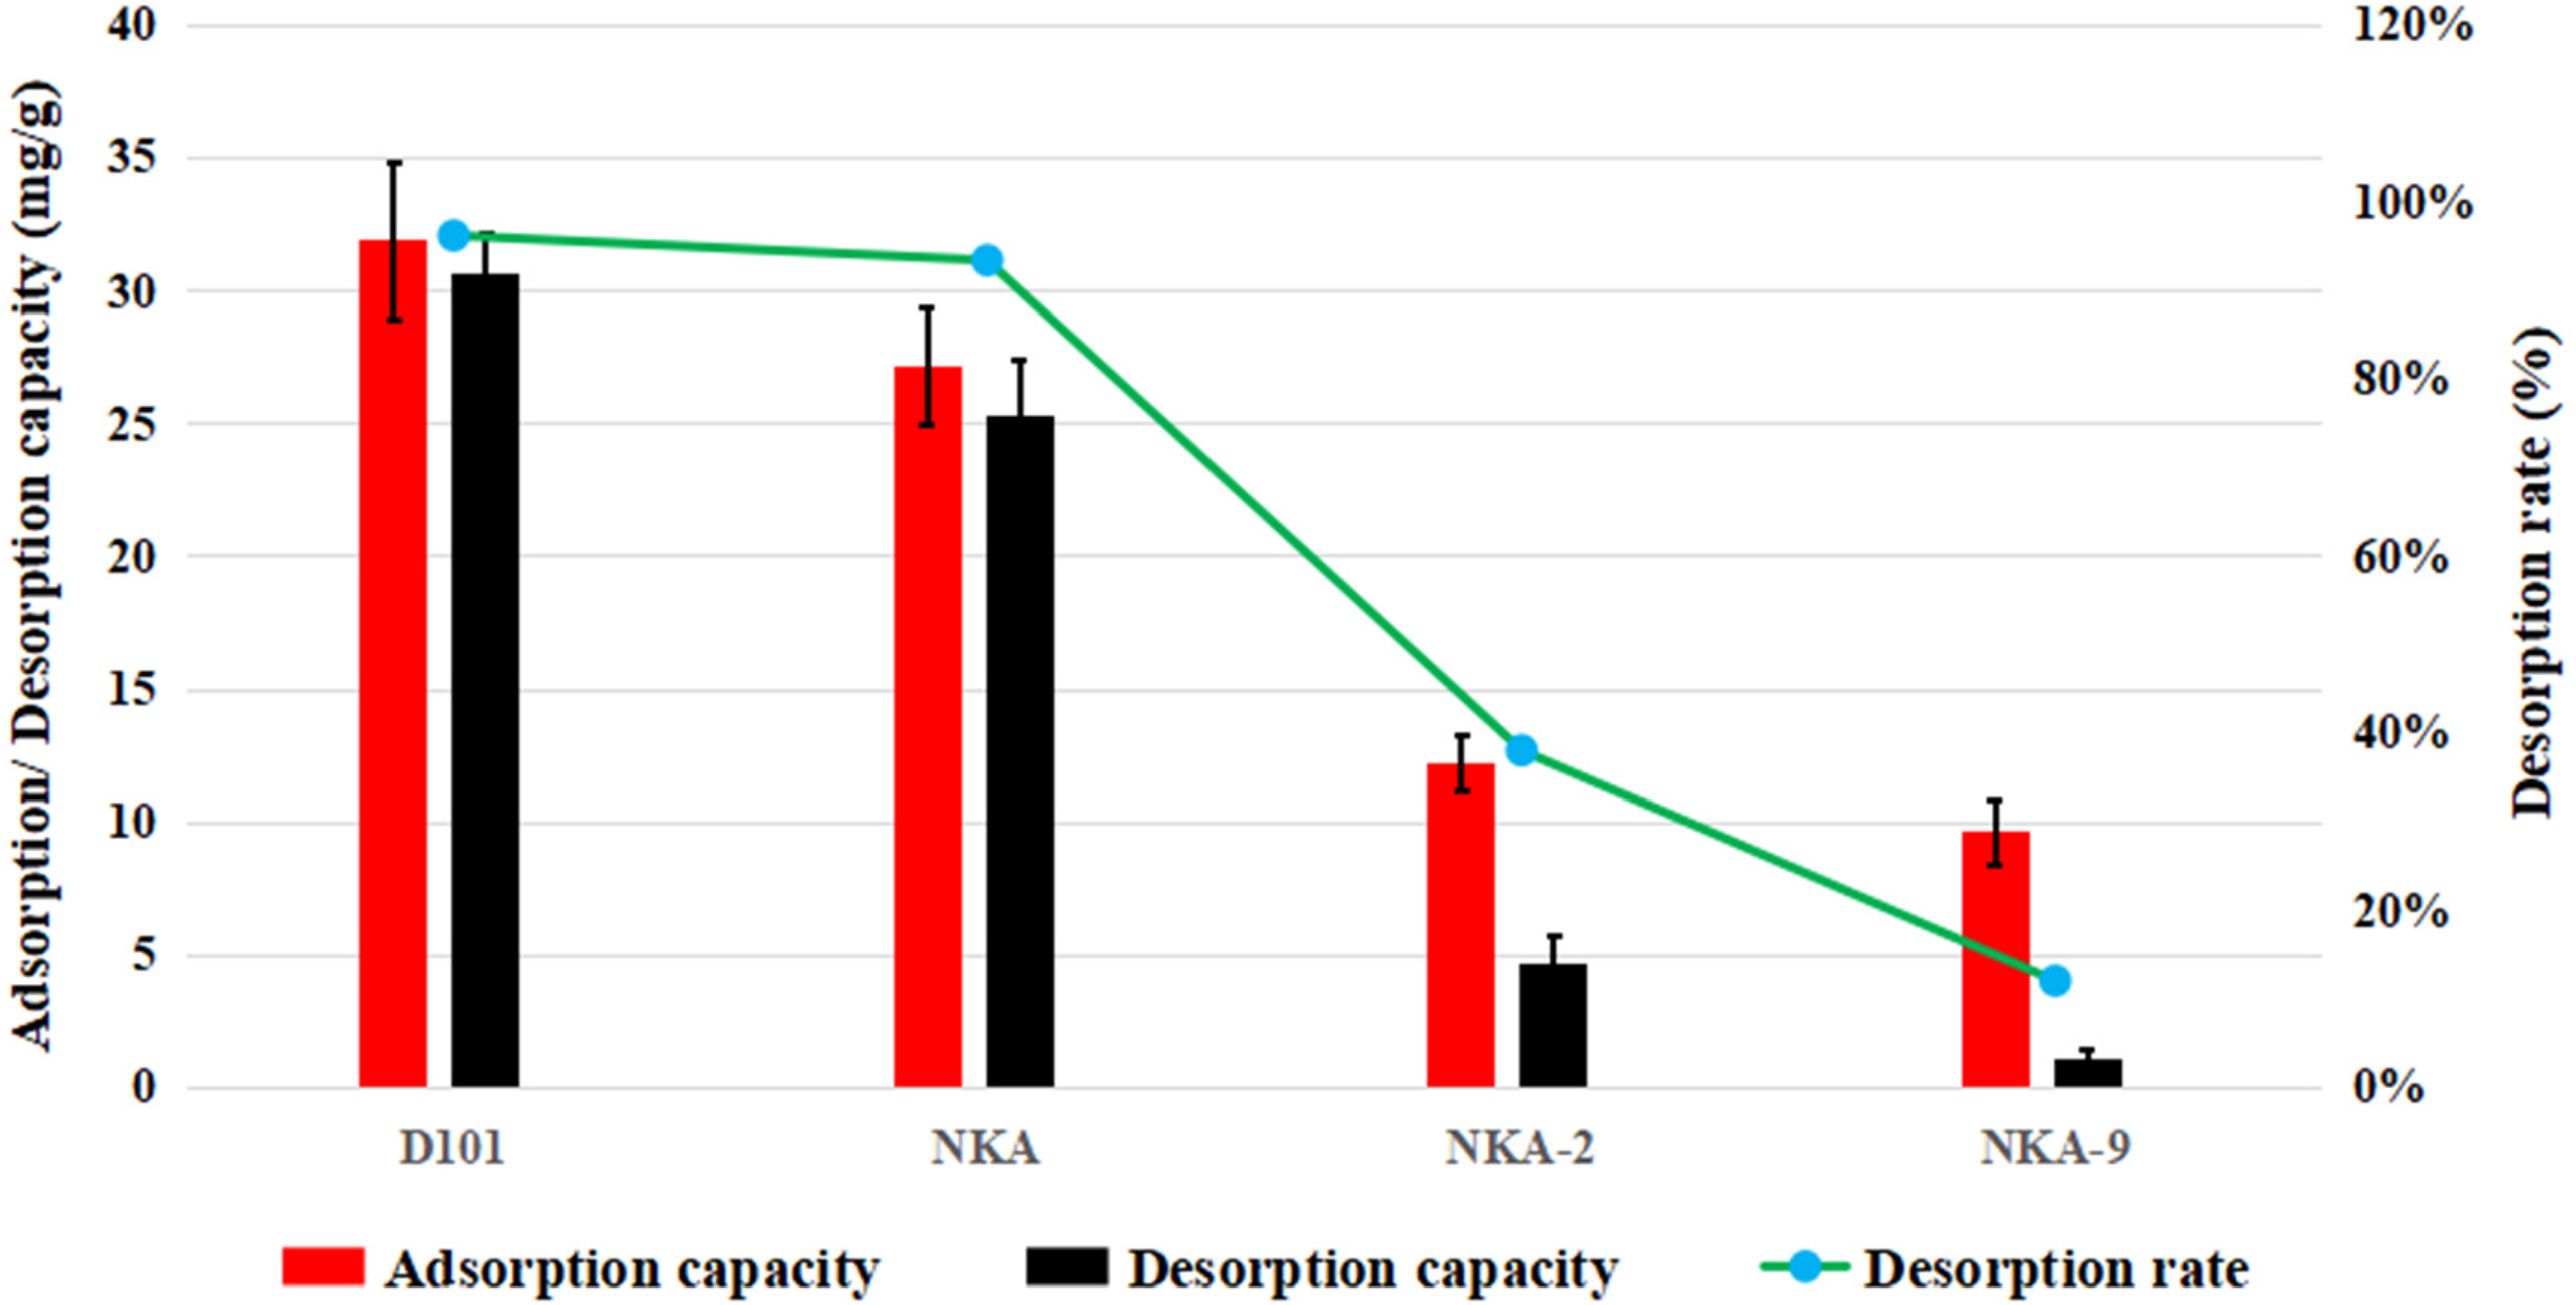
Adsorption and desorption capacity, and desorption ratio of TgG on the four resins.
Regarding the desorption ratio of TgG for these four resins, the order of magnitude was observed as follows: D101 > NKA > NKA-2 > NKA-9. A notable difference emerged in the adsorption capacity between non-polar resins like D101 and NKA, and polar resins such as NKA-2 and NKA-9. Non-polar resins can absorb more TgG than polar resins from the seed extraction water solution. TgG has both polar hydroxy groups and non-polar phenyl groups. In an aqueous solution, the affinity generated between the non-polar resin and the non-polar structural component of TgG is considerably stronger than that generated between the polar resin and a polar structural component of TgG. 25 Moreover the resin surface area should not be neglected to explain the better absorption performance of non-polar resins. 26 Both the non-polar resins, that is, D101 and NKA have almost two to three times larger surface area than the polar resins of NKA-2 and NKA-9. Therefore, a non-polar resin with a larger surface area results in better adsorption of TgG from the seed extraction water solution. The desorption capacity of polar resins, such as NKA-2 and NKA-9, was inferior to that of non- polar resins, which could be due to strong interactions between polar hydroxy groups of TgG and the adsorbent material. 27 Thus, the non-polar resin of D101 with the largest surface area was selected for further testing.
Adsorption Kinetics
The adsorption kinetics of TgG on the D101 resin are shown in Figure 6. The amount of TgG adsorbed in the seed-extracted water solution on the D101 resin rapidly increased in the first 60 min, followed by a slow increase until adsorption equilibrium was achieved at 2 h. Therefore, the optimal adsorption time for TgG on D101 resin was determined as 2 h. The pseudo-first-order and pseudo-second-order models are the widely used kinetic models for assessing the behavior and mechanism of the adsorption process. 28 The pseudo-first-order model is primarily employed to depict adsorption behavior in the initial stages, whereas the pseudo-second-order model predicts adsorption behavior in which the chemisorption serves as the rate-limiting step and characterizes complete adsorption process. 29 Experimental data pertaining to TgG on the D101 resin at 25 °C were subjected to fitting these two models. The correlation coefficients and dynamic parameters are outlined in Table 6. A higher correlation coefficient value indicates that the pseudo-first-order model aligns more favorably with the adsorption of TgG on the D101 resin from the seed water extraction solution. 30

Adsorption kinetics of TgG on D101 resins at 25 °C.
Kinetic Parameters of TgG Adsorption on D101 Resin a .

Adsorption is at room temperature (25 °C). exp, experimental; calc, calculated. Data are based on three replicates except as noted.
Adsorption Isotherms
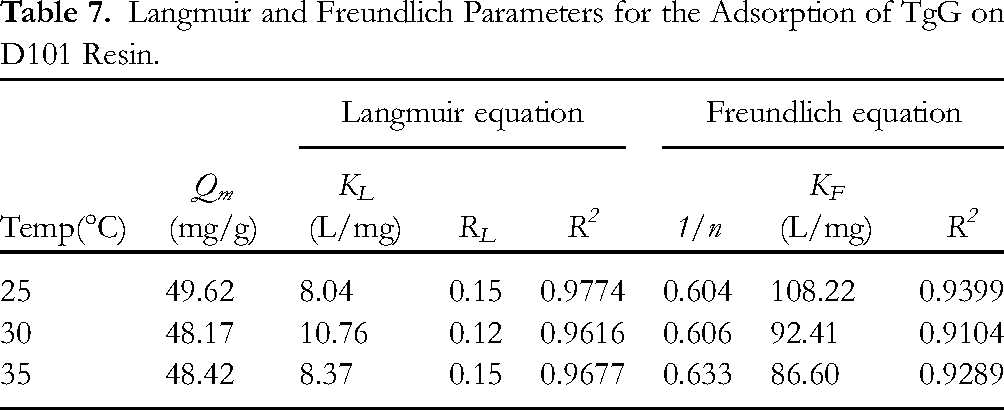
The equilibrium adsorption isotherms of TgG on the D101 resin were obtained at 25 °C, 30 °C, and 35 °C, as shown in Figure 7. The Langmuir and Freundlich equations are widely used to explain the adsorption mechanism between an adsorbate and an adsorbent. 31 The former is used to describe the monolayer adsorption processes with energetically identical sorption sites, whereas the latter is applied to describe the multi-molecular layer adsorption processes and heterogeneous adsorption. 32 Higher correlation coefficients, as shown in Table 7, indicated the suitability of the Langmuir model over the Freundlich equation to describe the adsorption equilibrium of TgG on D101 resin. 33 The adsorption of TgG on the D101 resin was favorable, which is proved by the value of RL (0.15 at 25 °C, 0.12 at 30 °C, and 0.15 at 40 °C). 34 The value of the Langmuir constant (RL) value indicates the shape of the isotherm to be unfavorable (RL > 1), linear (RL = 1), favorable (0 < RL < 1), or irreversible (RL = 0). 35

Adsorption isotherms of TgG on D101 resin at 25 °C, 30 °C, and 35 °C.
Langmuir and Freundlich Parameters for the Adsorption of TgG on D101 Resin.
Dynamic Breakthrough Curve on D101 Resin
During dynamic adsorption, the resin quantity, sample feeding volume, and sample feeding flow rate constitute the important parameters that can be determined by the dynamic breakthrough curve. 36 A breakthrough curve is used to describe the degree of saturation of the adsorbate on the resin. 37 When the active sites on the resin are totally occupied by the adsorbate, the resin is unstable to hold the adsorbate further and the adsorbate can be detected in the effluent liquid. The breakthrough point is defined as the point where the adsorbate concentration in the exit matches 10% of the concentration in the feeding sample solution. 38 Four distinct feeding flow rates of 2, 4, 7, and 10 bed volume (BV)/h were investigated to ascertain their respective breakthrough points while maintaining the TgG concentration in the feeding sample solution at 0.5 mg/mL. The outcomes are presented in Figure 8. Notably, for feeding flow rates of 2BV/h and 4BV/h, the breakthrough points were both identified as the ninth bed volume. The value was higher than the breakthrough points of 7 BV/h and 10 BV/h, which occurred at seventh and fifth BV, respectively.

Dynamic breakthrough curve of TgG on D101 resin.
A lower feeding flow rate provides more time for the adsorbate to interact with the active sites on the resin. Consequently, intermolecular forces like hydrogen bonding, simple stacking, or hydrophobic interactions are more easier formed. 39 These interactions facilitate adsorption onto the resin. Our findings indicated that a feeding flow rate of 4BV/h could yield the same adsorption effect as 2BV/h. Considering the adsorption duration, the 4BV/h feeding flow rate was determined as the optimal choice for adsorption, requiring approximately 8 BV of the sample feeding solution.
Dynamic Desorption Curve on D101 Resin
During desorption the adsorbate is recovered from the saturated resin. The desorption solvent and the desorption flow rate are the key parameters to be optimized. 40 Figure 9 portrays the dynamic desorption curves with 10%, 30%, and 50% ethanol solution (desorption solvent). The desorption curves were obtained based on the volume of the desorption solution and the concentration of solute in the eluent. 30 The 10% ethanol resulted in a long and low desorption curve, implying a longer desorption process. However, the TgG could be rapidly desorbed from the resin using 50% and 30% ethanol. Because the desorption volume of 50% ethanol was 3BV, smaller than that of 30% ethanol of 4BV, 50% ethanol was selected as the proper desorption solvent.

Dynamic desorption curve of TgG on D101 resin taking the 10%, 30%, and 50% ethanol solutions as the desorption solutions.
The 2BV/h, 4BV/h, 7BV/h, and 10BV/h were screened to study the desorption flow rate. The results are depicted in Figure 10. The best desorption performance was demonstrated by 2BV/h and 4BV/h, with no difference between them. Under the desorption flow rate of 2BV/h and 4BV/h the TgG was desorbed in the first 3BV desorption solvent. A higher desorption flow rate provides less time for the adsorbate to act with the active sites of the resin to destroy the intermolecular forces, making it difficult for the adsorbate to leave the resin. 36 As displayed in Figure 10, the desorption curves of 7BV/h and 10BV/h were longer, implying the need for more time and desorption solvent to desorb the TgG absorbed on the resin. Therefore, a short working time of 4 BV/h was selected as the proper flow rate for TgG desorption. In addition, a 3BV desorption solvent was used to desorb TgG.

Dynamic desorption curve of TgG on D101 resin at flow rate of 2BV/h, 4BV/h, 7BV/h, and 10BV/h.
After the enrichment by the D101 resin the TgG concentration increased from 25.6 mg/g in the seed water extract powder to 43.1 mg/g in the powder yield from the resin desorption solution. The recovery of the resin process was 93%.
Isolation of TgG
To isolate TgG, the HPLC determination assay was referred to, according to which, 30:70 methanol–water (v:v) was used as the mobile phase to separate the lyophilized resin enrichment sample with an amount of 500 mg. However, the TgG showed abundant overlapping with other similar polarity compounds. It rapidly eluted out of the column together with other compounds, and could not be distinguished properly in the spectrum. Next, the volume ratio of methanol in the mobile phase was decreased gradually. At last, the mobile phase of 20:80 methanol-water (v:v) achieved a better resolution as shown in Figure 11. The TgG-contenting fraction of the eluent from 300 min to 410 min was collected, concentrated under vacuum, and lyophilized. Next, 17 mg of TgG with a purity of 96.2% was obtained from 500 mg resin enriched power (Figure 12).

The separation spectrum of the resin enrichment sample of seeds of C. officinalis at 280 nm with 20:80 methanol–water (v:v) as the mobile phase (TgG is denoted by the light red rectangle).

HPLC spectrum for the resin enrichment sample (a) and reverse-phase silica gel purified sample (b) 1:TgG.
Structure Determination of TgG
The obtained TgG was a white solid powder. Its NMR data are listed as follows. 1H-NMR (400 MHz, CD3OD): δH (ppm) 7.14(2H, s, H-2′′′′, 6′′′′), 7.05 (2H, s, H-2′′, 6′′), 7.04 (2H, s, H-2′′′, 6′′′), 6.95 (2H, s, H-2′, 6′), 6.11 (1H, d, J = 8.0 Hz, H-1), 5.60 (1H, t, J = 8.0 Hz, H-3), 5.46 (1H, t, J = 8.0 Hz, H-2), 4.62 (1H, dd, J = 12.0, 2.0 Hz, H-6α), 4.53 (1H, dd, J = 12.0, 4.0 Hz, H-6β), 3.99 (2H, m, H-4,5); 13C-NMR(100 MHz, CD3OD): δ C (ppm) 166.7 (C-7′′′′), 166.3 (C-7′′′), 165.8(C-7′′),164.9 (C-7′), 145.1 (C-3′′′′, 5′′′′), 144.93 (C-3′, 5′, C-3′′, 5′′), 144.92 (C-3′′′,5′′′), 139.3 (C-4′), 138.8 (C-4′′), 138.5 (C-4′′′, 4′′′′), 119.8 (C-1′′′′), 119.6(C-1′′), 119.0 (C-1′′′), 118.5 (C-1′), 109.2 (C-2′, 6 ′), 109.0 (C-2′′, 6′′, 2′′′,6 ′′′), 108.8 (C-2 ′′′′, 6 ′′′′), 92.5 (C-1), 75.2 (C-5), 75.1 (C-3), 70.0 (C-2),68.2 (C-4), 62.1 (C-6). The above data were identical to the reported TgG data. 4 (Figure 1A).
Discussion
The total TgG recovery of the process was 73.5%, which is not satisfied. Therefore, the research on the process optimization would be carried out to further improve the TgG recovery in the future. In the process of UAE extraction, the parameter of temperature is important. Increase in temperature offers quick solvent penetration resulting in higher TgG extraction. On the other hand, increasing temperature also has degrading effect on the TgG extraction because of the internal redox reactions, hydrolysis, and polymerizations. 14 Then keeping the temperature stable during the extraction process is vital. However, the UAE extraction temperature is badly affected by the ultrasonic thermal effect, which refers to the phenomenon where, during the propagation of ultrasonic waves in a medium, some of the acoustic energy is absorbed and converted into thermal energy due to the internal friction of the medium, resulting in an increase in the temperature of the medium. 41 In this study the extraction temperature was maintained by an external circulation of water obtained from a thermostat water bath. To further minimize the temperature fluctuations during the UAE extraction, an ultrasonic cleaning machine equipped with a stirrer is needed in the future study. Moreover during the resin enrichment process the feeding flow rate are to be further optimized in a scale-up study, in which the flow rate can be more accurately controlled.
Conclusion
An effective method was demonstrated to prepare TgG from the seeds of Cornus officinalis Sieb. et Zucc. This method includes three parts, namely, UAE extraction, resin enrichment, and reverse-phase silica-gel purification. During the UAE extraction, the parameters were optimized by RSM, including a sonication time of 44 min, sonication temperature of 42 °C, LSR of 22:1, and sonication power of 70 W. The D101 resin was the best choice for resin enrichment. The pseudo-first-order model was the best fit for the adsorption of TgG on the D101 resin. The Langmuir model was found to be suitable for describing the adsorption equilibrium of TgG on the D101 resin. At a controlled TgG concentration of 0.5 mg/mL in the feeding sample solution, the 4BV/h feeding flow rate was selected as the optimum for adsorption, with approximately 8 BV of the sample feeding solution. Similarly, 50% ethanol was selected as the proper desorption solvent for resin desorption, and 4 BV/h was selected as the proper flow rate for TgG desorption. In addition, a 3BV desorption solvent was used to desorb TgG. In the reverse phase silica–gel purification, under the chromatography conditions of 280 nm of detective wavelength, 500 mg of loading sample amount per cycle, and 20:80 methanol–water (v:v) mobile phase, the fraction of the eluent from 300 min to 410 min was collected, concentrated, and lyophilized to generate TgG. The recovery of the total TgG was calculated to be 73.5%. In summary, the established method is suitable for the preparation of high-purity TgG from the C. officinalis seeds. It not only provided a novel and alliterative method to obtain TgG for its wider application in the pharmaceutical industry. It also provides an avenue for adding potential value to the herbal medicine industry of C. officinalis using the by-product seeds.However, there have been nearly 90 polyphenols identified in the seeds extract. Therefore, further research on the screening for other valuable polyphenols and the development of the effective preparation methods is needed. This would be benefit for the efficient utilization of the seeds, and meet the sustainable consumption and production goal.
Footnotes
Acknowledgements
This work was supported by Natural Science Foundation of the He’nan Province of China, grant number 242300420102.
Availability of Data and Materials
The datasets used in this study are available from the corresponding author upon reasonable request.
CRediT Authorship Contribution Statement
Jun Li and Hua Jiang: Conceptualization, Methodology; Yue-yue Wang, Jia-xing Li, and Jun Li: Investigation; Lu Wang, and Yue-yue Wang: Writing- Original draft; Jun Li, and Hua Jiang Reviewing and Editing. All authors read and approved the final manuscript.
Declaration of Conflicting Interests
The authors declared no potential conflicts of interest with respect to the research, authorship, and/or publication of this article.
Ethical Approval
Ethical Approval is not applicable for this article.
Funding
The authors disclosed receipt of the following financial support for the research, authorship, and/or publication of this article: This work was supported by the Natural Science Foundation of the He’nan Province of China (grant number 242300420102).
Statement of Human and Animal Rights
This article does not contain any studies with human or animal subjects.
Statement of Informed Consent
There are no human subjects in this article and informed consent is not applicable.
Trial Registration
Not applicable, because this article does not contain any clinical trials.