
Abstract
Langerin is a C-type lectin involved in the immune response that forms a trimer in its active form. It can interact with carbohydrates using 2 sites with different selectivity, the C-lectin site, a Ca2+-mediated binding, and the cleft between chains. Here we report the complementary analysis of the interaction between a heparin-like hexasaccharide
Langerhans cells (LCs) are a type of dendritic cells located in the epithelium 1 that have been reported to constitute the first natural barrier to HIV 1 particles 2 and Ebola virus. Langerin, expressed on epidermal LCs, is a transmembrane type II C type lectin, with an intracellular domain, a transmembrane one followed by the extracellular domain (ECD), that ends on a classical Ca2+-dependent carbohydrate-binding domain, and it is functionally competent in a trimeric form. Langerin can interact with glycoproteins from the envelope of the pathogens using 2 alternative binding sites, the lectin C site, Ca2+ dependent, and the interface formed by trimerization of monomeric structures. 3
In a previous paper,
4
we have characterized both sites and perform a study on the association of a library of small GAG (glycosaminoglycans) and

The previous solution structures of

Comparison of the 1H nuclear magnetic resonance spectra of 1 in the presence of Ca2+ (top) and after addition of EDTA (bottom).
We apply the methodology based on transversal rotating-frame Overhauser spectroscopy (ROESY) experiments to obtain interprotonic distances independent of global molecular motion. Heparin oligosaccharides exhibit a top rotor behavior when they are larger than 5 units. This methodology that allows the extraction of distances without any consideration on the rate of tumbling was previously applied for the same compound in the absence of buffer. 8,10 In this experiment, transferences of combinations of transverse and longitudinal polarization as a function of the time achieved by varying the spin-lock field offset make it possible to obtain experimental distances independently of the correlation time. 8,10 The main distances obtained in buffer are recorded in Table 1. These distances are coherent with those obtained for the case of the compound in pure water, corresponding with a linear molecular shape. Unfortunately, severe overlaps prevented a complete extraction of the distances of interest. Then we use selective 1-dimensional (1D) ROESY experiments (Table 1).
Experimental Distances in the Presence of Ca2+ (ROESY-Off Resonance) and After Addition of EDTA (1D-ROESY).
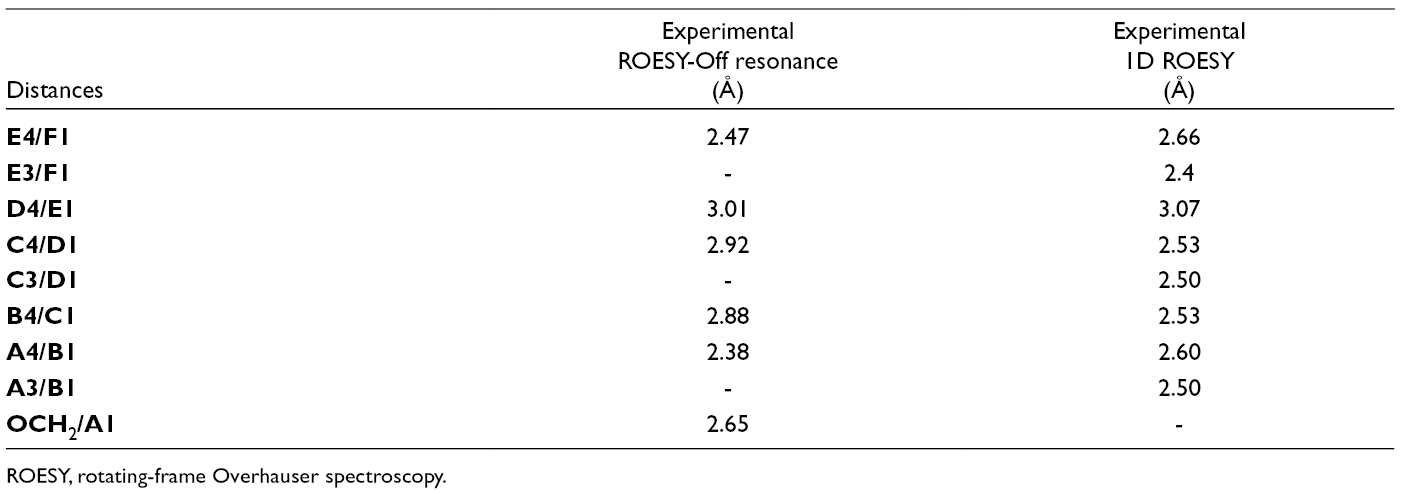
ROESY, rotating-frame Overhauser spectroscopy.
Next, we carried out studies of molecular dynamics in explicit solvent, focusing on 2 aspects: the characterization of the iduronate ring conformational equilibrium and the geometry of interglycosidic bonds. 11 Iduronate residues exhibit a unique conformational equilibrium that for the internal ones is established between chair 1C4 and 2SO twisted boat conformations. 12 This equilibrium has a time scale longer than the time than molecular dynamics simulation is capable of handling it. 13 Therefore, we performed 2 molecular dynamics simulations without restrictions in explicit solvent starting from a different conformation, either 1C4 chair or 2SO twisted boat, since the average lifetime of these compounds is superior to that of the dynamics, and further calculated by linear combination. 11 In this case, only for the central residues the results were compatible with the experimental data. Following the usual protocols from our laboratory, molecular dynamics were performed using time-averaged restrictions (MD-tar), in implicit solvent. Using the distances H2-H5 of each ring as the main experimental restriction it was possible to obtain theoretical results compatible with the experimental ones, consistent with the 2 main conformations, 1C4 and 2SO, being in equilibrium. 13 As previously described, some minor conformations adjacent in the pseudorotational equilibrium to the 2SO one can be detected. Considering the low equilibrium barrier between the conformations and their low population, we assume the existence of a conformational family represented by the 2SO. 13 With the calculated values of the populations in equilibrium, the theoretical coupling constants were recalculated and were similar to the experimental ones in all cases.
The interglycosidic Nuclear Overhauser Enhancement (NOEs)-derived distances are also compatible with a syn-Φ, syn-Ψ type dispositions in all cases. This geometry is the one described for heparin and the one that has been found in other NMR studies including the preliminary one for this compound performed in pure D2O. The distances of both the MD and the MD-tar are similar, which corroborates the goodness of the parameters used in the MD-tar (Supplementary Material). Therefore, the 3-dimensional (3D) structure is not affected by the presence of Ca2+ or buffer. In both cases, the iduronate residues are in fast equilibrium between 1C4 and 2SO while the global shape of the hexasaccharide is quasilinear with a high pitch helical shape (Figure 2).

Superimposition of structures taken along the MD-tar simulation of 1.
We added langerin to the sample, and we proceeded to record the NMR experiments, then EDTA-d11 was added to the same sample to remove the Ca2+ cations from the medium, recording the same experiments. Interestingly, the displacements of the signals of the anomeric protons are not reflection of changes in the 3D structure (see below). These variations have been previously described on analogous hexasaccharides upon Ca2+ addition. 4,9 This observation was attributed to a restriction of the cation movement opposed to the polyoinic effect caused by the high density of linear charge of the GAG. The effect is more significant at greater lengths of heparin-like oligosaccharides. 9 We started the analysis of the complexes by recording the transfer-NOESY experiments in the presence and absence of Ca2+. In conclusion, there is no significant conformational change upon binding, in any of the 2 conditions, with the ligand remaining in its natural elongated shape with the iduronate residues still under the 1C4 to 2SO conformational equilibrium (see Supplementary data).
The saturation transfer difference nuclear magnetic resonance (STD-NMR) experiments were performed in both samples with and without Ca2+ (Figure 3). Due to the substantial overlap found, only the signals of the anomeric protons could be monitored (Table 2). Under the conditions imposed by the shortage of compound, it is not possible to perform saturation transfer experiments with an additional magnetization transfer to minimize the effects of overlap. Fortunately, the anomeric protons are located in an isolated region and are sufficiently resolved to be integrated above 500 MHz.

Saturation transfer difference experiments for 1 in the absence (left) and in the presence of EDTA (right). The lower spectra are the reference and the upper ones the saturation transfer difference nuclear magnetic resonance at 5 seconds saturation.
Experimental, Without and With EDTA, and Calculated Relative STD-AF0.

To carry out the theoretical analysis, we have started by calculating a model structure of the complex. We have used the crystallographic structure (3KQG) and models derived from the experimental analysis of the ligand and the ligand within the complex. We have found similar results using Glyde or AutoDock vina, also coinciding with the first structure from Fieschi 14 and other from us. In all cases, the oligosaccharide structures are concentrated in the cleft generated by the fusion of the monomers at the neck domain that appears when the trimer is assembled between 2 of the adjacent chains (Figure 4).
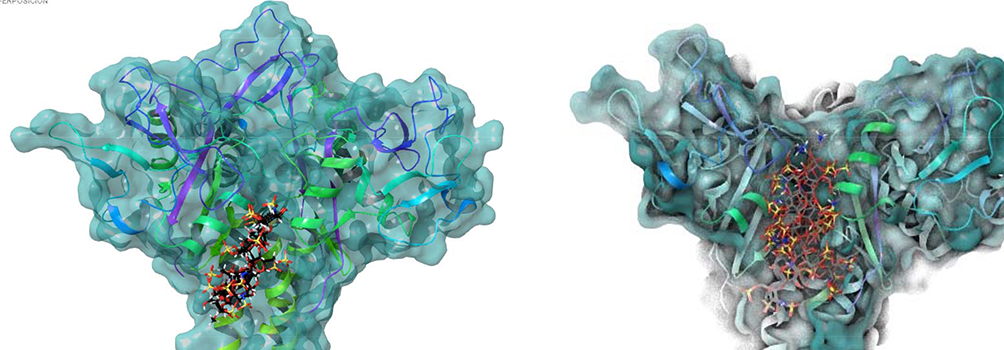
Superimposition of the poses obtained from docking results: AutoDock (right) and Glyde (left).
Saturation transfer difference results are consistent with this type of binding. Consistent with that, the results indicate a linear binding along the surface without a particular area or region of the ligand especially favored in the association. Also, this is coherent with the fact that Ca2+ is not needed there for binding as would be if the C-lectin binding pocket is involved in the binding. This is also in agreement with the previously mentioned data indicating that there was no influence of calcium in the association. In general, the structures converge in a particular region of the cleft (Figure 4).
We applied CORCEMA-ST, using the first structure of the complex obtained from Glyde/AutoDock as theoric model, along the whole mixing times applied. Due to experimental overlap, only the anomeric protons were considered as they were the only ones that could be analyzed accurately along the whole curve of STD0-AF. However, these results are not as accurate as those from other types of complexes in which the receptor-ligand interaction is more selective. Several structures are different in the polarity of the oligo chain relative to the protein, and both give reasonable NOE R-factor, 0.1 (Figure 5).

Saturation transfer difference nuclear magnetic resonance growing rates in the presence of langerin and Ca2+ (dots) and the CORCEMA-ST-predicted growing curves based on the structure of one of the complexes calculated using AutoDock Vina.
Experimental
Production of Langerin ECD
Langerin (Lg) ECD constructs, comprising residues 68-328, were overexpressed as inclusion bodies, then refolded and purified to homogeneity in a functional form as already described. 14 Lg ECD was then concentrated after dialysis in buffer: D2O (150 mM NaCl, 4 mM CaCl2, 25 mM d11-Tris, pD = 8).
Nuclear Magnetic Resonance
Experiments were performed in a Bruker Avance III 700 MHz fitted with a QCI 5 mm cryoprobe for 1H, 13C, 15N, and 31P with cold preamplifiers in 1H, 13C, and 2H channels or a 500 MHz Avance with a TXI, 5 mm probe, at 298 K. NMR samples were prepared in 300 µL of 99.9% D2O buffer containing 25 mM Tris-d11 pD 8, 150 mM NaCl, and 4 mM CaCl2, ligand concentration was 0.95 mM, and EDTA was added from a 10 mM D2O solution. Samples with langerin, 16.7 µM, were prepared from addition of concentrated solution, in the same buffer. Protein-to-ligand molar ratio was 1:57. Assignment of the hexasaccharide has been described, both in water 8 and in the same Tris buffer. 4 Two-dimensional COSYDQF, TOCSY, NOESY, and HSQC (Bruker pulse sequences experiments) were performed for fine calibration and checking the integrity of the sample.
ROESY off-resonance were performed, processed, and distances calculated as described for the same compound. 8,10 Tr-NOESY experiments were performed using a phase-sensitive pulse program with gradient pulses in the mixing time and cross-relaxation rates σ NOE were calculated. 15 Using the isolated spin pair approximation 16 and using the fixed H1-H2 distance at the nearest GlcNHSO3ring as reference (2.5 Å), the key interglycosidic proton-proton distances were calculated according to the expression d x = d ref (σ ref/σ x)1/6, where d x is the unknown distance to be determined, d ref is the distance used as reference, and σ ref and σ x are the cross-relaxation rates of the reference and unknown distance, respectively. 17
Saturation transfer difference nuclear magnetic resonance experiments were carried out with excitation sculpting solvent suppression and a 10 millisecond spin-lock filter after the 90° pulse to reduce residual signals from the protein. For selective protein saturation, cascades of 49-millisecond Gaussian-shaped pulses at a field strength of 50 Hz were employed, with a delay of 1 millisecond between successive pulses. 5 The on-resonance and off-resonance frequencies were set to 0.0 and 40 ppm, respectively. Blank experiments were performed to assure the absence of direct saturation of the ligand proton signals. The relaxation delay was properly adjusted so that the experiment time length was kept constant (5.1 seconds). Saturation transfer difference nuclear magnetic resonance experiments were performed with 1024-512 scans. Saturation times were of 0.5, 0.75, 1, 1.5, 2.0, 3.0, 4.0, and 5 seconds for samples with Ca2+ and 0.75, 1.0, 2.0, 3.0, and 4.0 for samples without Ca2+.
Saturation transfer difference amplification factors (STD-AF0) were calculated from the STD initial slopes. 7,18 To do so, the evolution of the STD-AF with the saturation time (t sat) was fitted to the equation STD-AF (t) = a (1-exp(-bt)), where the parameter a represents the asymptotic maximum of the STD buildup curve (STDmax), b is a rate constant related to the relaxation properties of a given proton that measures the speed of the STD buildup (k sat), and t is the saturation time (t sat). Thus, the STD-AF0 values were obtained as the product of the ab coefficients.
Molecular Dynamics
MD were run using AMBER 12 19 including the specific carbohydrate parameterization GLYCAM 06h. 20 Two molecular dynamics of 500 nanoseconds in explicit water TIP3P box, with Na+ ions for electroneutrality, were run with starting conformations for the iduronates 1C4 or 2SO. The topology and coordinate files were built with the tLEAP module of Amber 12. GLYCAM 06h parameters were used to model the sugar moiety, including the sulfate and sulfamate groups, and the AMBER ff12SB parameters for the water molecules and calcium ions. 21 The equilibration protocol and production dynamics have been performed with sander module of Amber 12. The data processing has been done with the ptraj module of AMBER 12, except for the Cremer-Pople coordinates, which were determined with a script from R.J.Woods’ group. Additional molecular dynamics with time-averaged restrains were also run in absence of explicit solvent. 22
Molecular Modeling
Conformational sampling of hexasaccharide and flexible induced fit docking were carried out using the Glide protocol within the Schrodinger molecular modeling suite.
23
The crystal structure of langerin (pdb code 3KQG) was used as the starting structure. A flexible induced fit protocol was carried out to obtain a
CORCEMA-ST
The CORCEMA-ST simulations were performed using the crystal structure of langerin ECD (pdb code 3KQG) 24 and the structure of the hexasaccharide previously obtained by NMR. As no chemical shift assignment of the protein protons was available, they were predicted by using the program SHIFTX. 25 The best from the three poses obtained by docking was selected to quantify the saturation. The best conditions for the complex were free ligand correlation time 0.6 nanoseconds, bound ligand correlation time 290 nanoseconds, protein concentration 54 µM, ligand concentration 1.19 mM and dissociation constant 0.4 mM.
The STD intensities for each binding mode were calculated as percentage fractional intensity changes, S calc,k, from the intensity matrix I(t) (S calc,k = (([(I 0k − I(t)k)*100]/I 0k), where k is a particular proton in the complex, and I 0k its thermal equilibrium value. The calculation was carried out for the each of the saturation times: 0.5, 1, 1.5, 2, 3, 4, and 5 seconds (with EDTA) and 0.5, 1, 1.5, 2, 3, and 4 seconds (without EDTA). The theoretical STD values were compared to the experimental ones using the NOE R-factor defined by the following:

Footnotes
Acknowledgments
We also thank the CITIUS NMR Facility of the University of Seville for time generously provided. We thank Prof F. Fieschi for the gift of samples of langerin EDC.
Declaration of Conflicting Interests
The author(s) declared no potential conflicts of interest with respect to the research, authorship, and/or publication of this article.
Funding
The author(s) disclosed receipt of the following financial support for the research, authorship, and/or publication of this article: The article was financially supported by the Spanish Ministry of Economy and Competitiveness (CTQ2015-70134-P), Junta de Andalucía (P12-BIO-1938) and theEuropean Union (ERDF).
Supplemental Material
References
Supplementary Material
Please find the following supplemental material available below.
For Open Access articles published under a Creative Commons License, all supplemental material carries the same license as the article it is associated with.
For non-Open Access articles published, all supplemental material carries a non-exclusive license, and permission requests for re-use of supplemental material or any part of supplemental material shall be sent directly to the copyright owner as specified in the copyright notice associated with the article.