
Abstract
Detection of prostate cancer (PCa) and distinguishing indolent versus aggressive forms of the disease is a critical clinical challenge. The current clinical test is circulating prostate-specific antigen levels, which faces particular challenges in cancer diagnosis in the range of 4 to 10 ng/mL. Thus, a concerted effort toward building a noninvasive biomarker panel has developed. In this report, the hypothesis that nuclear magnetic resonance (NMR)-derived metabolomic profiles measured in the urine of biopsy-negative versus biopsy-positive individuals would nominate a selection of potential biomarker signals was investigated. 1H NMR spectra of urine samples from 317 individuals (111 biopsy-negative, 206 biopsy-positive) were analyzed. A double cross-validation partial least squares-discriminant analysis modeling technique was utilized to nominate signals capable of distinguishing the two classes. It was observed that after variable selection protocols were applied, a subset of 29 variables produced an area under the curve (AUC) value of 0.94 after logistic regression analysis, whereas a “master list” of 18 variables produced a receiver operating characteristic ROC) AUC of 0.80. As proof of principle, this study demonstrates the utility of NMR-based metabolomic profiling of urine biospecimens in the nomination of PCa-specific biomarker signals and suggests that further investigation is certainly warranted.
Prostate cancer (PCa) is a disease that is estimated to be diagnosed in 164 690 American men in 2018. 1 As a disease that typically occurs late in life, morbidity rates are low, especially given that there are forms of PCa malignancies that progress slowly. However, this presents a critical challenge to clinicians responsible for diagnosing and delivering prognoses since there is a current lack of clinical standard for predicting aggressive versus indolent forms of PCa. The current clinical screening test is circulating serum prostate-specific antigen (PSA); however, there are several issues associated with the PSA test. 2–5 First is the low specificity of PCa, with multiple conditions associated with prostate swelling also resulting in elevated PSA levels. 6 Second is the sensitivity, with a clinically challenging range of 4 to 10 ng/mL that is difficult to diagnose as aggressive or indolent PCa. As a result of these drawbacks, there have been recent reports suggesting that PSA testing has potentially done greater harm than good, primarily through overdiagnosis and the associated deleterious treatment side effects. 7–9 Thus, there is a critical requirement for clinically relevant screening tests capable of distinguishing aggressive and indolent forms of PCa with high specificity.
Biomarker discovery in relation to PCa continues to be an active area of research, and several recent reviews are available on the topic. 10–16 In many cases, biomarkers are discovered via an “omics” approach, and thus there are candidate molecules representative of the genetic, protein, and metabolite levels. The standard clinical test relies on circulating PSA levels, a protein that exists both in free and bound forms. Thus in an effort to refine PSA testing, both fractions have been included, with the amount of free PSA (%fPSA) identified as an improved indicator. 17 Further examples of candidate protein markers include α-methylacyl-CoA racemase 18,19 and anterior gradient 2. 20 Several peptides have also been nominated in urine as potential biomarkers of PCa, although care must be taken in sample collection and preparation. 21 Several genes have been identified as PCa-specific biomarkers, including PCA3 and the TMPRSS2:ERG gene fusion. These have been detected in both tissue 22,23 and urine, 24–26 and are thus attractive from the standpoint of development of noninvasive PCa biomarker panels. In addition, DNA methylation 27 and single-nucleotide polymorphisms 28 have been explored as urinary PCa markers. Finally, metabolite biomarkers have been identified, with a recent comprehensive profiling study nominating several metabolites capable of distinguishing biopsy-negative and biopsy-positive urine sediment samples. 29 Among the metabolites highlighted, sarcosine has received particular attention and several validation studies have since been reported, with a clear consensus on biomarker status yet to be established. 30–35
Metabolomic-based investigations are attractive in terms of sample processing, where, for example, extensive protein purification assays or gene amplification procedures are not necessary. Additionally, perturbed metabolite levels represent the end product of genetic dysfunction, and thus may be utilized to trace through the metabolic pathways to the dysfunctional enzymatic process. Analytical platforms commonly employed for metabolomic studies include mass spectrometry (MS) and nuclear magnetic resonance (NMR), each possessing complementary strengths and weaknesses. 36 PCa diagnosis continues to be a difficult clinical challenge, and new diagnostic techniques based on biomarker detection in noninvasive samples are under active research. Urine is perhaps the most attractive noninvasive biospecimen in terms of simplicity of collection, with biomarker detection possible in both urine supernatant and sediment. MS-based PCa metabolomic investigations of urine samples have been extensively reported; however, there is a noticeable absence of NMR-based reports. NMR of urine samples has been established in relation to various diseases; 37–41 thus this report intends to address biomarker panel detection for PCa based on the hypothesis that certain metabolites detected in urinary 1H NMR profiles of biopsy-negative individuals will differ from biopsy-positive individuals. Representative 1H NMR spectra for biopsy-negative and biopsy-positive individuals are given in Figure 1.
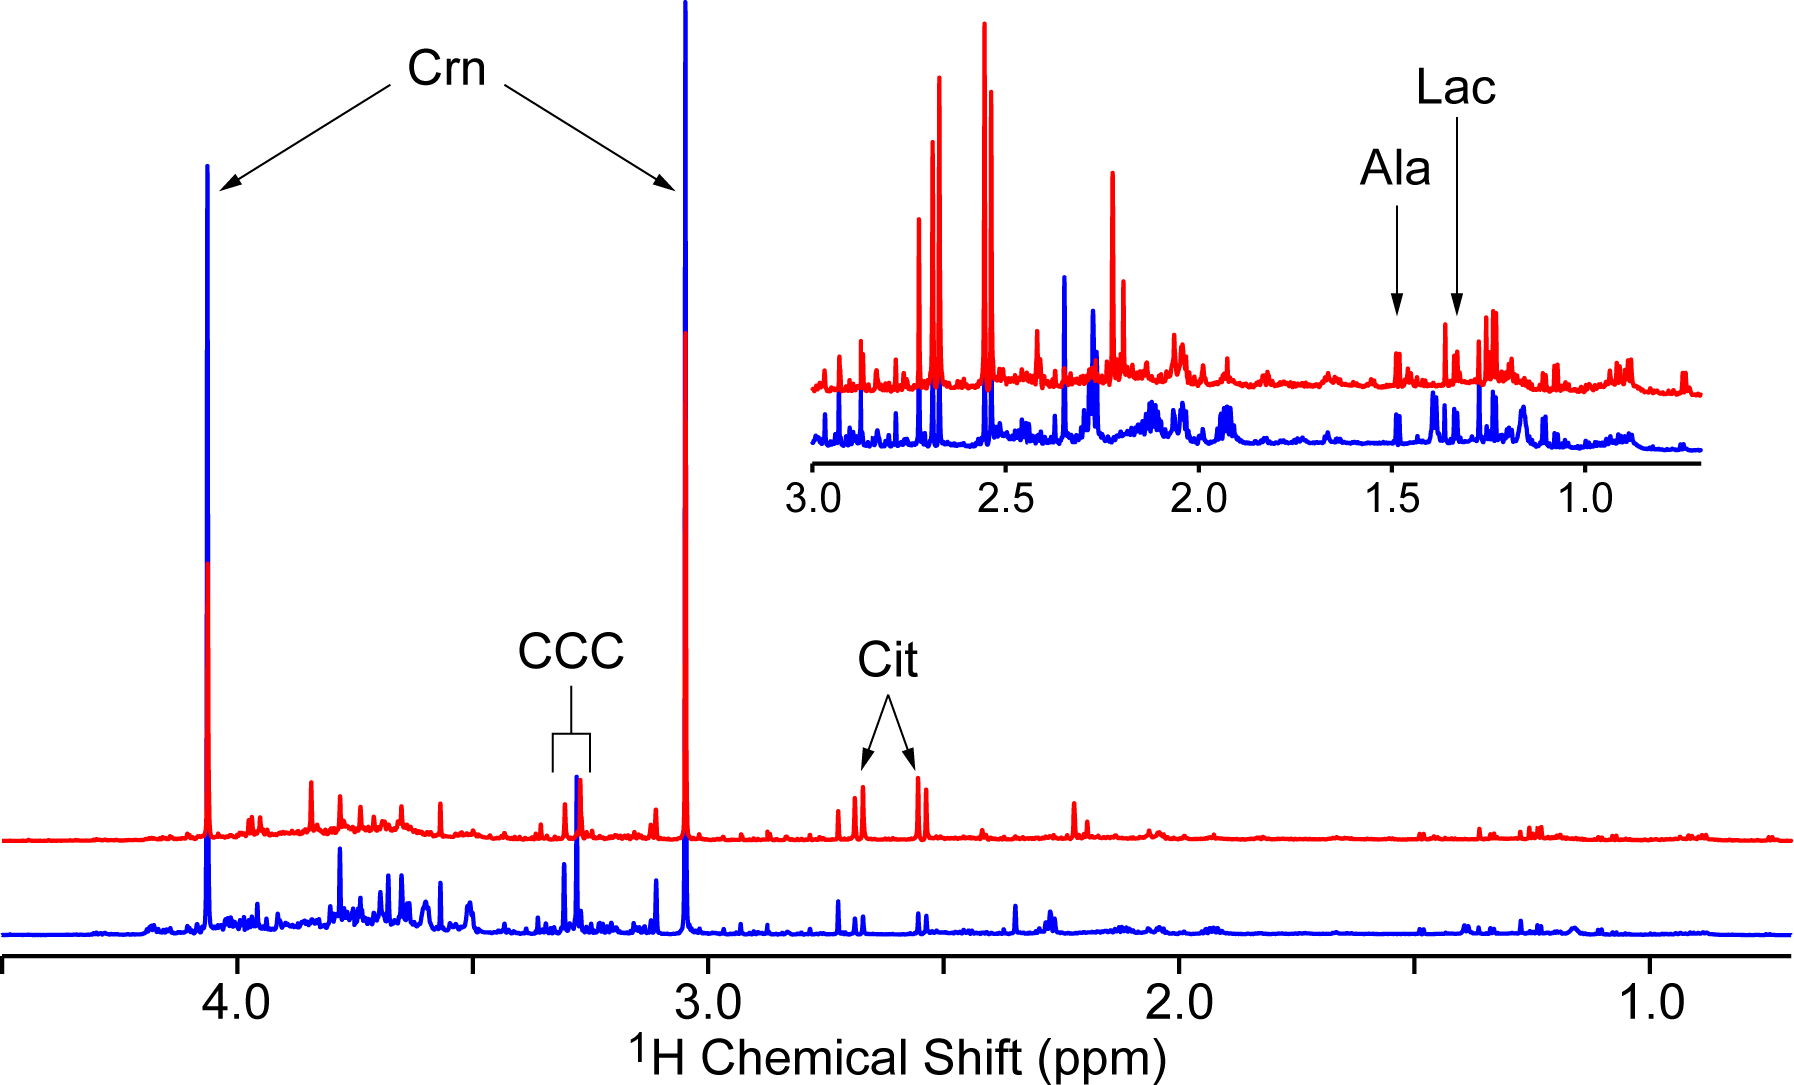
The 900 MHz 1H NMR spectra of a selected biopsy-negative (blue) and biopsy-positive (red) urine supernatant sample. Spectra were referenced to 3-(trimethylsilyl)propionic-2,2,3,3-d4 acid sodium salt (TSP), probabilistic quotient normalized, and aligned. Inset: expansion of chemical shift region from 0.7 to 3.0 ppm, with vertical scale increased by a factor of 10. Selected assignments of common prostate cancer biomarkers reported in the literature are given (see text for references): Crn, creatinine; CCC, choline containing compounds region; Cit, citrate; Ala, alanine; Lac, lactate.
Urine is a particularly challenging biospecimen to work with in terms of biomarker discovery due to the large compositional variability depending on diet, time of collection, gender, and medication taken by the patient. 42–45 To overcome this challenge, large sample cohorts are necessary and multivariate statistical modeling is essential in identifying reliable candidate biomarkers. Principal components analysis (PCA) is a common technique utilized in metabolomic studies; however, PCA failed to separate biopsy-negative from biopsy-positive profiles (data not shown) since the urine compositional variation was dominant over the variation attributable to PCa. Thus a partial least squares-discriminant analysis (PLS-DA) approach was applied to the data.
Auto-scaled data. As argued by Westerhuis and coworkers, 46 model parameters reporting on performance characteristics are often difficult to judge without an idea of how the model operates under the null hypothesis. Thus, they proposed performing permutation analyses as part of the modeling process to generate expected parameter distributions for the same data set assuming the null hypothesis is true. The expected number of misclassifications, area under the curve (AUC) values, and Q 2 values after permutation of class labels are summarized in Figure 2 and Table 1. Taking 30% of the data as the test set resulted in 96 samples comprising the test set. The number of misclassifications and AUC values were determined to be 48 ± 2 and 0.49 ± 0.04, respectively, indicating as expected that the modeling performed no better than random in class prediction. Importantly, the parameter distributions are vastly different when a double cross-validation (2CV) PLS-DA is applied utilizing the correct class labels. Improvement of all parameters was observed (decreased number of misclassifications, increased Q 2, and increased AUC, P < 0.0001 in all cases), suggesting the models were capable of identifying signals important in distinguishing biopsy-negative versus biopsy-positive individuals.

Distributions of the number of misclassifications, Q 2, and AUC after 2CV-PLS-DA modeling of the full NMR data set. Data were auto-scaled prior to modeling; 1000 models were generated using the correct class labels (red), and 500 models using permuted class labels (blue). In all cases, the distributions using the correct class labels were significantly different compared to the permuted models (P < 0.0001 for each parameter). The data are summarized in Table 1. AUC, area under the curve; 2CV-PLS-DA, double cross-validation partial least squares-discriminant analysis; NMR, nuclear magnetic resonance.
Summary of Model Performance Parameters for 2CV-PLS-DA Modeling Based on NMR Data That Was Auto-Scaled; 1000 Models Were Generated Using Original Labels and 500 Models Were Generated Using the Permuted Labels. In All Cases, the Test Data Set Contained 96 Randomly Selected Samples (30% of the Total Data Set). All Values Are Reported as Mean ± Standard Deviation. In the Case of Permuted Data, Mean Parameter Values Were First Calculated Over the 20 Models Per Label Permutation Followed by Mean ± Standard Deviation Calculation Over All 500 Permutations. The List of Variables Used in These Models Is Provided in the Supplementary Data.

2CV-PLS-DA, double cross-validation partial least squares-discriminant analysis; NMR, nuclear magnetic resonance; CARS, competitive adaptive reweighted sampling; VIP, variable importance to projection; Reg. coeff., regression coefficient; AUC, area under the curve.
Application of 2CV PLS-DA resulted in a collection of 1000 models, each built using a randomly selected subset containing 70% of the samples from the full data set. Thus, while each model is different, all models are related. 46 Identification of a single model would facilitate the examination of standard PLS-DA parameters such as latent variable loadings and scores in order to gain information on the variables contributing to the class separation. In the case where many similar models are generated, selection of a single “best” model is not trivial. 46 Therefore, variable selection methods were applied to each model generated, resulting in a collection of important signals over all models. Variable selection continues to be an important problem in multivariate analyses, 47,48 and without a clear consensus on a particular strategy, three methods were explored. The variable importance to projection (VIP) score is a value based on PLS loadings and thus reports on the importance of each variable in contributing to the overall model. 49 Since the average VIP score is 1, variables whose value is greater than 1 are then considered important. Alternatively, the absolute value of the regression coefficient calculated in the PLS algorithm may be used to rank each variable, which describes the relationship between the data loadings and the class label in DA. 49 Finally, a method recently proposed by Li and coworkers 48 termed CARS (competitive adaptive reweighted sampling) was explored as an alternative variable selection protocol. CARS aims to generate calibration models with variable subsets, with predictive power used to determine the optimal variable collection. 48 A variable subset is selected from the model with the best prediction performance.
Each variable selection protocol was applied to each model generated, and thus 1000 variable collections were obtained. All variables selected by CARS were examined and the frequency with which a variable was selected was calculated. In the case of VIP and regression coefficient-ranked variables, only the top 2% of variables from each model were collected (therefore, VIP score >4.26), followed by calculation of the frequency of selection (summarized in Table 2). Regardless of the variable selection protocol, variables that appeared in at least 50% of the models generated were considered important. This resulted in a collection of 21, 21, and 29 variables for the VIP, regression coefficient, and CARS variable selection protocols, respectively. It was observed that the 21 variables identified using VIP scores were identical to those selected using regression coefficients. Additionally, 12 variables were found to be common with the CARS variable list (all variable lists provided in the Supplemental Data). Selecting these variable subsets, logistic regression analysis was performed and receiver operating characteristic (ROC) curves generated, resulting in AUC values of 0.83 and 0.94 using all regression coefficient and CARS variables, respectively (Figure 3). Additionally, 2CV PLS-DA with permutation analysis was performed utilizing the regression coefficient and CARS variable subsets, with the results presented in Figure 4 and summarized in Table 1. Clearly, the predictive power of the models was enhanced when selecting variable subsets, with particular improvement using the CARS variable subset.
The Number of Variables Selected for Each Data Treatment Procedure and Variable Selection Protocol. The Value Indicates the Number of Variables That Appeared in at Least 50% of the Models Generated, and Values in Parentheses Are the Total Number of Unique Variables Identified Over the 1000 Models Generated.

VIP, variable importance to projection; CARS, competitive adaptive reweighted sampling.

Logistic regression analysis performed on the auto-scaled NMR data set taking the (a) CARS variables and (b) regression coefficient-ranked variable subsets identified from 2CV-PLS-DA analysis. ROC curves were generated using the first 10, 20, and 29 variables of the CARS subset, and the first 5, 10, 15, and 21 variables of the regression coefficient-ranked subset. The corresponding AUC values for each ROC curve are given in the legend. NMR, nuclear magnetic resonance; CARS, competitive adaptive reweighted sampling; 2CV-PLS-DA, double cross-validation partial least squares-discriminant analysis; ROC, receiver operating characteristic; AUC, area under the curve.

Distributions of the number of misclassifications, Q 2, and AUC after 2CV-PLS-DA modeling using variable subsets. The NMR data was auto-scaled prior to modeling. The subsets are the CARS variable subset (a-c), regression coefficientranked subset (d-f), and the VIP-ranked subset (g-i). In all cases, 1000 models were generated using the correct class labels (red) and 500 models were generated using permuted class labels (blue). The distributions using the correct class labels were all significantly different in comparison with the permuted distributions (P < 0.0001 for each parameter and each subset). The data are summarized in Table 3, and the number of variables included in each model is given in Table 2. The full variable lists are available in the supplemental data. AUC, area under the curve; 2CV-PLS-DA, double cross-validation partial least squares-discriminant analysis; NMR, nuclear magnetic resonance; CARS, competitive adaptive reweighted sampling; VIP, variable importance to projection.
Variable changes relative to biopsy-negative data. The effect of centering and scaling all variables with respect to the mean and standard deviation of the normal samples (i.e., biopsy-negative) is a common approach to gain insight into variables whose levels are different specifically in comparison with normal samples. Holding all modeling procedures otherwise constant, the resulting performance parameters are reported in Table 3. As in the case of auto-scaling, performance after class permutation yielded results consistent with random sample class prediction. Utilizing the correct class labels, the predictive performance was observed to slightly increase when z-score changes with respect to biopsy-negative variables were used. Variable selection resulted in 34, 31, and 9 signals appearing in at least 50% of the models, ranked according to VIP scores (resulting in scores >2.46 collected), regression coefficients, and CARS, respectively (Table 2). In contrast to the auto-scaled data, all VIP-ranked variables were unique in comparison with the regression coefficient-ranked signals, while 5 of the 9 CARS-selected variables were also selected utilizing regression coefficient ranking .
Summary of Model Performance Parameters for 2CV-PLS-DA Modeling Based on NMR Data That Was Centered and Scaled Relative to the Biopsy-Negative Samples; 1000 Models Were Generated Using Original Labels and 500 Models Were Generated Using the Permuted Labels. In All Cases, the Test Data Set Contained 96 Randomly Selected Samples (30% of the Total Data Set). All Values Are Reported as Mean ± Standard Deviation. In the Case of Permuted Data, Mean Parameter Values Were First Calculated Over the 20 Models Per Label Permutation Followed by Mean ± Standard Deviation Calculation Over All 500 Permutations. The List of Variables Used in These Models Is Provided in the Supplemental Data.

2CV-PLS-DA, double cross-validation partial least squares-discriminant analysis; NMR, nuclear magnetic resonance; CARS, competitive adaptive reweighted sampling; VIP, variable importance to projection; Reg. coeff., regression coefficient.
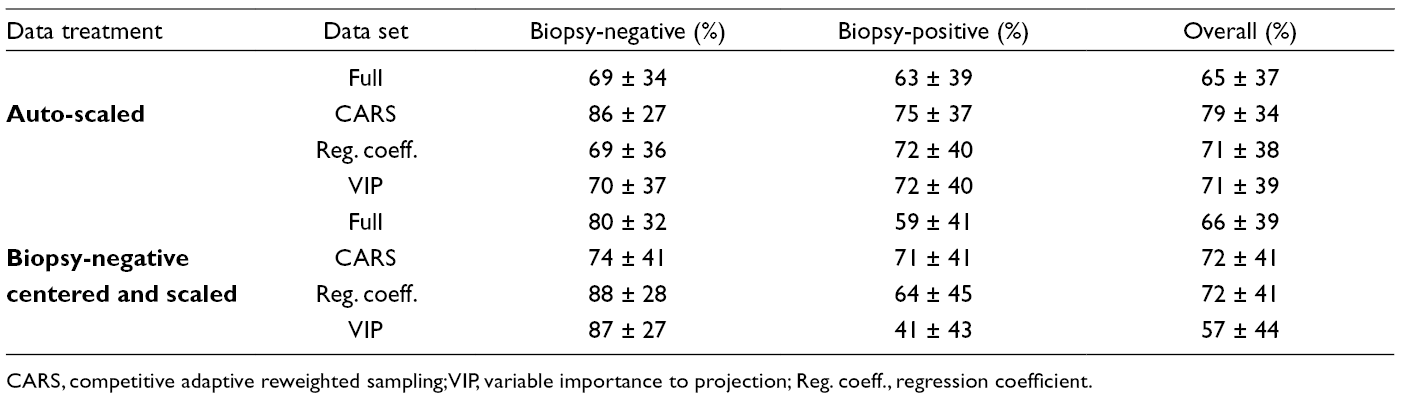
Interestingly, only modest improvement in modeling parameters was observed when selecting variable subsets (Table 3). In particular, CARS failed to improve the modeling parameters as observed with the auto-scaled data, perhaps a result of the severe reduction in modeled variables. This is in contrast to the VIP score variable subset, where the increase in modeled variables degraded the classification parameters in comparison with the auto-scaled data. Close examination of the correct classification rates for each class (biopsy-negative and biopsy-positive) revealed a high rate for the biopsy-negative samples, but a poor rate for the biopsy-positive samples, contributing to an overall poor classification rate (Table 4). This is particularly true for the VIP variable subset which had the lowest modeling performance.
Correct Classification Rates Calculated for Each Model. After Each Model Was Determined, It Was Used to Predict the Classes of the Test Data Set. This Was Done Over the 1000 Models Generated, and the Number of Times Each Sample Was Part of the Test Set and Classified Correctly Was Determined. Classification Rates Were Then Calculated for Biopsy-Negative and Biopsy-Positive Samples as Individual Groups, and Over All Samples.
CARS, competitive adaptive reweighted sampling; VIP, variable importance to projection; Reg. coeff., regression coefficient.
Variable subset comparisons—univariate statistics and correlations. The variable selection protocols identified signals important in multivariate 2CV-PLS-DA modeling. Once these signals are identified, it is interesting to determine their univariate capability in distinguishing PCa-positive versus PCa-negative groups (variable lists and P-values for each value are available in the Supplemental Data). Wilcoxon rank-sum tests were done for each variable along with the appropriate data scaling procedure. The number of variables deemed significant (i.e., P < 0.05) for each model are summarized in Figure 5. A potential explanation for the poor performance of the VIP-selected variable subset after z-score calculation relative to normal samples is evident. Despite having the largest variable subset, only 4 of the signals identified from the multivariate modeling were found to be significant using univariate statistics. In contrast, the variable subset with the best multivariate modeling parameters (auto-scaled data, CARS variable selection) was comprised of signals where greater than 50% were significant using univariate statistics.

Bar plots representing the number of significant and non-significant variables identified in each variable subset using univariate statistics (Wilcoxon rank-sum test). (a) NMR data was auto-scaled; (b) NMR data was centered and scaled relative to the biopsy-negative samples. All P-values were corrected for multiple comparisons using the Bonferroni correction. Significance was tested at α = 0.05. The shaded bar indicates the number of significant variables and the white bar the number of non-significant variables for each subset. NMR, nuclear magnetic resonance; CARS, competitive adaptive reweighted sampling; VIP, variable importance to projection; Reg. coeff., regression coefficient.
With the development of variable subsets containing a relatively large number of signals, it is reasonable to question whether each signal is acting independently of the others. For example, since these variables are NMR signals it might be assumed that multiple resonances from a single molecule may be contributing to the model. To address this point, the two scaled data sets were subjected to a statistical total correlation spectroscopy analysis and the correlation between each signal within each subset of variables was examined. 50 In general there were a small number of correlations greater than 0.8, and even fewer correlations with r > 0.9, above which correlations suggest molecular structure connectivity 51 (Figure 6). However, the VIP data set subjected to normalization and scaling relative to biopsy-negative samples strongly deviates from this trend. A set of strong correlations was observed, with a high percentage possessing r > 0.9. The correlated variables primarily involved signals in the range of 3.2 to 3.9 ppm and most likely originate from a sugar molecule (e.g., glucose). This model contains a large number of highly correlated signals which may further explain the poor predictive performance since a large amount of redundant information is included. Interestingly the CARS model with auto-scaled data (i.e., the best multivariate model) had the lowest ratio of correlated signals to total number of variables modeled. This is an indication that the CARS method selected the greatest number of independent variables and thus had the maximum information content for reliable modeling.
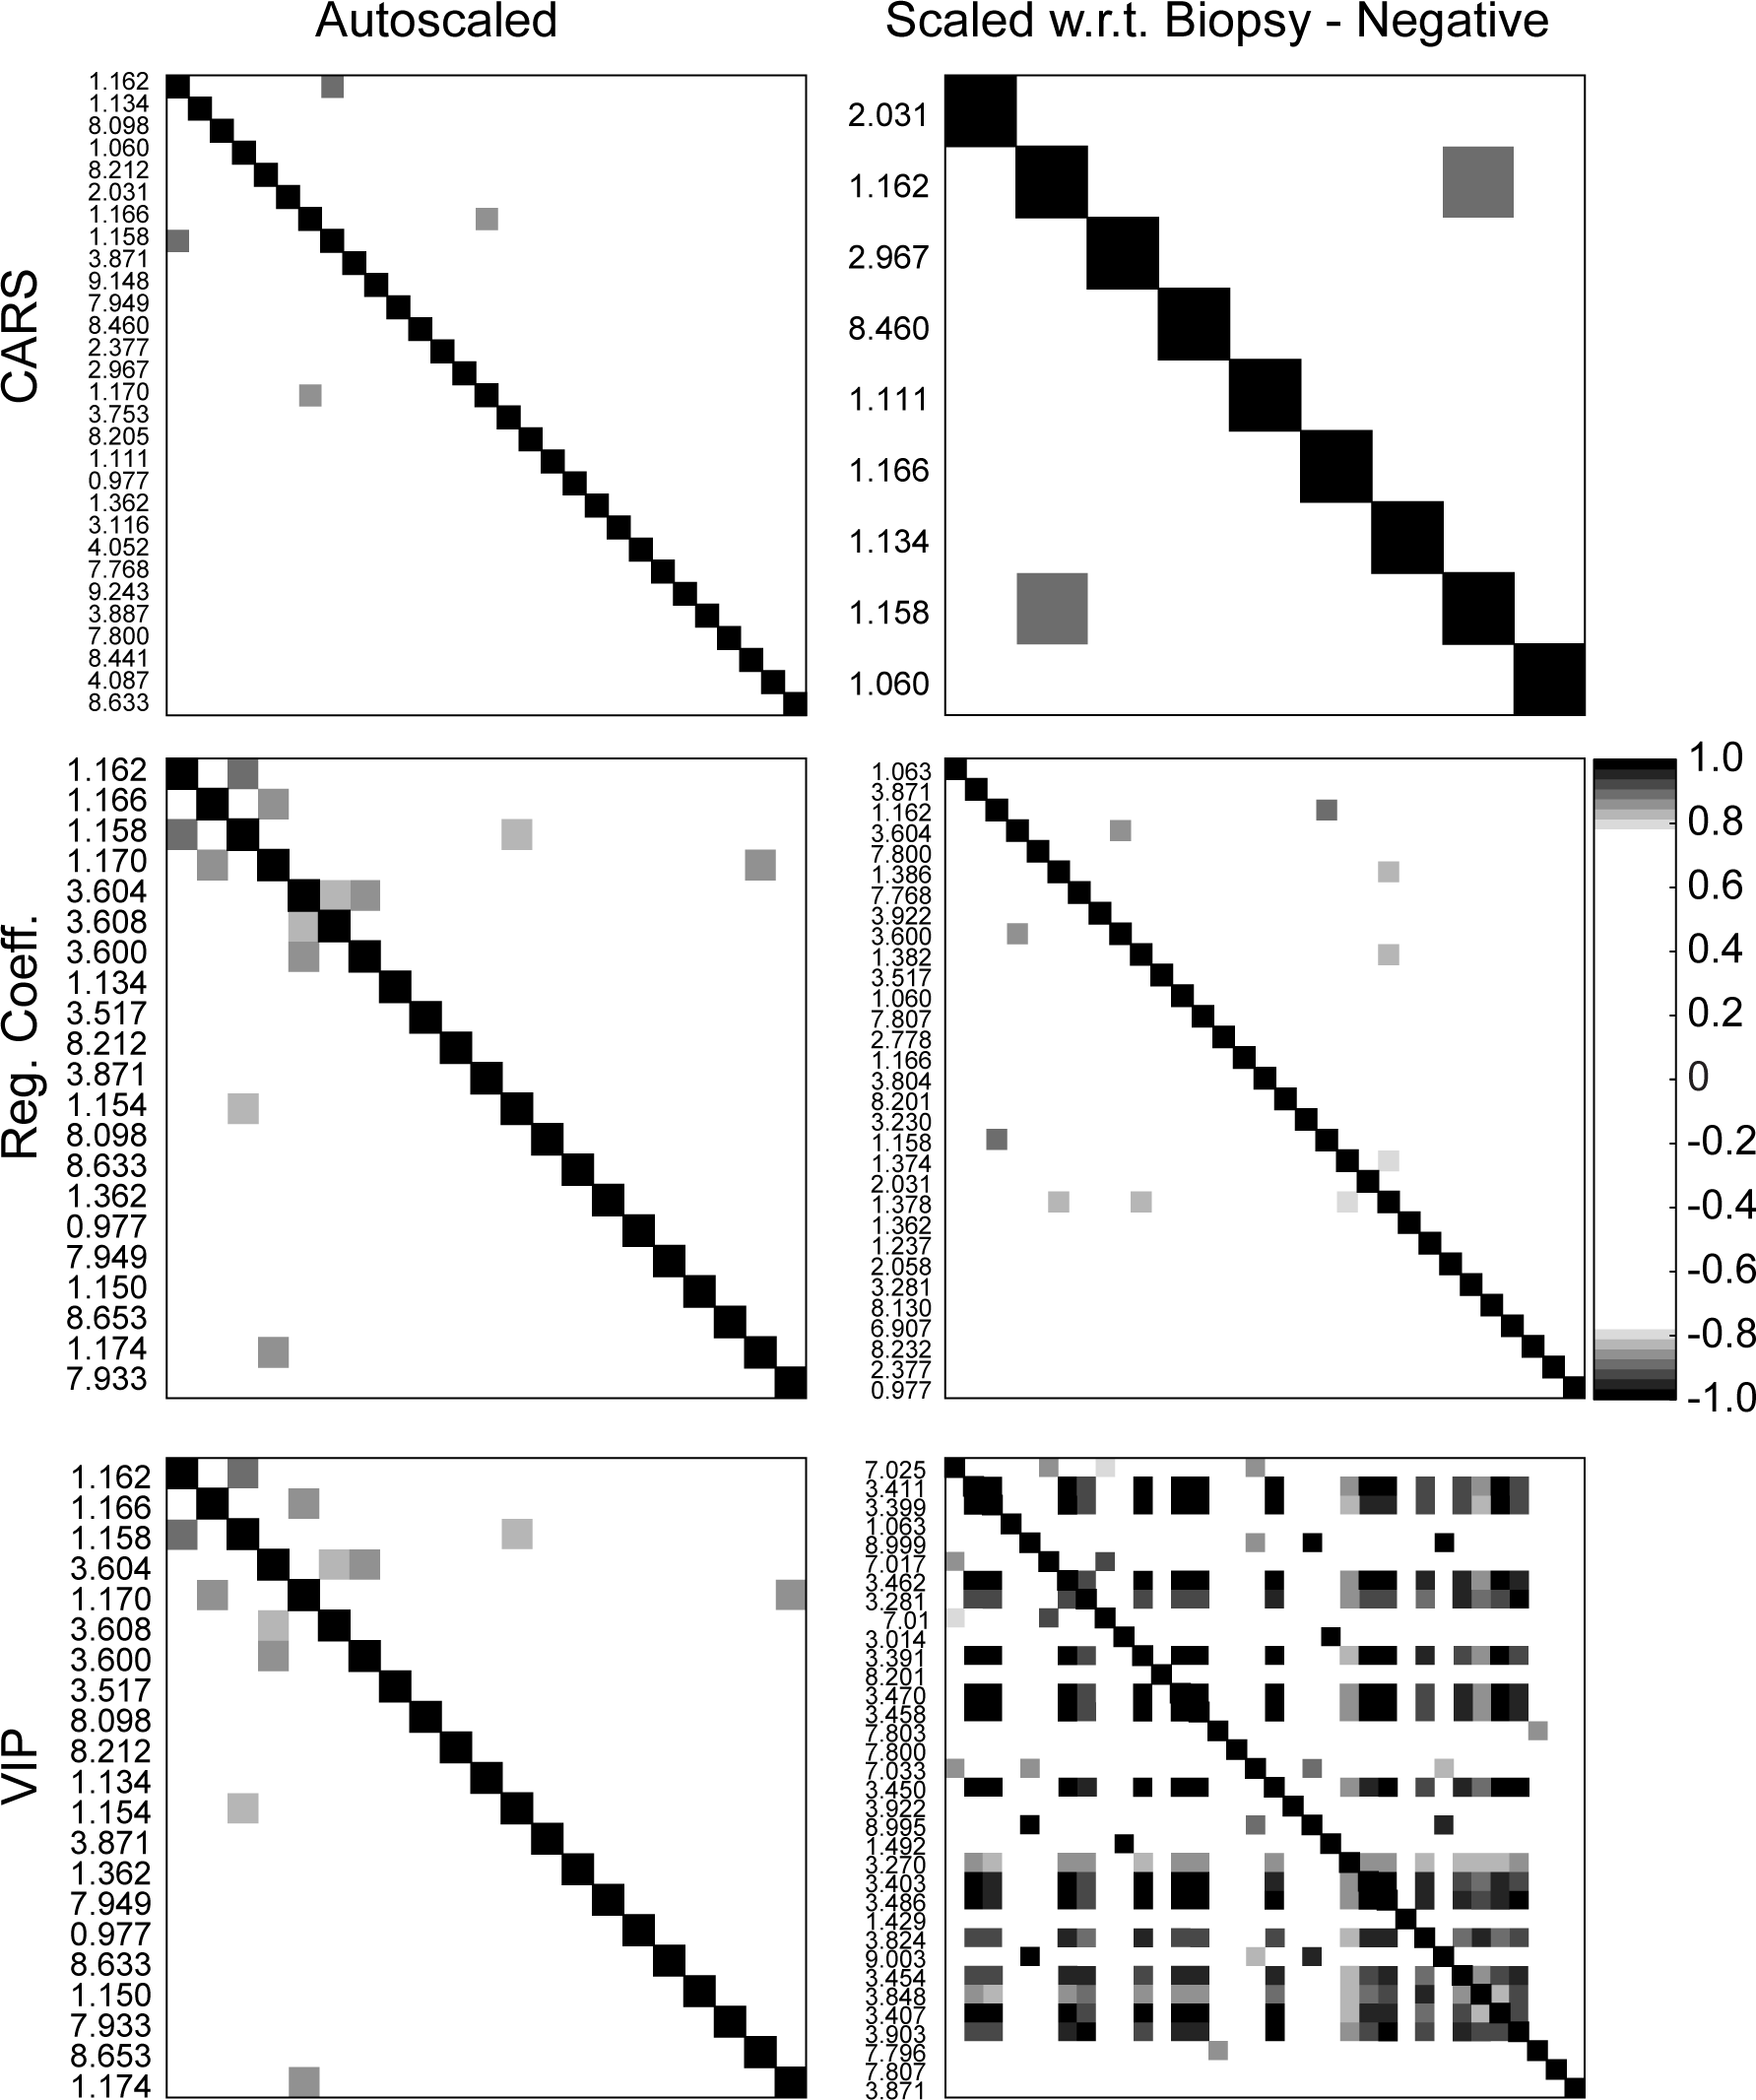
Correlations between variables within each subset for each data normalization/scaling procedure. A Pearson correlation coefficient greater than 0.80 was chosen as a threshold. In the case of the auto-scaled data, the number of correlations with r > 0.80 was 2, 6, and 6 for the CARS, regression coefficient-ranked, and VIP-ranked variable subsets, respectively. In the case of normalization and scaling relative to the biopsy-negative data, the number of correlations with r > 0.80 were 1, 5, and 131 for the CARS, regression coefficient-ranked, and VIP-ranked variable subsets, respectively. CARS, competitive adaptive reweighted sampling; VIP, variable importance to projection.
An optimal biomarker panel for PCa? In total, 6 sets of signals were nominated as potential biomarker panels. From these variables subsets, 82 unique variables out of 145 were identified and 18 were selected in at least 50% of the 6 data sets. Boxplots of a selection of these variables are given in Figure 7, where biopsy-positive responses are varied relative to biopsy-negative. It should be noted that of the 18 common variables, none were found uniquely in the data centered and scaled relative to biopsy-negative samples. This is somewhat unexpected since such data processing would be thought to amplify the differences between the negative and positive cases. This suggests that auto-scaling may be a sufficient data processing protocol. Nevertheless, the top 18 variables were taken as a final variable subset, a so-called “master list” of differential signals (Table S3, Supplemental Data). The modeling procedure was repeated with this master list and the performance characteristics are summarized in Table 5. In the case of the auto-scaled data, the results are intermediate of those obtained for the regression coefficient and CARS model data sets. This is not entirely unexpected since a large proportion of the “master” variables are common to both of these lists. Also encouraging are the results for the biopsy-negative centered and scaled data, which are essentially equivalent to the auto-scaled results. Thus through the analysis of two data processing techniques and three variable selection procedures, a final list of potential biomarkers has been identified which provides stable modeling results independent of the data processing technique.

Representative signal boxplots of selected variables identified in the “master list.” The intensity was integrated at the signal indicated for the biopsy-negative (N) and biopsy-positive (P) spectra after all NMR data were normalized according the PQN procedure. 52 The Wilcoxon P-values were P < 0.0001, P < 0.0001, P = 0.0002, and P = 0.01 for the signals at 1.162, 3.871, 1.134, and 1.362 ppm, respectively. All P-values were corrected for multiple comparisons using the Bonferroni method. PQN, probabilistic quotient normalization; NMR, nuclear magnetic resonance.
Summary of Model Performance Parameters for 2CV-PLS-DA Modeling Based on the “Master List” Variable Subset; 1000 Models Were Generated Using Original Labels and 500 Models Were Generated Using the Permuted Labels. In All Cases, the Test Data Set Contained 96 Randomly Selected Samples (30% of the Total Data Set). All Values Are Reported as Mean ± Standard Deviation. In the Case of Permuted Data, Mean Parameter Values Were First Calculated Over the 20 Models Per Label Permutation Followed by Mean ± Standard Deviation Calculation Over All 500 Permutations. The List of Variables Used in These Models Is Provided in the Supplemental Data.

BNCS, biopsy-negative centered and scaled; AUC, area under the curve.
NMR detection of metabolite markers of PCa has been primarily performed on prostate tissue (ex vivo or in vivo), prostatic secretions, or seminal fluid. From these studies (and others), citrate, choline containing compounds, spermine, myo-inositol, lactate, alanine, omega-6 fatty acids, creatine, and various signal ratios of these metabolites have been reported as potential markers of PCa. 53–68 Interestingly, while each of these metabolites possesses a clearly resolved NMR signal, not a single one was nominated in our analysis of urine supernatant. Urine-based MS has identified several metabolites correlated with PCa; however, these studies were performed on urine sediment. The sediment from urine collected post-digital rectal exam (DRE) is expected to contain prostate cells which may be the source for these signals. Thus, urine supernatants, which may carry a greater fraction of hydrophilic water-soluble metabolites, appear to be exhibiting a different metabolomic profile compared to tissue and urine sediment profiles and may be a useful orthogonal route to PCa detection.
Such a biomarker panel is important in the context of PCa since there remains a population of PCa cases that are clinically challenging to diagnose. In an attempt to address this issue, it is worth re-emphasizing that “normal cases” in this study referred to patients experiencing non-cancerous prostate disorders. It is common for patients possessing such disorders to display elevated levels of PSA, the current clinical standard for PCa diagnosis. This therefore complicates the diagnosis of PCa, and further invasive procedures are required. This study demonstrated the capability of NMR data to distinguish PCa patients from the biopsy-negative population. This suggests that a metabolomic analysis of urine (supernatant and sediment separately), a noninvasive biospecimen, may be further explored for PCa diagnostic potential. In combination with genetic and protein urinary biomarker diagnostics under active investigation, a completely noninvasive clinical test may be on the horizon capable of outperforming PSA levels for PCa identification.
It is encouraging that taken as potential biomarker panels the variable subsets perform exceptionally well in differentiating biopsy-negative versus biopsy-positive profiles. While it is certainly the case that the variable selection protocols utilized here are not completely independent (particularly VIP and regression coefficient ranking), a certain level of confidence is gained by more than one method selecting common variables. It is envisioned that a single variable selection protocol will not dominate, and instead a combination of techniques will generate the most reliable variable nominations. The next challenge becomes signal identification so that the biological significance of these variables may be investigated. Currently, the signal assignments remain unknown (attempted using Chenomx and MetaboID 69 ), pointing to a primary challenge in NMR-based urinary metabolomics. Due to the complexity of the samples, assignment is a significant challenge which is slightly alleviated by utilizing high magnetic field strengths (900 MHz in this case). Unfortunately, the signals identified appear at low concentration (thus poor SNR) resulting in increased difficulty in obtaining suitable multidimensional NMR data, which is essential for confident assignment of the otherwise unknown resonances. Speculation of the most likely chemical functionality is possible. For example, the signal centered at 1.164 ppm most likely arises from small organic acid molecules containing CH2 moieties. Nevertheless, this study demonstrates the utility of NMR-based metabolomics of urine for the nomination of a PCa metabolite biomarker panel.
Experimental
Materials
3-(Trimethylsilyl)propionic-2,2,3,3-d4 acid sodium salt (TSP), D2O, and potassium phosphate (monobasic, dibasic) were obtained from Sigma/Aldrich (Milwaukee, USA) and used as received. All water was of MilliQ purity.
Urine Specimens and Sample Treatment
Urine samples were collected according to a protocol approved by the Institutional Review Board. Briefly, after administering a DRE, urine samples were collected in preservative-free urine collection cups (minimum 10 mL) and centrifuged at 4000 rpm for 15 minutes at 4°C. The resulting supernatants were carefully separated from the pellets and stored separately at −80°C until used for analysis. NMR sample preparation involved aliquoting 450 µL of neat urine supernatant with 50 µL of phosphate buffer (pH 7.2) containing TSP as a chemical shift and concentration reference ([phosphate]f = 100 mM, [TSP]f = 3.7 mM). The sample was subjected to centrifugation for 1 minute to remove insoluble material and transferred to a 5 mm NMR tube. All samples were prepared on the day of measurement.
NMR Spectroscopy
All NMR measurements were performed on a Bruker AVANCE™ 900 MHz (Bruker Biospin, Rheinstetten, Germany) at the Michigan State University (East Lansing) with a TCI cryoprobe operating at a 1H frequency of 889.79 MHz at 298 K. Each 1D 1H spectrum was collected using a 30o flip angle, 128 scans containing 32 K data points, with a spectral width of 16 ppm and recycle delay of 2 seconds. Water suppression by gradient-tailored excitation was utilized.
Data Preparation
The raw Free induction decay were imported in ACD/Labs NMR Processor (ACD/Labs, Toronto, Canada) and were subjected to zero filling to 64 K points and exponential multiplication equivalent to 0.3 Hz line broadening prior to Fourier transformation. Each spectrum was manually phase- and baseline-corrected and referenced to the TSP signal at 0 ppm prior to exporting the data as an ASCII file. All further processing, including statistical analyses, was performed in Matlab R2010b (V 7.11.0.584, The Mathworks, Natick, MA, USA).
Spectra were normalized using the probabilistic quotient normalization method, which has been shown to effectively reduce dilution variation. 52 The reference spectrum for normalization was selected according to a closeness index, 70 a scaled correlation coefficient which identifies the spectrum most similar to all other spectra. In order to reduce data variation arising from small chemical shift variation, spectral alignment was performed using the variable reference alignment method. 71 Prior to statistical modeling, the data set was binned (bin size = 0.005 ppm) in order to reduce the number of variables to a computationally manageable number, and scaled. Two scaling procedures were tested: first, each variable had the mean subtracted and scaled to unit variance (z-scores, auto-scaling 72 ). Second, each variable had the mean of the biopsy-negative samples subtracted followed by division by the standard deviation of the biopsy-negative samples. In the latter scaling method, changes in variable z-score were then relative to the biopsy-negative cases.
Statistical Analyses
Model development
A 2CV-PLS-DA method 46 was used in order to develop models capable of classifying biopsy-negative versus biopsy-positive individuals. Briefly, the full data set was first randomly divided into a calibration and test set. The calibration set is utilized to develop a PLS-DA model according to the traditional single cross-validation (1CV), whereby the data is randomly divided into training and validation sets. The training sets are used to generate PLS-DA models which are used to predict the classifications of the validation set. All prediction errors are stored and the PLS-DA model with optimal prediction performance is selected. After 1CV is performed on the calibration data, an optimal number of PLS components is identified and a final model is generated using the full calibration data set. Finally, this model is used to predict the classifications of the test set and all prediction errors are stored. The entire procedure is repeated several times, generating a series of different, but related, models.
Model performance was measured by three parameters: the number of misclassifications, a prediction error measure (Q 2), and the AUC of an ROC curve. Reference distributions for the null hypothesis of the three parameters were generated by performing 2CV on the full data set after class label permutation. Significant values are expected only when using the correct class labels, which are directly comparable to the null hypothesis distributions using the permutation strategy.
In this work, null hypothesis distributions for the three performance parameters were generated by performing 500 class label permutations, with 20 models developed for each permutation (i.e., 2CV was performed 20 times for each permutation). For each permutation, 70% of the samples were randomly selected as the calibration set and the average value of the number of misclassifications, Q 2, and AUC was calculated over the 20 models. The 2CV procedure was then repeated 1000 times using the correct class labels (each model taking a different random selection of the calibration set), resulting in a collection of 1000 different, but related models. Both the distribution over all 1000 models and mean ± standard deviation of the three performance parameters are reported.
Variable selection
Three methods were explored for their ability to select variables strongly contributing to the PLS-DA models developed. The first method involved ranking variables according to their absolute regression coefficient value calculated for each PLS-DA model. The frequency with which a variable appeared in the top 2% ranking was calculated across the models. Variables that appeared in the top 2% in at least 50% of the models were considered important. The second method involved the calculation of the VIP score of each variable for all models calculated. 49 The variables were ranked according to their VIP score, and a frequency was calculated in the same fashion as for the regression coefficient analysis. The final method involved a more rigorous calculation of variable importance, known as CARS, described by Li and coworkers. 48 Briefly, in this method a series of PLS-DA models, built upon a data subset selected by Monte Carlo sampling of the calibration data, are generated and variables are exponentially filtered and subjected to competitive weighting according to their ability to affect model performance. A subset of variables is finally realized after selecting the model with best performance characteristics (lowest prediction error). The CARS method was applied to each model developed using 100 Monte Carlo samplings, and variables that were selected in at least 50% of the models were considered important.
Logistic regression analysis was performed using the selected variables with ROC curves generated and AUC values calculated.
Univariate statistics were performed on the selected variables as an alternative measure of variable importance. The Wilcoxon U-test was used to compare the normalized intensities of the selected variables, and all P-values were subjected to the Bonferroni correction for multiple comparisons.
Footnotes
Declaration of Conflicting Interests
The author(s) declared no potential conflicts of interest with respect to the research, authorship, and/or publication of this article.
Funding
The author(s) disclosed receipt of the following financial support for the research, authorship, and/or publication of this article: N.M., W.G., A.R., and the NMR studies were supported by funds from the University of Michigan (to A.R.).
Supplemental Material
References
Supplementary Material
Please find the following supplemental material available below.
For Open Access articles published under a Creative Commons License, all supplemental material carries the same license as the article it is associated with.
For non-Open Access articles published, all supplemental material carries a non-exclusive license, and permission requests for re-use of supplemental material or any part of supplemental material shall be sent directly to the copyright owner as specified in the copyright notice associated with the article.