
Abstract
Background:
Prediabetes often remains undiagnosed until it progresses to type 2 diabetes mellitus (T2DM), particularly among individuals with obesity or a family history of diabetes. Conventional tests, including fasting plasma glucose, hemoglobin A1c, and the oral glucose tolerance test, provide only static snapshots of glycemia and may fail to capture variability and postprandial excursions. Continuous glucose monitoring (CGM) offers dynamic insight into glucose regulation and may complement traditional diagnostic tools.
Methods:
This systematic review and meta-analysis evaluated differences in CGM-derived metrics between individuals with prediabetes and those with normoglycemia. PubMed, EMBASE, and CENTRAL were searched from inception to September 3, 2025 (PROSPERO: CRD42024608658). The primary outcome was the mean amplitude of glycemic excursions (MAGE); secondary outcomes included time above range, 24-hour mean glucose, coefficient of variation, and time in range. Sixteen studies met the inclusion criteria, and ten were included in the quantitative synthesis (n = 1657).
Results:
Prediabetes was consistently associated with higher CGM values compared with normoglycemia: MAGE (mean difference [MD] = 9.41 mg/dL, 95% confidence interval [CI]: 4.31, 15.31), TAR% (MD = 5.68%, 95% CI: 1.04, 10.32), and 24-hour mean glucose (MD = 7.91 mg/dL, CI: 6.27, 9.55).
Conclusions:
These results provide the first quantitative evidence that CGM can discriminate between prediabetes and normoglycemia, supporting its potential as a complementary tool for refined metabolic risk assessment. Further prospective studies are needed to determine its predictive value for progression to T2DM.
Keywords
Introduction
Type 2 diabetes mellitus (T2DM) is a global health problem, affecting more than 462 million people worldwide, and is projected to increase to 643 million. 1 Prediabetes, an intermediate stage between normoglycemia and T2DM, is defined as elevated blood glucose levels below the diagnostic threshold for diabetes and represents a critical opportunity for intervention to prevent disease progression. 2 However, it frequently remains undiagnosed, as approximately one in three adults in the United States has prediabetes, and more than 80% are unaware of their condition. 3 This is mainly due to the asymptomatic nature of prediabetes and the limitations of traditional glucose measurements.
Standard methods, such as fasting plasma glucose (FPG), hemoglobin A1c (HbA1c), and the oral glucose tolerance test (OGTT) do not adequately capture glucose fluctuations. HbA1c levels can be affected by factors, such as red blood cell turnover, anemia, and pregnancy, 4 while FPG does not account for postprandial glucose changes. In addition, the OGTT can be stressful and time-consuming, and may miss peak glucose levels. 5 These limitations may contribute to the underdiagnosis of prediabetes and delay intervention, thereby increasing the risk of developing diabetes and its associated complications, including kidney failure, cardiovascular disease, neuropathy, and vision loss. 2
Continuous glucose monitoring (CGM) offers a more comprehensive approach by providing real-time, dynamic insight into glucose variability. Since 2012, the American Diabetes Association (ADA) has recommended CGM for individuals with type 1 diabetes mellitus (T1DM), and more recently, its use has been extended to people with T2DM, including those not treated with insulin. 6 These recommendations currently apply to individuals with diabetes, in whom CGM has demonstrated benefits in reducing hypoglycemic events and improving glycemic control. 7
Emerging evidence suggests that CGM metrics, such as 24-hour mean glucose and mean amplitude of glycemic excursions (MAGE), also differ between individuals with prediabetes and those with normoglycemia. 8 By continuously tracking glucose variability and postprandial responses, CGM provides detailed information on glycemic regulation that complements conventional diagnostic methods. 9 Despite growing interest in CGM beyond diabetes management, no previous meta-analysis has quantitatively synthesized evidence comparing CGM metrics between prediabetes and normoglycemia. Understanding these differences could help bridge the gap between physiological glucose dynamics and conventional clinical screening.
This study aimed to systematically evaluate whether CGM metrics differ between individuals with prediabetes and those with normoglycemia, thereby providing evidence to support the potential role of CGM in individuals without diabetes.
Methods
Protocol
This systematic review and meta-analysis adhered to the Cochrane Handbook 10 and the 2020 PRISMA (Preferred Reporting Items for Systematic reviews and Meta-Analyses) guidelines 11 (Supplementary Table S1). The protocol was registered in PROSPERO (CRD42024608658). Initially designed to assess dysglycemia, the scope was refined before data extraction to focus specifically on comparisons between prediabetes and normoglycemia, thereby reducing heterogeneity. Predefined outcomes included MAGE, time above range (TAR), 24-hour mean glucose, time in range (TIR), and coefficient of variation (CV). In this study, TIR refers to the percentage of time spent between 70 and 140 mg/dL, a range commonly applied in populations without diabetes, and often referred to as time in tight range (TITR) in the literature. The study was conducted within the Systems Education model, coordinated by the Centre for Translational Medicine at Semmelweis University. 12
Eligibility Criteria
Observational studies of individuals without diabetes were eligible if CGM metrics were reported separately for prediabetes (HbA1c = 5.7%-6.5%, fasting glucose 100-125 mg/dL, or 2-hour OGTT = 140-199 mg/dL) and normoglycemia. Studies, including diabetes, severe comorbidities, pregnancy, or glucose-lowering therapy were excluded. Only full-text original articles were included.
Search Strategy, Data Extraction, and Management
PubMed, EMBASE, and CENTRAL were searched from inception to September 3, 2025, without language restrictions. Full strategies are provided in Supplementary Document S1. Additional studies were identified through reference screening and citation chasing. 13 After duplicate removal, four reviewers screened titles, abstracts, and full texts; discrepancies were resolved by consensus, with a κ value greater than 0.75 at all stages.
Records were managed in EndNote 21 and Microsoft Excel.14,15 Extracted data included study characteristics, demographics, and CGM metrics (MAGE, TAR, TIR, CV, and mean glucose).
When impaired fasting glucose (IFG) and impaired glucose tolerance (IGT) were reported separately, they were combined as “prediabetes.” Missing standard deviations (SDs) were calculated from SEs, CIs, or P values; medians were converted to mean using the methods described by Luo et al 16 and Shi et al. 17 Abnormal CGM thresholds were defined from prior studies.18-20
Risk of Bias Assessment
The risk of bias was assessed using the ROBINS-I 21 across seven domains; any disagreements were resolved through discussion.
Statistical Analysis
Effect sizes were expressed as mean differences (MDs) with 95% confidence intervals (CIs). For each study, sample size, mean, and SD were extracted or derived separately for prediabetes and normoglycemia groups, and MDs were calculated as the difference between group means. Pooled estimates were generated using inverse-variance random-effects models when at least two studies contributed data. Between-study variance (τ2) was estimated using the restricted maximum-likelihood method, and heterogeneity was quantified with I2. Confidence intervals for τ2 were obtained using the Q-profile approach. Subgroup analyses were performed by device type, ethnicity, and monitoring duration, and sensitivity analyses excluded high-risk studies. Additional subset analyses were conducted, including only studies published from 2019 onward. All analyses were performed in R (v4.3) using the meta and dmetar packages.22-25
Results
Search and Selection
We identified a total of 21 764 studies. After duplicate removal and eligibility screening, 12 studies remained. An additional four studies were included after citation tracking. In total, 16 studies were selected for the systematic review26,27 (Table S4), with ten of these studies included in the meta-analysis. The study selection process is presented in Figure 1.
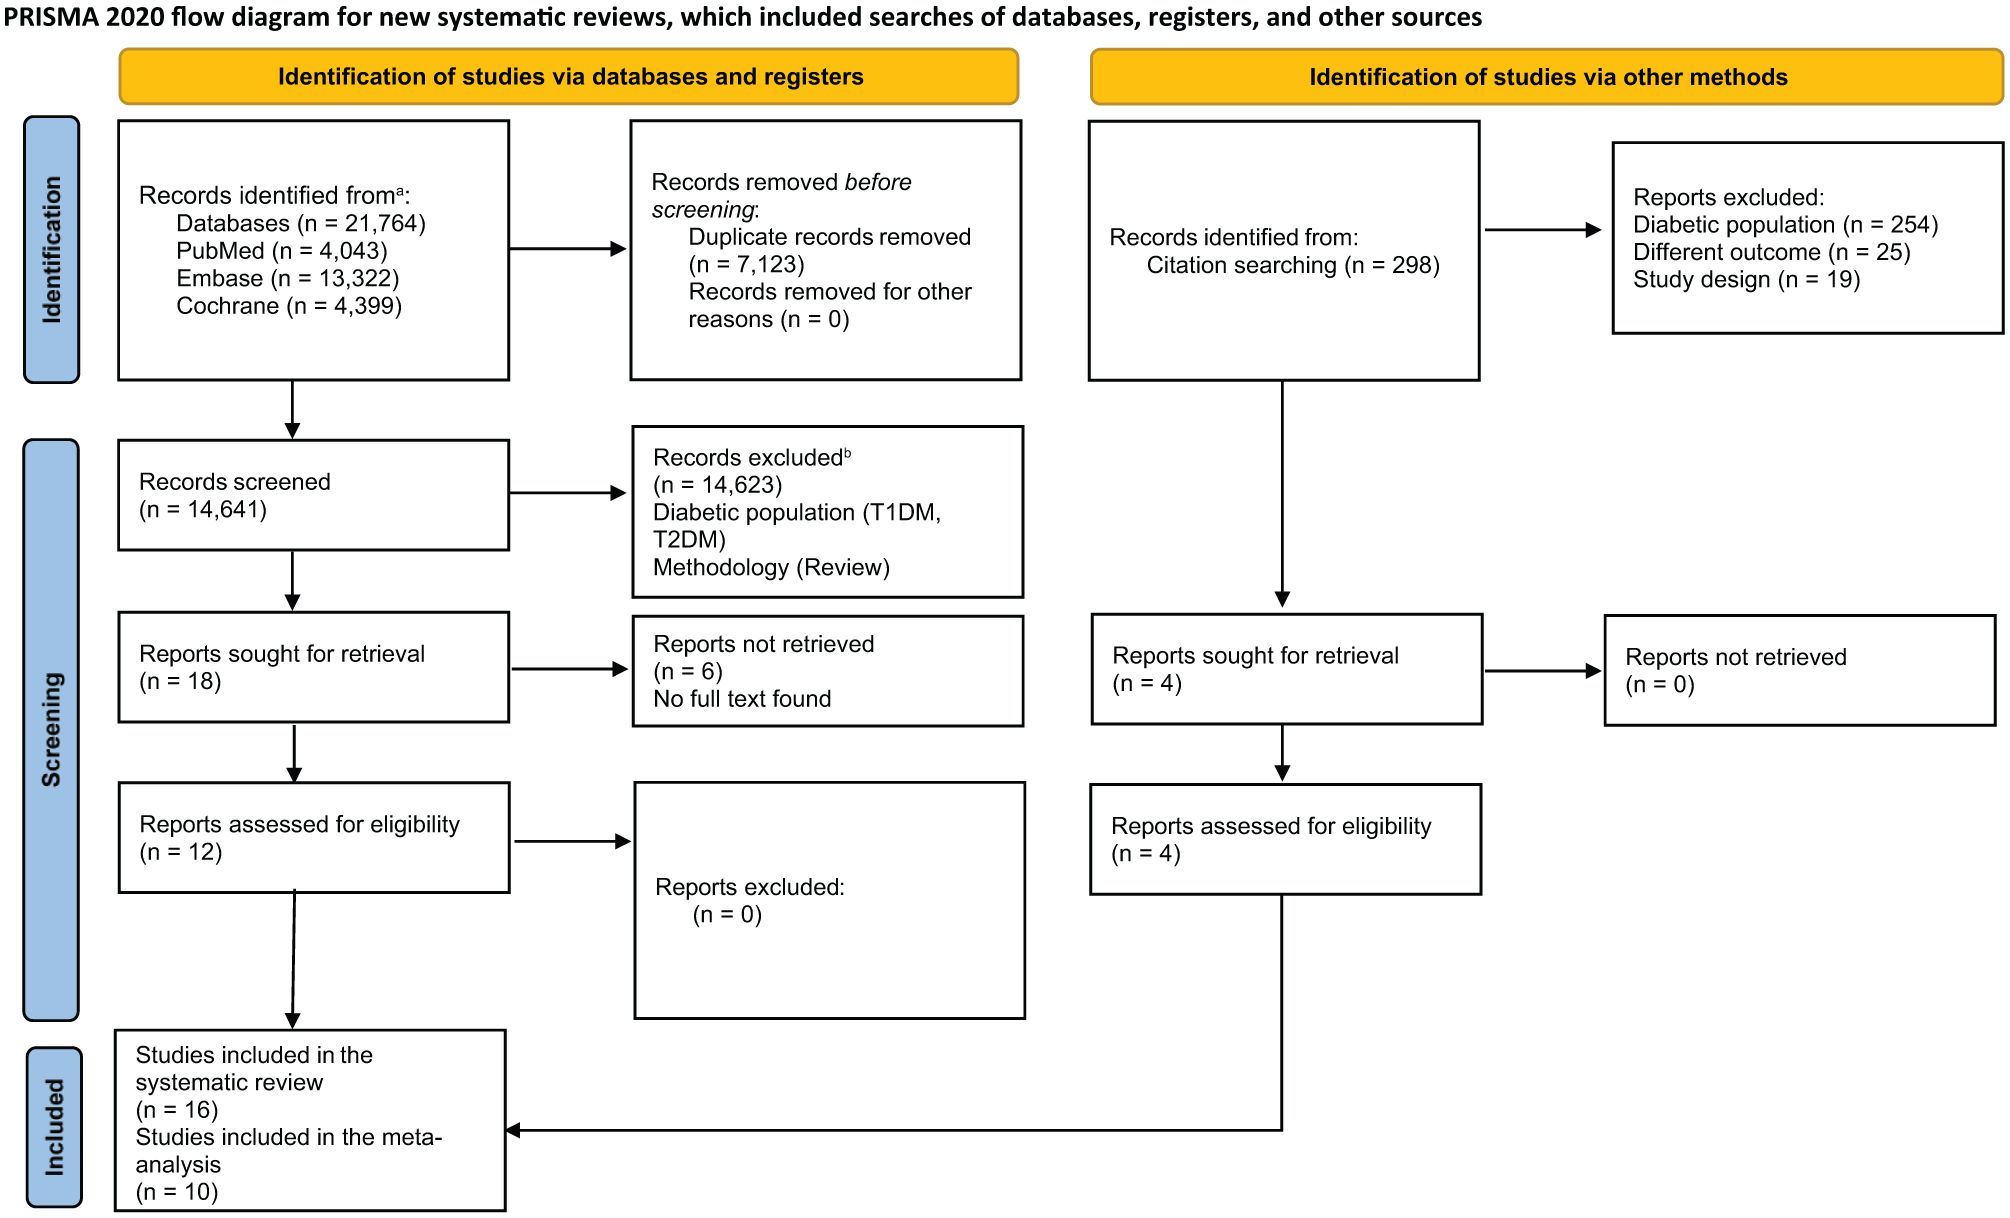
PRISMA flowchart of the article selection process.
Study Characteristics
Sixteen studies (2010-2024) were included, totaling 1657 participants in the quantitative synthesis. Most used prospective cross-sectional designs with CGM over defined monitoring periods were conducted in the United States, Japan, Spain, China, Greece, and Sri Lanka. All studies used ADA/European Association for the Study of Diabetes-approved devices (Abbott Freestyle Libre, Dexcom G6/G7, Medtronic Guardian) (Table 1).
Characteristics of the Included Studies and Participants.
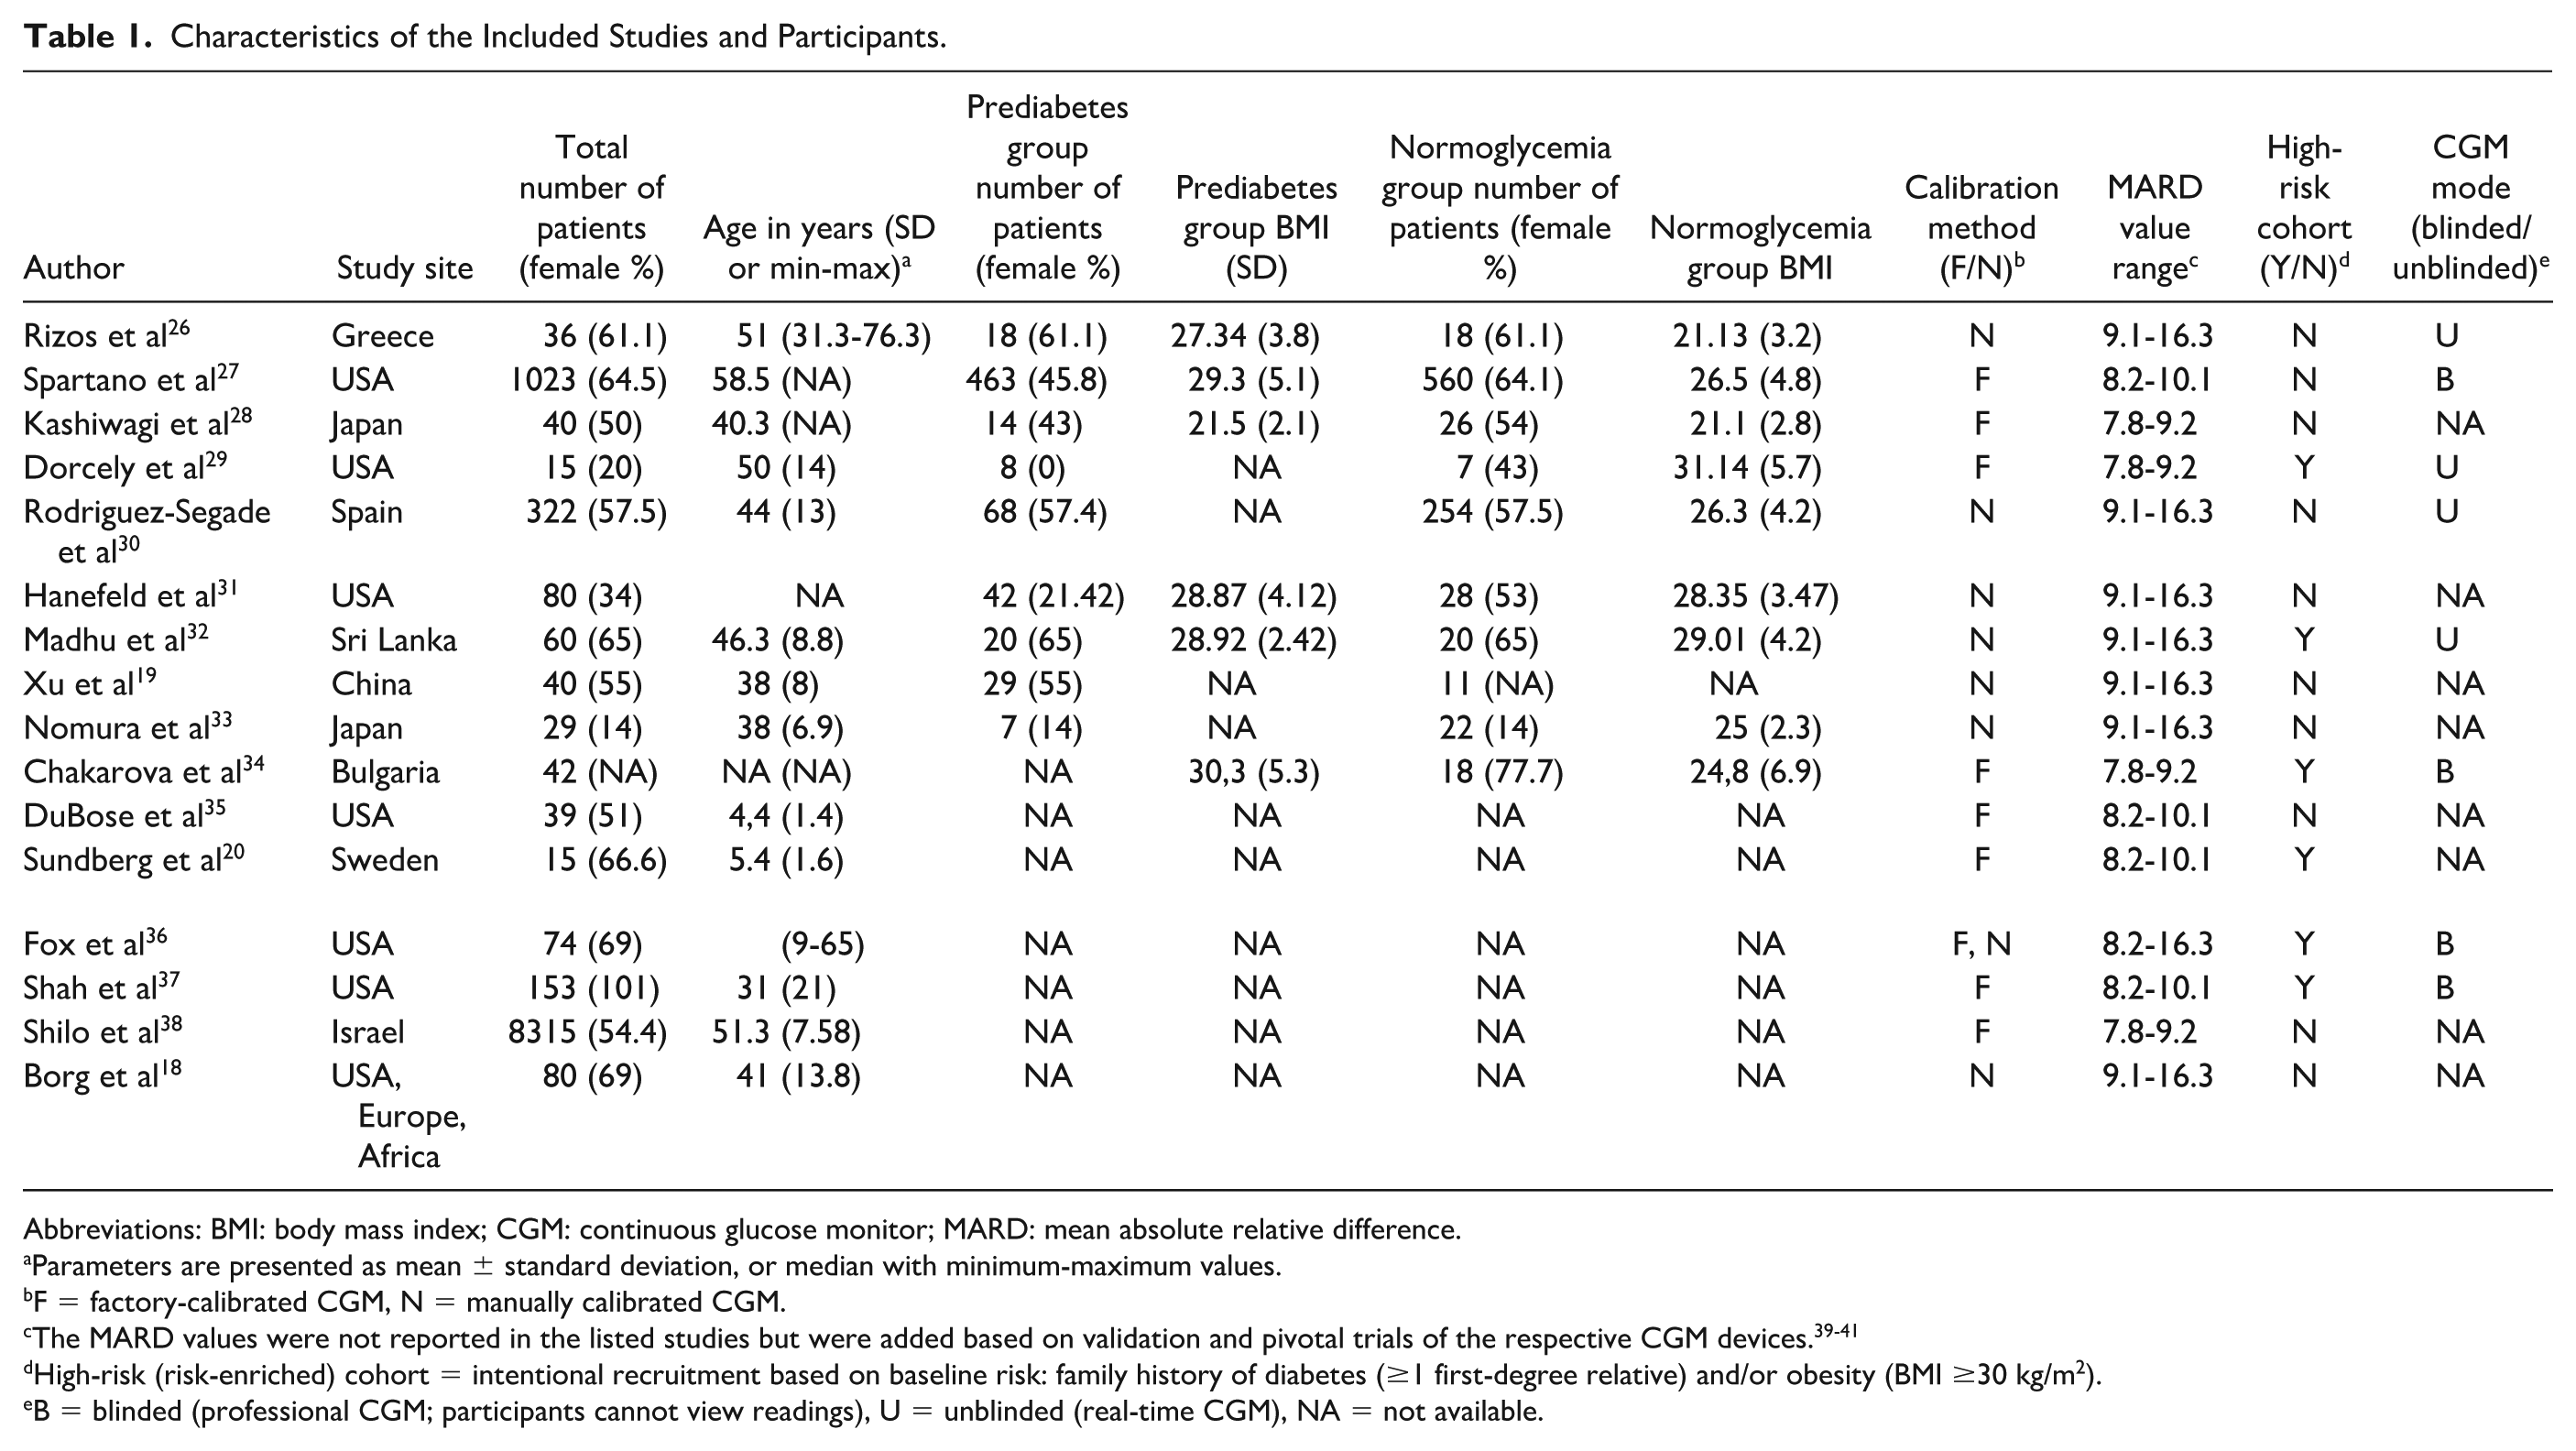
Abbreviations: BMI: body mass index; CGM: continuous glucose monitor; MARD: mean absolute relative difference.
Parameters are presented as mean ± standard deviation, or median with minimum-maximum values.
F = factory-calibrated CGM, N = manually calibrated CGM.
The MARD values were not reported in the listed studies but were added based on validation and pivotal trials of the respective CGM devices.39-41
High-risk (risk-enriched) cohort = intentional recruitment based on baseline risk: family history of diabetes (≥1 first-degree relative) and/or obesity (BMI ≥30 kg/m2).
B = blinded (professional CGM; participants cannot view readings), U = unblinded (real-time CGM), NA = not available.
Mage
Eight studies (n = 602) showed significantly higher MAGE in prediabetes compared with normoglycemia, with a pooled MD of 9.81 mg/dL (95% CI: 4.31, 15.31) (Figure 2a). Although heterogeneity was high (I2 = 77%), all studies reported elevated MAGE in prediabetes.
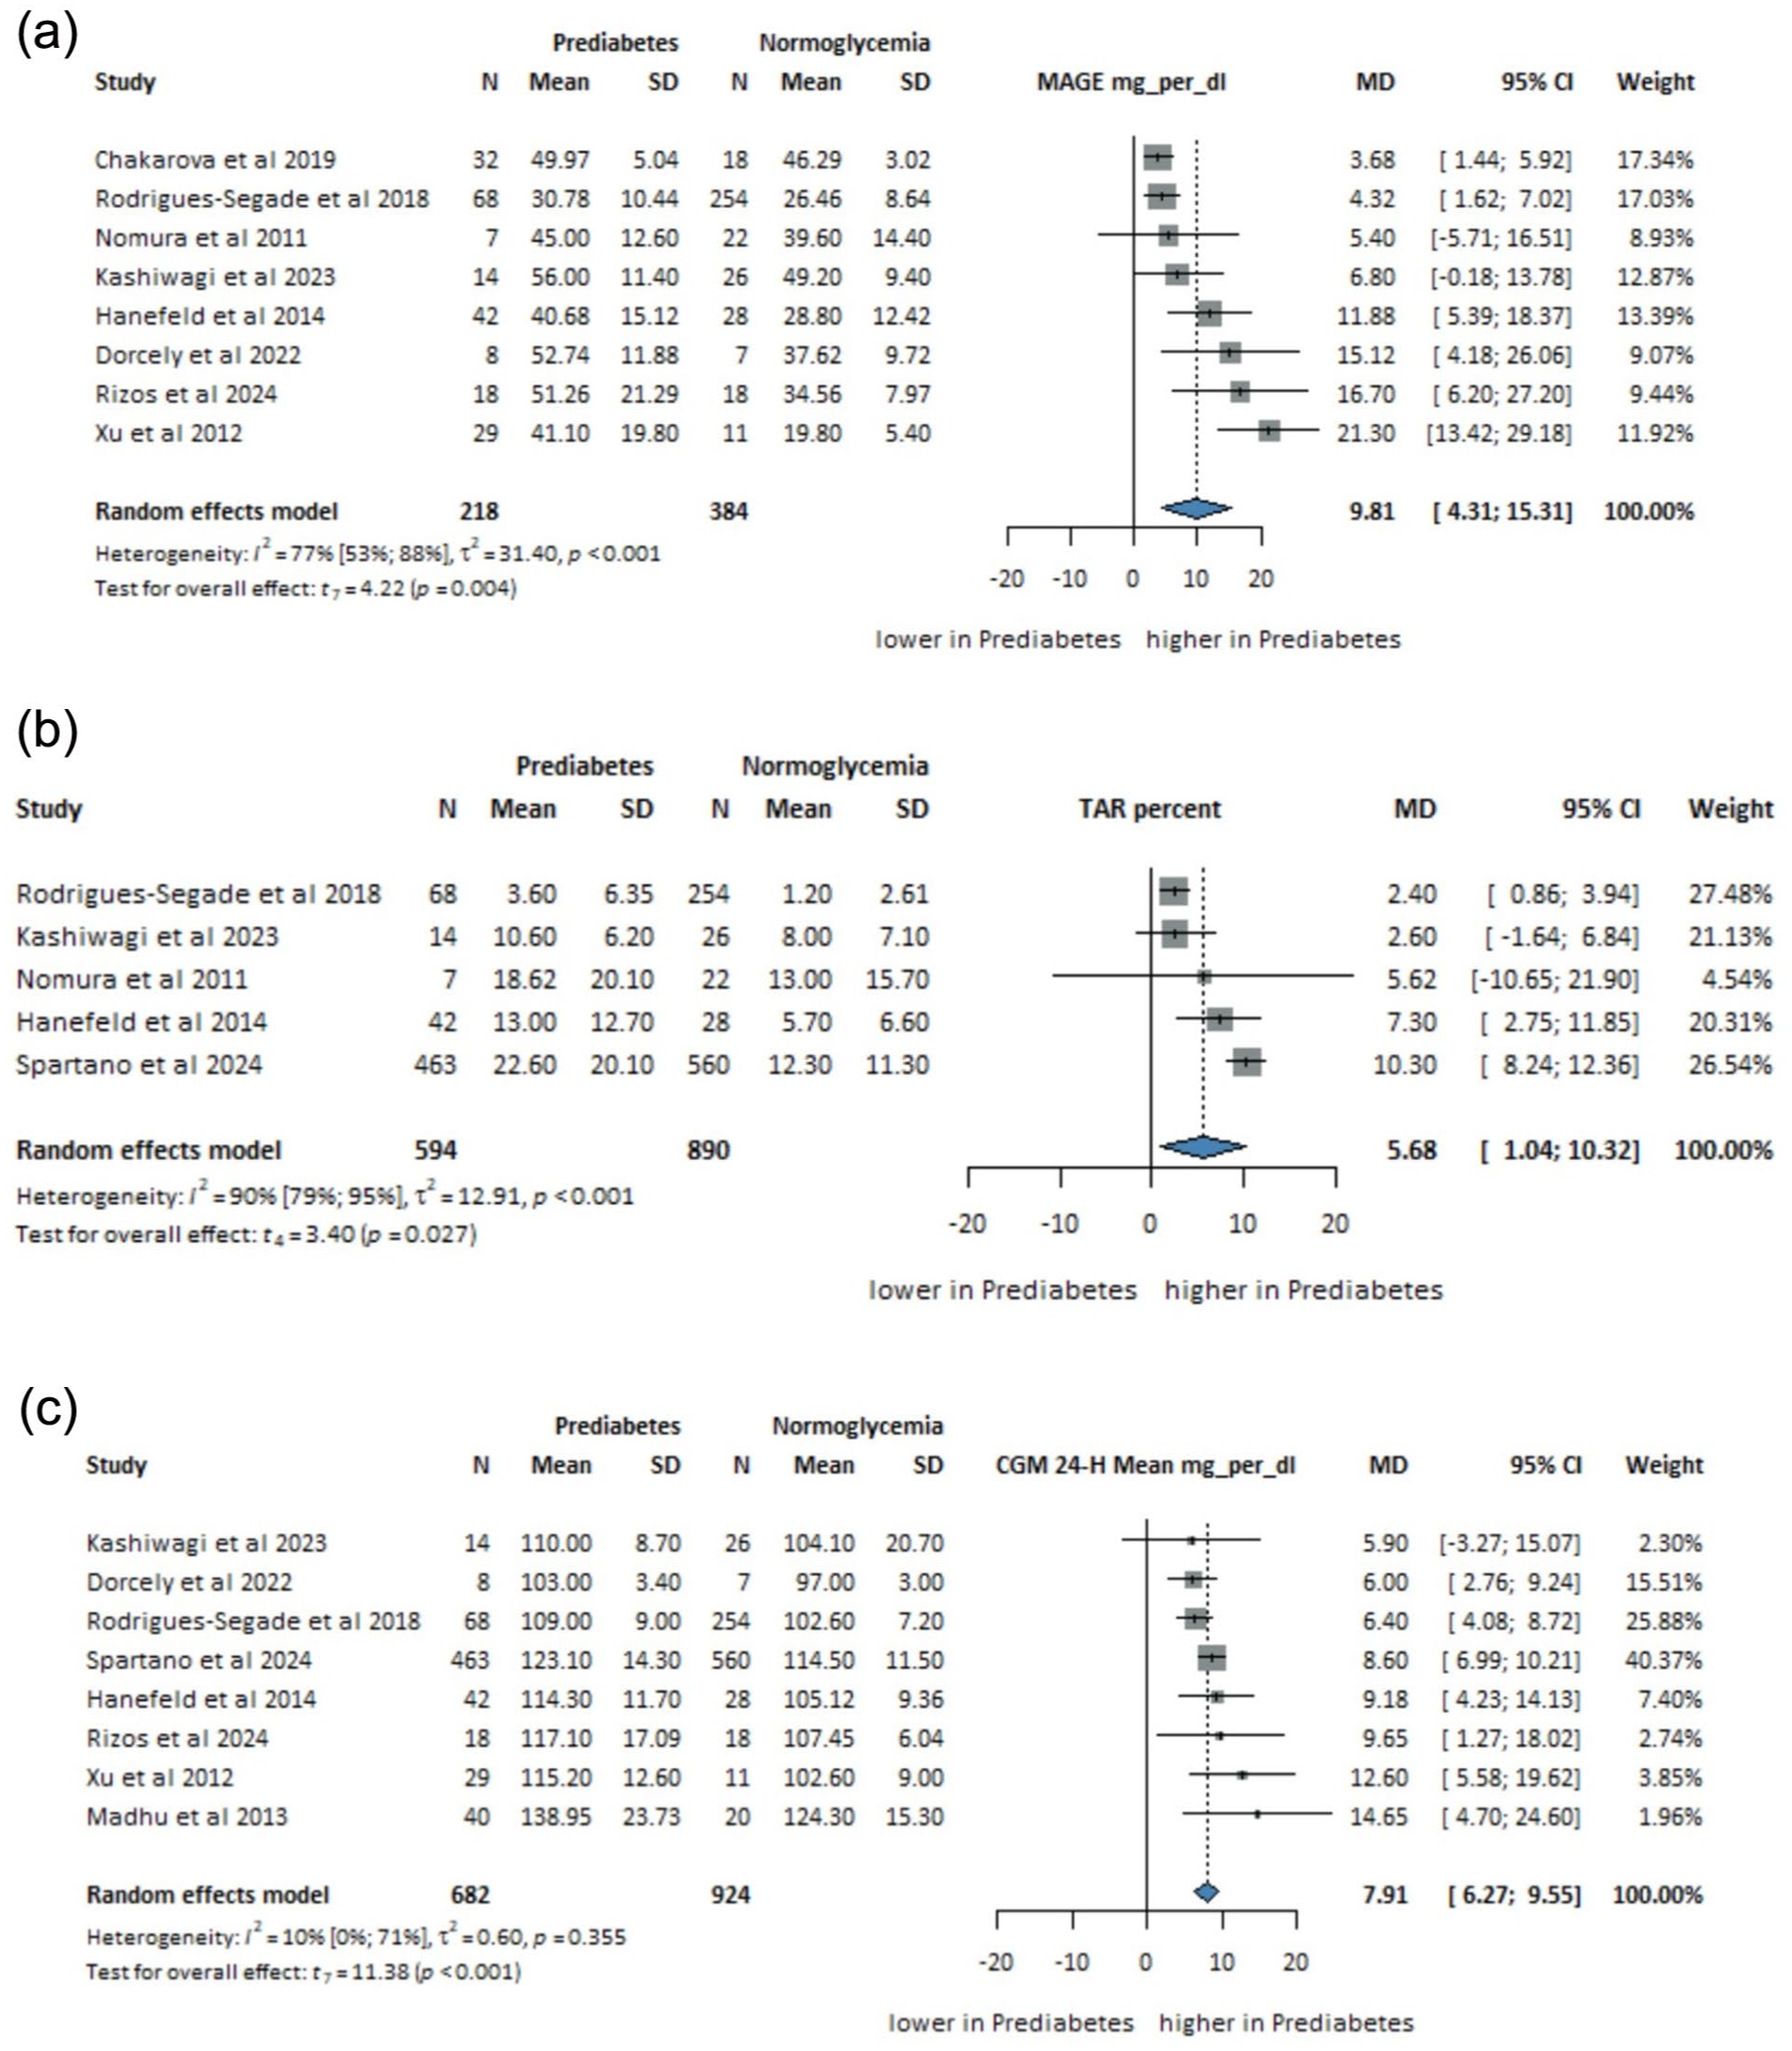
Mean difference in (a) MAGE (mg/dL, n = 602), (b) TAR (%, n = 1484), and (c) 24-hour CGM mean (mg/dL, n = 1606) between individuals with prediabetes and normoglycemia.
TAR (>140 mg/dL)
Five studies (n= 1484) demonstrated higher TAR in prediabetes (MD = 5.68%, 95% CI: 1.04, 10.32; I2 = 90%) (Figure 2b), indicating longer exposure to hyperglycemia.
Twenty-Four-Hour CGM Mean
Eight studies (n = 1606) showed significantly higher 24-hour mean glucose levels in prediabetes (MD = 7.91 mg/dL, 95% CI: 6.27-9.55; I2 = 10%) (Figure 2c).
CV%
Six studies (n = 557) revealed higher glycemic variability in prediabetes, with a pooled MD in CV of 1.54% (95% CI: 0.67, 2.41; I2 = 0%) (Figure 3a).
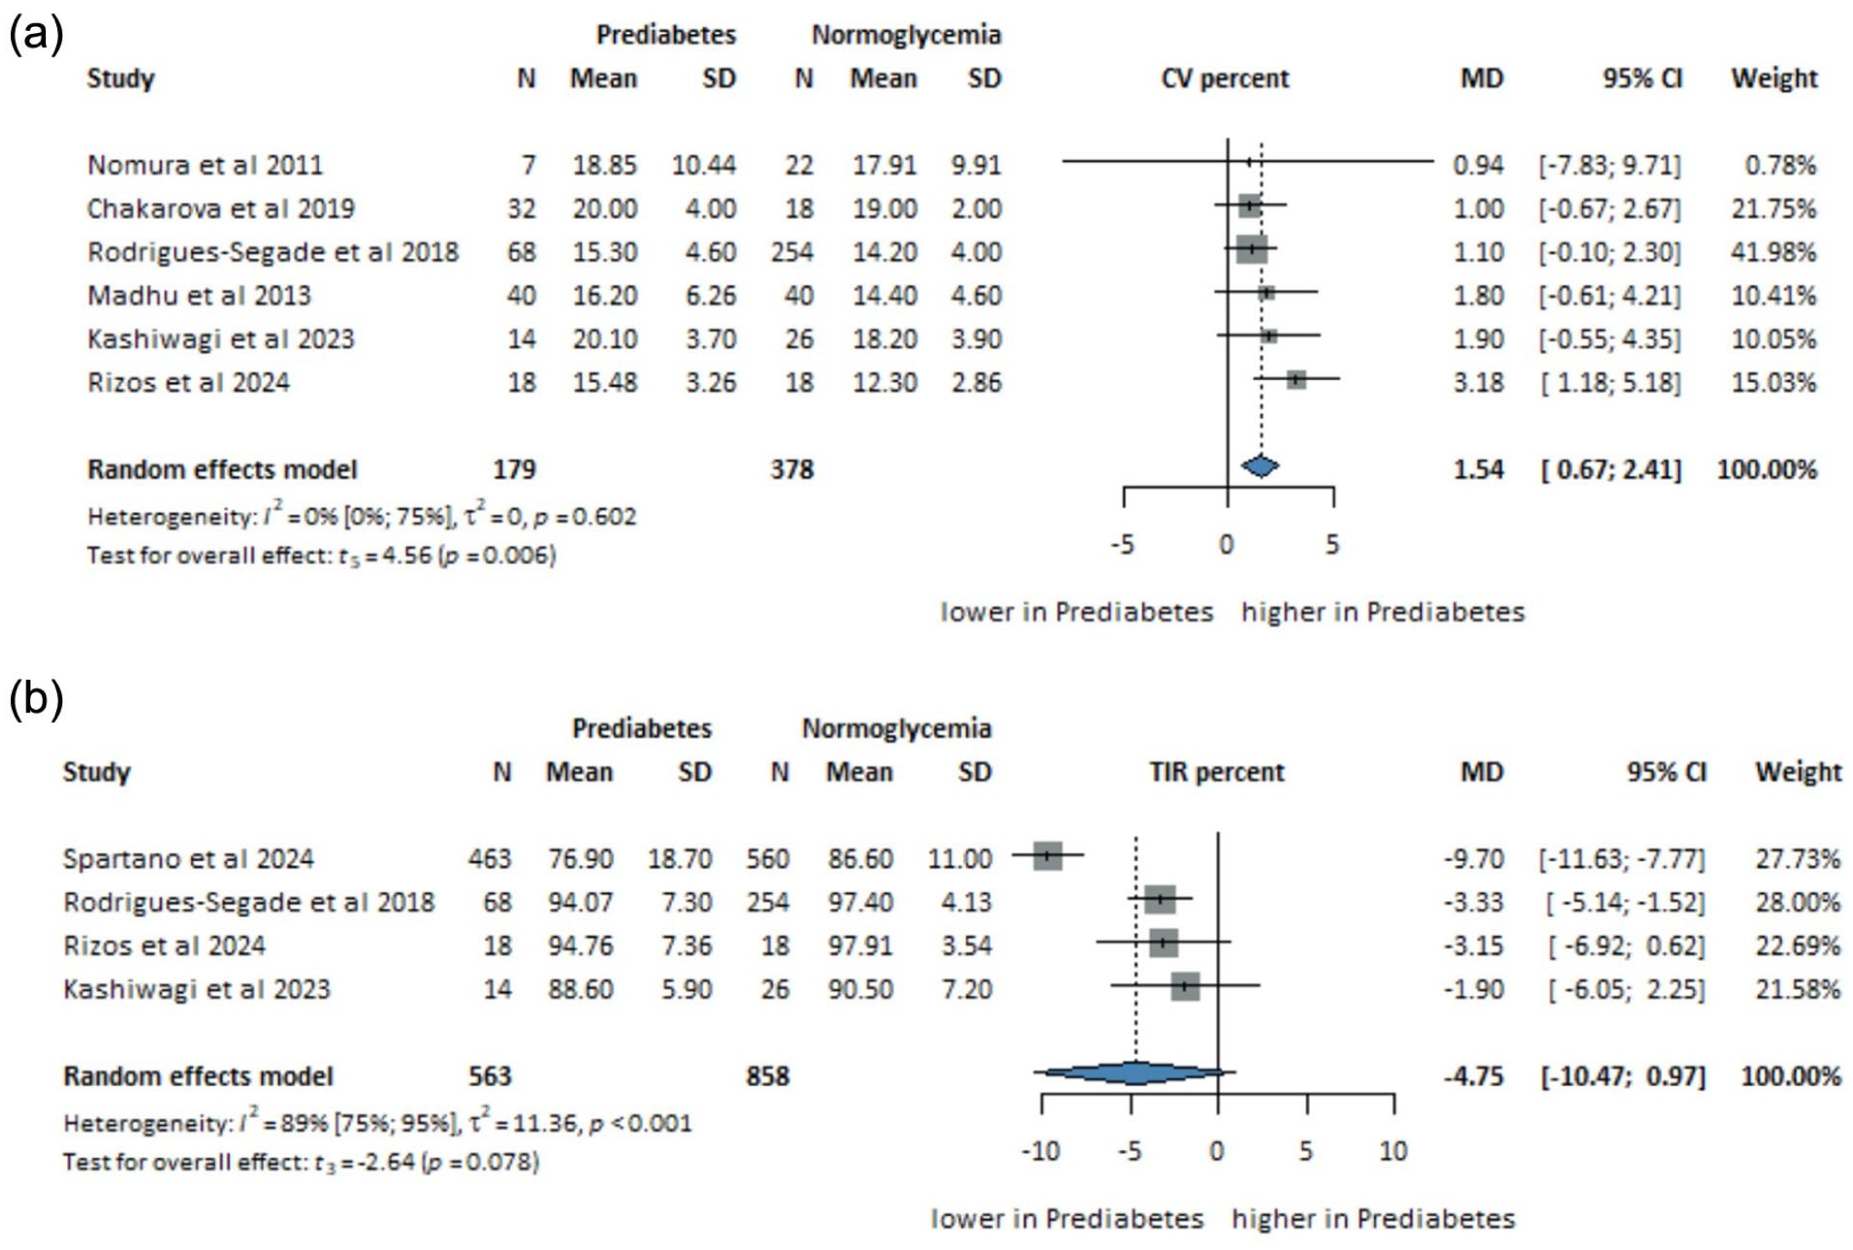
Mean difference in (a) CV (%, n = 557) and (b) TIR (%, n = 1421) between individuals with prediabetes and normoglycemia.
TIR (70-140 mg/dL)
Four studies (n = 1421) indicated a non-significant trend toward lower TIR in prediabetes (MD = −4.75%, 95% CI: –10.47, 0.97; I2 = 89%) (Figure 3b).
Risk of Bias Assessment
Using ROBINS-I, 22 three studies were rated as low risk, six as moderate, and one as serious, primarily due to participant selection and intervention classification. Excluding this single high-risk study 29 in sensitivity analysis did not meaningfully alter the pooled estimates, indicating robustness of the results. Variability in CGM duration (3-14 days) may also have contributed to between-study differences (Table S2).
Publication Bias and Heterogeneity
Publication bias could not be assessed because fewer than ten studies were included. Heterogeneity was moderate to high in several studies. To explore potential sources, we conducted subgroup analyses (Table S5, Figures S6-S10).
A significant difference between subgroups accompanied by a substantial reduction in heterogeneity would indicate a true subgroup effect; however, our analyses did not confirm such differences. For MAGE, neither device type (P = .816; residual heterogeneity I2 = 79%, τ2 = 37.75; Figure S7) nor race (P = .660; residual I2 = 74%, τ2 = 34.34; Figure S8) explained the observed heterogeneity. In contrast, monitoring duration showed a significant subgroup effect: studies with <7 days of wear had a significantly larger pooled MD (14.01 mg/dL) than those with ≥7 days (5.80 mg/dL: P = .034; residual I2 = 51%, τ2 = 9.35; Figure S6).
For 24-hour mean glucose, neither monitoring duration (P = .628; residual I2 = 22%, τ2 = 1.77) nor device type (P= .456; residual I2 = 16%, τ2 = 3.01) materially altered pooled effects (factory-calibrated MD = 6.64 [95% CI: 2.35, 10.93], manually calibrated MD = 8.66 [3.49 13.83], other MD = 8.60 [6.99, 10.21]; Figures S9 and S10).
Leave-one-out analyses (Figures S1-S5) showed that blinded CGM studies contributed most to heterogeneity. Excluding Spartano et al 27 reduced heterogeneity in TIR without affecting the direction or magnitude of the pooled effect, suggesting that CGM mode (blinded vs unblinded) influences variability through behavioral responses to real-time feedback (Figure S4). However, this pattern was not replicated in another blinded study 34 (Figures S11-S13).
Because standalone CGM systems were approved after 2018, additional subset analyses were performed, restricting the meta-analyses to studies published from 2019 onward (Figures S14-S17). Pooled analyses were feasible for MAGE, 24-hour mean glucose, CV, and TIR. The pooled effect for 24-hour mean glucose remained statistically significant and directionally consistent with the primary analysis (MD = 7.84 mg/dL; 95% CI: 5.51, 10.17), with minimal heterogeneity. For MAGE, CV, and TIR, effect directions were consistent with the main analyses, although statistical significance was attenuated, likely due to reduced sample size and consequent loss of statistical power in the restricted data set.
Sensitivity analyses excluding high-risk studies resulted in minor changes in pooled estimates and heterogeneity (Figures S11-S13). The certainty of evidence, assessed using the GRADE approach, is summarized in Table S3.
Discussion
Key Findings and Interpretation
This meta-analysis identified consistent differences in CGM metrics between individuals with prediabetes and those with normoglycemia. It provides the first quantitative synthesis, showing that dynamic CGM measures (MAGE, TAR, CV, and mean glucose) differ significantly between groups, offering additional insights into glucose regulation across the prediabetes spectrum. These findings support the integration of CGM metrics into refined metabolic risk assessment frameworks and motivate further prospective validation in populations without diabetes.
Clinical Relevance and Risk Stratification
Prediabetes often remains unrecognized, 42 yet timely identification is crucial since lifestyle modification can prevent up to 58% of diabetes cases. 43 Earlier recognition of glycemic instability reduces healthcare burden and improves long-term outcomes.44,45 Our findings confirm that individuals with prediabetes have significantly higher glycemic variability and mean glucose than those with normoglycemia, supporting CGM as a complementary tool for refined risk stratification. Madhu et al 32 similarly reported prolonged hyperglycemic periods in individuals with IGT, reinforcing these associations across diverse cohorts.
Continuous glucose monitoring complements FPG, HbA1c, and OGTT, which, although diagnostic, provide only static measurements. Its continuous nature enables detection of postprandial fluctuations and variability not visible in single-point tests, making it particularly informative for individuals with borderline or discordant laboratory results.
Barriers and Gaps in Glucose Screening
Despite the growing burden of diabetes, screening remains suboptimal. In Europe, nearly one-third of diabetes cases are undiagnosed, 46 and only 55.6% of individuals aged ≥15 years report blood glucose testing in the past year. 47 Conventional tests, such as the OGTT, are time-consuming and may miss transient glycemic excursions. Studies show that even normoglycemic individuals experience brief postprandial spikes above 140 mg/dL.16,29 Dorcely et al 29 observed that more than half of participants with HbA1c < 5.7% had elevated 1-hour plasma glucose and higher CGM variability. These findings highlight that static tests may underestimate subtle metabolic disturbances that CGM can detect over several days of wear.
Technological and Physiological Insight
Advances in CGM technology, including factory calibration, improved sensor accuracy, and smartphone integration, have enhanced usability and accessibility. 48 Factory-calibrated devices, such as the Freestyle Libre and Dexcom G6, eliminate the need for fingerstick calibration, thereby increasing adherence. 49 Continuous glucose monitoring is now integral to the care of T1DM and T2DM 50 and is increasingly used in individuals without diabetes, where variability reflects early metabolic risk.51-53 Although T2DM was once uncommon in children, its prevalence has increased. 54 Continuous glucose monitoring studies in healthy children revealed brief glucose excursions above 140 mg/dL and below 70 mg/dL despite normal averages, emphasizing physiological.18,35 In older adults without diabetes, more than 90% of glucose values fall between 71 and 120 mg/dL, and excursions above 140 mg/dL occur only 0.4% of the time. 35 A multicenter study reported a median TIR of 96% (70-140 mg/dL), providing reference data across various age groups. 37
In a cohort of 8315 individuals without diabetes, fasting glucose fluctuated daily by 7.5 mg/dL, and 40% were reclassified when multiple sequential CGM readings were analyzed, 38 underscoring the limits of single fasting measurements.
Ethnic and regional factors may influence glucose metabolism and the interpretation of CGM results. 55 Subgroup analyses revealed no significant differences in pooled effect estimates between racial groups, though data were limited. Notably, CGM use remains lower among Black, Hispanic, and other marginalized populations despite socioeconomic adjustment, 56 warranting further equity-focused research.
Limitations of Oral Glucose Tolerance Test and Single-Time Measurements
During a 75-g OGTT, glucose may exceed 140 mg/dL within two hours, even in individuals with normal tolerance, while baseline and two-hour readings may miss transient peaks. 57 Dorcely et al 29 found that over half of participants with HbA1c < 5.7% had elevated 1-hour glucose and higher CGM means, indicating early dysglycemia. Similarly, the A1C-derived average glucose study reported that 93% of normoglycemic individuals exceeded 140 mg/dL for a median of 26 min/day. 16 These data illustrate that OGTT and other single-time tests may underestimate short-term fluctuations, whereas CGM provides continuous characterization of variability.
Strengths, Limitations, and Sources of Bias
This meta-analysis, including 1657 participants across diverse settings, applied standardized CGM definitions and showed consistent differences in mean glucose, MAGE, CV, and TAR between prediabetes and normoglycemia. The reproducibility and alignment of direction and magnitude strengthen confidence in its validity.
However, CGM systems (Abbott, Medtronic, Dexcom) varied in calibration, lag time, and accuracy, introducing heterogeneity. 58 Monitoring duration (3-14 days) and dietary standardization also differed across studies. Importantly, there is currently no established consensus on the optimal CGM wear duration required to reliably estimate glycemic variability and related CGM metrics in individuals with prediabetes. Our subgroup analyses indicated that monitoring duration influenced effect estimates for certain outcomes, suggesting that variability in sampling length may introduce uncertainty and limit direct comparability across studies. Some studies used unblinded CGM, allowing real-time feedback that may have prompted behavioral changes (Hawthorne effect) and reduced TAR.59-62 Future trials should employ blinded designs or short wash-in periods to minimize such bias.
Prediabetes definitions varied across the included studies, with some relying solely on HbA1c and FPG, whereas others incorporated OGTT-based criteria. Individuals with isolated IFG and isolated IGT represent distinct metabolic phenotypes with different underlying pathophysiology. The absence of systematic OGTT testing in some cohorts may therefore have led to misclassification, whereby a proportion of participants categorized as normoglycemic may in fact have had undetected prediabetes or early dysglycemia. This heterogeneity in diagnostic criteria could have attenuated observed effect sizes and contributed to between-study variability.
Formal publication bias testing was not feasible due to the limited number of studies per outcome (<10). Funnel plot asymmetry suggested possible small-study effects and selective reporting. Moreover, limited access and cost constrain broader CGM use in many regions. 63
Importantly, subset analyses restricted to studies published from 2019 onward yielded directionally consistent results across the main CGM metrics, indicating that the observed differences between prediabetes and normoglycemia are not driven by earlier CGM technologies. Despite these factors, all analyses consistently demonstrated higher CGM metrics in individuals with prediabetes, supporting the robustness of these findings.
Implications for Practice and Future Research
Translating these findings into clinical and public health practice is essential for maximizing CGM’s potential.64,65 CGM captures distinct glycemic patterns differentiating prediabetes from normoglycemia, offering additional context to borderline or discordant HbA1c, FPG, or OGTT results. Such insight may support personalized risk assessment and targeted lifestyle modification. Before integration into screening frameworks, standardized metrics and diagnostic thresholds should be established in prospective cohorts. Available evidence suggests that in many settings, a 10- to 14-day monitoring period with ≥70% data completeness provides more stable estimates of key CGM metrics, whereas a shorter wear period may increase imprecision.49,66,67 Age and body mass index (BMI) modify postprandial glycemia; thus, stratified reporting is warranted.68,69,28
Prediabetes represents a progressive metabolic continuum rather than a single homogeneous state, spanning early dysglycemia to stages approaching overt T2DM. Emerging staging frameworks for T2DM further emphasize this concept. 70 CGM metrics may therefore differ between early and more advanced prediabetes phenotypes, reflecting differences in insulin sensitivity and β-cell function. Although the present meta-analysis could not stratify participants by prediabetes stage due to limitations in the available literature, future studies integrating CGM metrics with clinical staging may enable refined risk stratification and earlier identification of individuals at highest progression risk.
Beyond conventional TAR-based metrics, future CGM research should increasingly focus on real-life glucose kinetics, including the duration and temporal patterns of postprandial hyperglycemia. Quantifying how long glucose values remain above clinically relevant thresholds (eg, >140, >180, and >200 mg/dL) after meals may provide complementary insights into metabolic flexibility, insulin sensitivity, and early dysglycemia in both healthy individuals and those with prediabetes. Such dynamic metrics may improve the physiological interpretation of CGM data and enhance early risk stratification beyond static summary measures.
Expanding the use of CGM in populations without diabetes will require education and interdisciplinary collaboration. Training programs for patients and healthcare providers should emphasize interpretation and behavioral guidance based on variability data. 71 Policymakers and funding agencies should support further research to establish the role of CGM in early metabolic risk assessment and precision prevention.
Conclusion
This meta-analysis provides the first quantitative synthesis showing that CGM metrics consistently differ between individuals with prediabetes and those with normoglycemia. These results indicate that CGM captures dynamic aspects of glucose regulation that complement conventional static measures, supporting its potential use in refined metabolic risk assessment. Further prospective studies are warranted to define standardized CGM thresholds and evaluate their contribution to future precision-screening and preventive care strategies.
Supplemental Material
sj-docx-1-dst-10.1177_19322968261426384 – Supplemental material for Differences in Continuous Glucose Monitoring Metrics Between Prediabetes and Normoglycemia: A Systematic Review and Meta-Analysis
Supplemental material, sj-docx-1-dst-10.1177_19322968261426384 for Differences in Continuous Glucose Monitoring Metrics Between Prediabetes and Normoglycemia: A Systematic Review and Meta-Analysis by Gabriella Rákóczi, Judit Nagy, Shaghayegh Jozaee, Shirin Jozaee, Boglárka Lilla Szentes, Jimin Lee, Anett Rancz, Péter Hegyi, Gergely Agócs and Emese Sipter in Journal of Diabetes Science and Technology
Footnotes
Acknowledgements
None to declare
Abbreviations
ADA, American Diabetes Association; BMI, body mass index; CGM, continuous glucose monitoring; CI, confidence interval; CV, coefficient of variation; EASD, European Association for the Study of Diabetes; FPG, fasting plasma glucose; HbA1c, hemoglobin A1c; IFG, impaired fasting glucose; IGT, impaired glucose tolerance; MAGE, mean amplitude of glycemic excursions; MARD, mean absolute relative difference; MD, mean difference; OGTT, oral glucose tolerance test; SD, standard deviation; T1DM, type 1 diabetes mellitus; T2DM, type 2 diabetes mellitus; TAR, time above range; TITR, time in tight range; TIR, time in range.
Author Contributions
G.R. contributed to conceptualization, data curation, investigation, project administration, and writing—original draft; J.N. contributed to conceptualization, data curation, investigation, and writing—review and editing; Sha.J. contributed to data curation, investigation, and writing—review and editing; Shi.J. contributed to data curation, investigation, and writing—review and editing; G.A. contributed to formal analysis, investigation, validation, visualization, and writing—review and editing; B.L.Sz. contributed to formal analysis, investigation, validation, and visualization J.L. contributed to conceptualization, methodology, supervision, and writing—review and editing; A.R. contributed to conceptualization, supervision, writing—review and editing; P.H. contributed to conceptualization, methodology, supervision, and writing—review and editing; E.S. contributed to conceptualization, supervision, and writing—review and editing.
All authors certify that they have participated sufficiently in the work to take public responsibility for the content, including participation in the concept, design, analysis, writing, or revision of the manuscript.
Declaration of Conflicting Interests
The authors declared no potential conflicts of interest with respect to the research, authorship, and/or publication of this article.
Funding
The authors disclosed receipt of the following financial support for the research, authorship, and/or publication of this article: Funding was provided by the Centre for Translational Medicine, Semmelweis University, Hungarian Ministry of Innovation and Technology, National Research, Development, and Innovation Fund (TKP2021-EGA-23 to Péter Hegyi), and NKFIH project grants K131996 and K147265 (to Péter Hegyi).
Ethical Approval
No ethical approval was required for this systematic review with meta-analysis, as all data were already published in peer-reviewed journals. No patients were involved in the design, conducting or interpretation of our study.
Data Availability Statement
The data sets used in this study are available in the full-text articles included in the systematic review and meta-analysis.
Supplemental Material
Supplemental material for this article is available online.