
Abstract
Introduction:
Comprehensive characteristics of the glycemic profile for prediabetes derived by continuous glucose monitoring (CGM) are unknown. We evaluate the difference of CGM profiles between individuals with prediabetes and normoglycemic individuals, including the response to oral glucose tolerance test (OGTT).
Methods:
Individuals with prediabetes matched for age, sex, and BMI with normoglycemic individuals were instructed to use professional CGM for 1 week. OGTT was performed on the second day. The primary outcomes were percentages of glucose readings time below range (TBR): <54 or <70 mg/dL, time in range (TIR): 70 to 180 mg/dL, and time above range (TAR): >180 or >250 mg/dL. Area under the curve (AUC) was calculated following the OGTT. Glucose variability was depicted by coefficient of variation (CV), SD, and mean amplitude of glucose excursion (MAGE). Wilcoxon sign-ranked test, McNemar mid P-test and linear regression models were employed.
Results:
In all, 36 participants (median age 51 years; median body mass index [BMI] = 26.4 kg/m2) formed 18 matched pairs. Statistically significant differences were observed for 24-hour time in range (TIR; median 98.5% vs. 99.9%, P = .013), time above range (TAR) >180 mg/dl (0.4% vs. 0%, P = .0062), and 24-hour mean interstitial glucose (113.8 vs. 108.8 mg/dL, P = .0038) between people with prediabetes compared to normoglycemic participants. Statistically significant differences favoring the normoglycemic group were found for glycemic variability indexes (median CV 15.2% vs. 11.9%, P = .0156; median MAGE 44.3 vs. 33.3 mg/dL, P = 0.0043). Following OGTT, the AUC was significantly lower in normoglycemic compared to the prediabetes group (median 18615.3 vs. 16370.0, P = .0347 for total and 4666.5 vs. 2792.7, P = .0429 for incremental 2-hour post OGTT).
Conclusion:
Individuals with prediabetes have different glucose profiles compared to normoglycemic individuals. CGM might be helpful in individuals with borderline glucose values for a more accurate reclassification.
Introduction
Prediabetes, a term used to define high glucose burden not reaching the official diagnosis criteria for diabetes, is characterized by the presence of impaired fasting glucose (IFG) and/or impaired glucose tolerance (IGT) and/or HbA1c 5.7% to 6.4%. 1 As prediabetes should not be viewed as a clinical entity by its own, but rather as a condition related to increased diabetes risk and cardiovascular disease (CVD), it would be helpful to draw more information on the comprehensive characteristics of the glycemic profile of this population as derived by continuous glucose monitoring (CGM).1,2Currently, the standard metrics for CGM apply to patients with diabetes. Instead, heterogeneity prevails in the definition of time in range (TIR) on individuals with prediabetes or normoglycemia, as previous studies reported on various thresholds particularly for the upper limit of TIR, which ranges from 125 to 180 mg/dL of glucose values.3-14
Among various CGM devices, professional CGMs provide retrospective (blinded or unblinded) data for analysis and are mainly used to identify patterns of hypo- and hyper-glycemia. 2 As such, they can be helpful for describing the glycemic profile of prediabetes or normoglycemia subsets since targeted behavioral modification is not warranted contrary to real-time CGM devices in patients with diabetes, where the actual (real-time) glucose value can be seen by the individual.
We aim to evaluate the difference of CGM profiles between people with prediabetes and matched normoglycemic individuals, as well as their CGM response on glucose load by performing a 75 g oral glucose tolerance test (OGTT).
Research Design and Methods
Study Design and Participants
This non-randomized interventional study was performed at the Diabetes Outpatient Clinic of the University Hospital of Ioannina, Greece. Individuals were recruited from the general population participating in the Epirus Health Study (EHS). In brief, EHS is an ongoing prospective cohort study with 1832 participants (60% females) up to February 28, 2022 living permanently in northwestern Greece. The rationale and methods of the EHS study, including information on the recruitment of the participants as well as data collection, have been described elsewhere. 15
For the current study, inclusion criteria were age ≥18 years, ability to provide informed consent, no known history of diabetes, no history of severe cardiovascular, liver, kidney, or pancreas diseases and non-missing values on fasting plasma glucose (FPG) or Hemoglobin A1c (HbA1c), age, and body mass index (BMI) measured in the context of EHS. Exclusion criteria were current pregnancy, cognitive dysfunction, use of prescribed medications known to influence glucose levels and current use of a CGM sensor.
Participants with FPG levels between 100 and 124 mg/dL or HbA1c 5.7% to 6.4% were classified as individuals with prediabetes, whereas participants with FPG <100 mg/dL and HbA1c <5.7% were categorized as normoglycemic. In total, 35 EHS participants with available blood and anthropometric measurements fulfilled the criteria for pre-diabetes. For each participant with prediabetes, 1 normoglycemic individual was matched by age (±10 years), gender, and BMI (±5 kg/m2).
All participants gave written informed consent, and the study was approved by the Research Ethics Committee of the University Hospital of Ioannina.
Procedures
The study’s coordinators informed the eligible participants about the study design, any potential risks, and obtained informed consent. Blood samples were collected during fasting state and professional CGM sensors (Envision™ Pro, Medtronic) were placed according to manufacturer’s recommendations. The sensors acquired interstitial glucose measurements every 5 minutes in a 24-hour basis.
All participants were instructed to wear the CGM sensor for 1 week and follow the same pattern of food intake to maximize the probability of similar dietary patterns within each matched pair. In particular, for each day of the week, we advised the individuals to follow the same dietary pattern based on the Mediterranean diet which is accepted in Greece (eg, for the first day of the CGM wearing a diet based on poultry, the next day on fish, then on vegetables, etc.). As the design of the study used matched pairs for BMI, we did not define an exact amount of calories consumption per meal due to the high risk for non-adherence, but instead a range of calories that would match their usual portions. We further administered the Mediterranean diet adherence screener (MEDAS) questionnaire at baseline. 16 Moreover, we advised the participants to abstain from any vigorous physical activity during this week. We downloaded the Envision™ Pro app (MMT-7782) for all participants and encouraged them to record their routine lifestyle. On their second day of the CGM sensor wearing, all participants were invited to a second visit at the Diabetes Outpatient Clinic during fasting state and no later than 11 am. A 75 g OGTT was performed (not synchronized at a specific morning hour) followed by a minimum 2-hour rest in order to evaluate the CGM response on glucose load.
Participants and the research team were blinded to the CGM glucose values during the study period; all CGM sensor data were downloaded after study’s completion.
Outcomes
The primary outcome was the percentage of glucose readings below range (TBR: <54 or <70 mg/dL), in range (TIR: 70-180 mg/dL), and above range (TAR: >180 or >250 mg/dL). TIR was further examined during daily (06:00-23:59) and nocturnal (00:00-05:59) hours, as differences might be observed in individuals with prediabetes with mainly IGT which is more obvious during daytime, and IFG which might be more obvious during the night. Considering the high percentage of glucose readings in range for both individuals with prediabetes and normoglycemic participants, stricter thresholds were applied to define normoglycemia (70-125 or 70-140 mg/dL) and mild hyperglycemia (126-180 or 141-180 mg/dL). The proportion of pairs with at least 1 participant having 1 glucose reading below, within or above range was calculated as well. Total, daily and nocturnal mean interstitial glucose were calculated as a measure of the overall level of glycemia. Glucose variability was depicted by the coefficient of variation (%CV), standard deviation (SD), and mean amplitude of glucose excursions (MAGE).
In order to explore the association between CGM-derived glucose measurements and OGTT, total, and incremental areas under the glucose curve (AUC) were calculated (using the trapezoidal rule) starting from the timepoint when the OGTT was performed up until 2 and 4 hours later. Incremental AUC depicts the area above the baseline glucose value from which the OGTT has started, whereas total AUC refers to the total area of glucose fluctuations from the beginning of the OGTT down to a glucose level of “zero” (y-axis value of zero). The choice of estimating both total and incremental AUC is explained by the reason that following the OGTT, we expect that glucose values would fluctuate upward from the baseline glucose level for the first 2 hours, but it is uncertain if the same pattern would be evident for the last 2 of the whole 4 hours post OGTT. In this case, total AUC would capture any differences above as well as below the baseline glucose levels from the beginning of the OGTT. The arithmetic differences between the baseline glucose value from the beginning of the OGTT and (1) the maximum glucose value up to 4 hours later, and (2) the glucose value 1 and 2 hours later were further investigated.
Statistical Analysis
Participants’ baseline characteristics and all outcomes following CGM use were summarized overall and by subgroup using medians, minimum and maximum values for continuous variables, and percentages for categorical variables. Wilcoxon sign-ranked test and McNemar mid p-test were employed to detect any differences between matched pairs. We considered the McNemar mid p-test rather than the exact McNemar test mainly due to better performance in studies with small sample sizes. 17 Multiple linear regression models were employed to investigate the differences on all outcomes between pre-diabetes and normal participants. Models were adjusted for continuous age, gender, and BMI. Standard errors were computed allowing for intragroup correlation (Clustered Sandwich Estimator) since non-independence of participants resulting from matching was suspected. All analyses were conducted using STATA v14.0 and Rstudio v1.3.1073 (package “iglu”).
Results
Participants Flow and Baseline Characteristics
After excluding participants with incomplete matched sets, participants who refused to provide informed consent and participants with insufficient CGM glucose readings (of less than 24 hours), a total of 36 participants (61.1% females) forming 18 matched pairs with a median age of 51 (range: 31.3-76.3) years and a median BMI of 26.4 (range: 21.8-36.9) kg/m2 were included in the study (Table 1). The MEDAS score was very similar between individuals with prediabetes and normoglycemic participants. Regarding the baseline laboratory tests, FPG and HbA1c were increased in individuals with prediabetes compared to normoglycemic individuals as expected, whereas none of the lipid or liver enzymes biomarkers differed significantly between the groups (Table 1).
Baseline Characteristics Overall and by Subgroup.
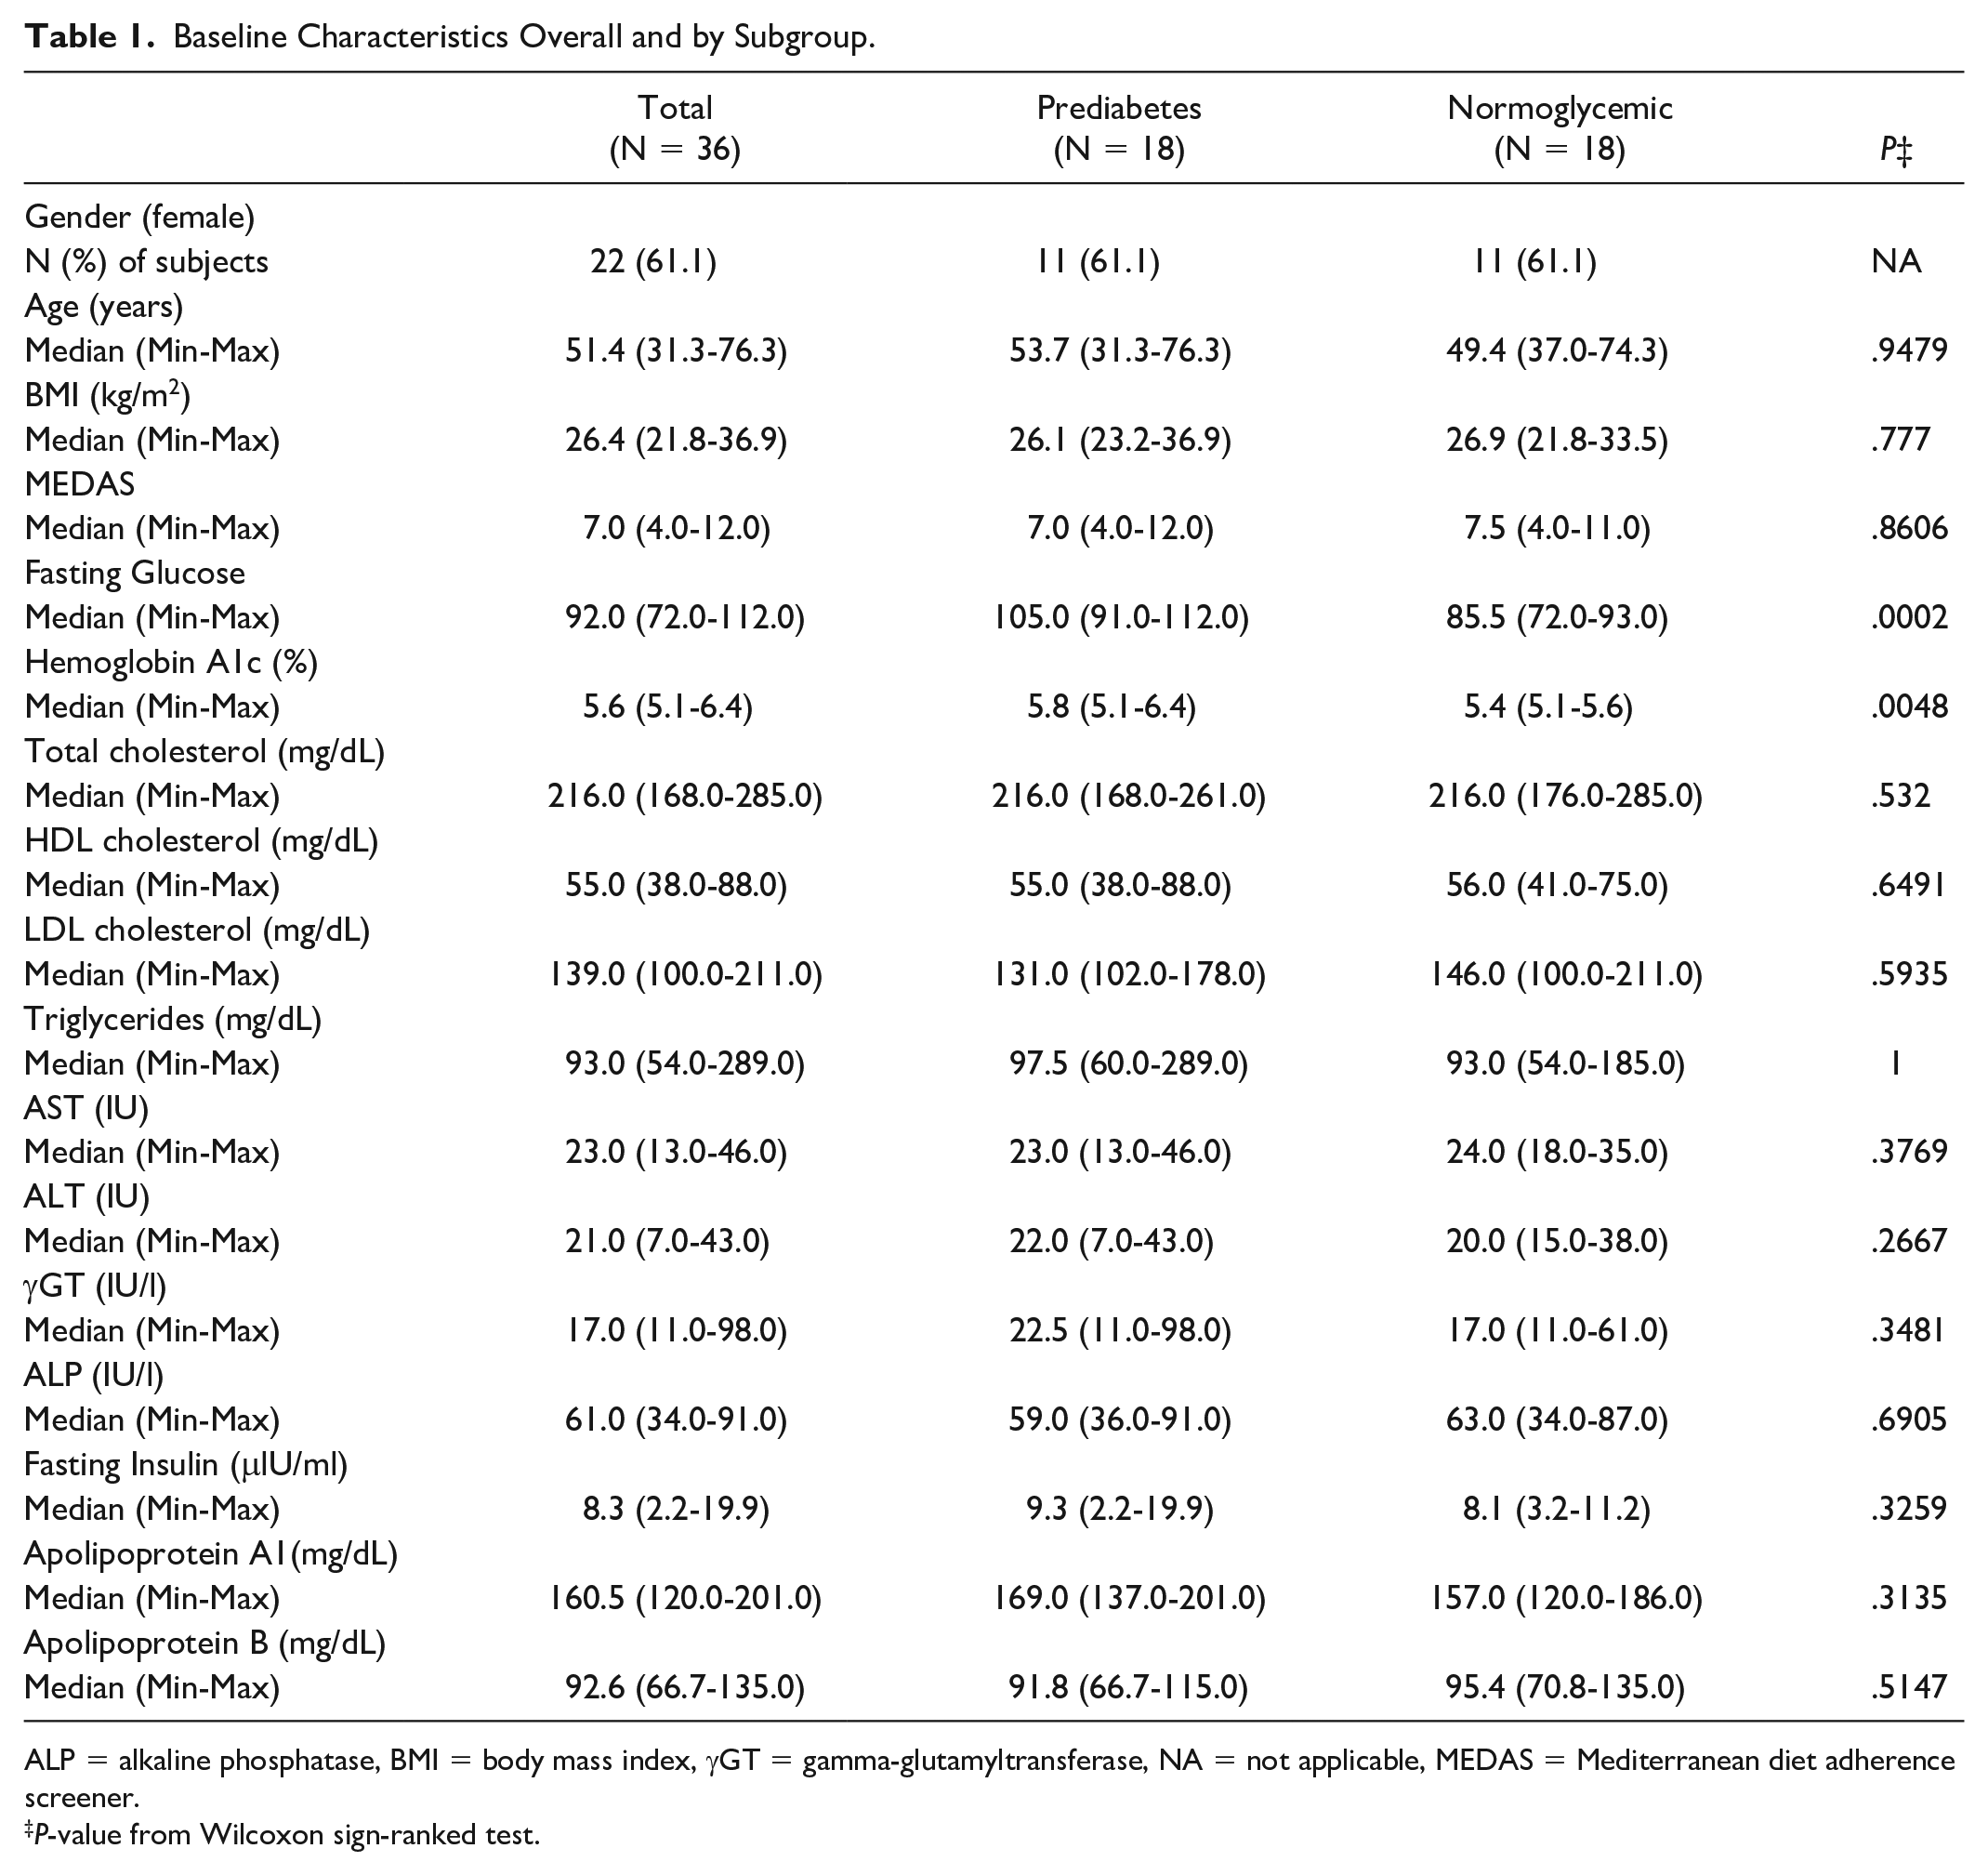
ALP = alkaline phosphatase, BMI = body mass index, γGT = gamma-glutamyltransferase, NA = not applicable, MEDAS = Mediterranean diet adherence screener.
P-value from Wilcoxon sign-ranked test.
Differences on Glucose Profile Measured by CGM
As for the CGM-related outcomes, the mean interstitial glucose was higher in individuals with prediabetes than normoglycemic participants overall (P = .0038), during daytime (P = .0033) or nighttime (P = .0025) separately. Statistically significant differences favoring the normoglycemic compared to the prediabetes group were found for all indexes of glycemic variability (CV: 15.2% vs 11.9%, P = .0156; SD: 16.2 vs 12.9, P = .0057; MAGE: 44.3 vs 33.3, P = .0043) (Table 2).
Major CGM Metrics Overall and by Subgroup.
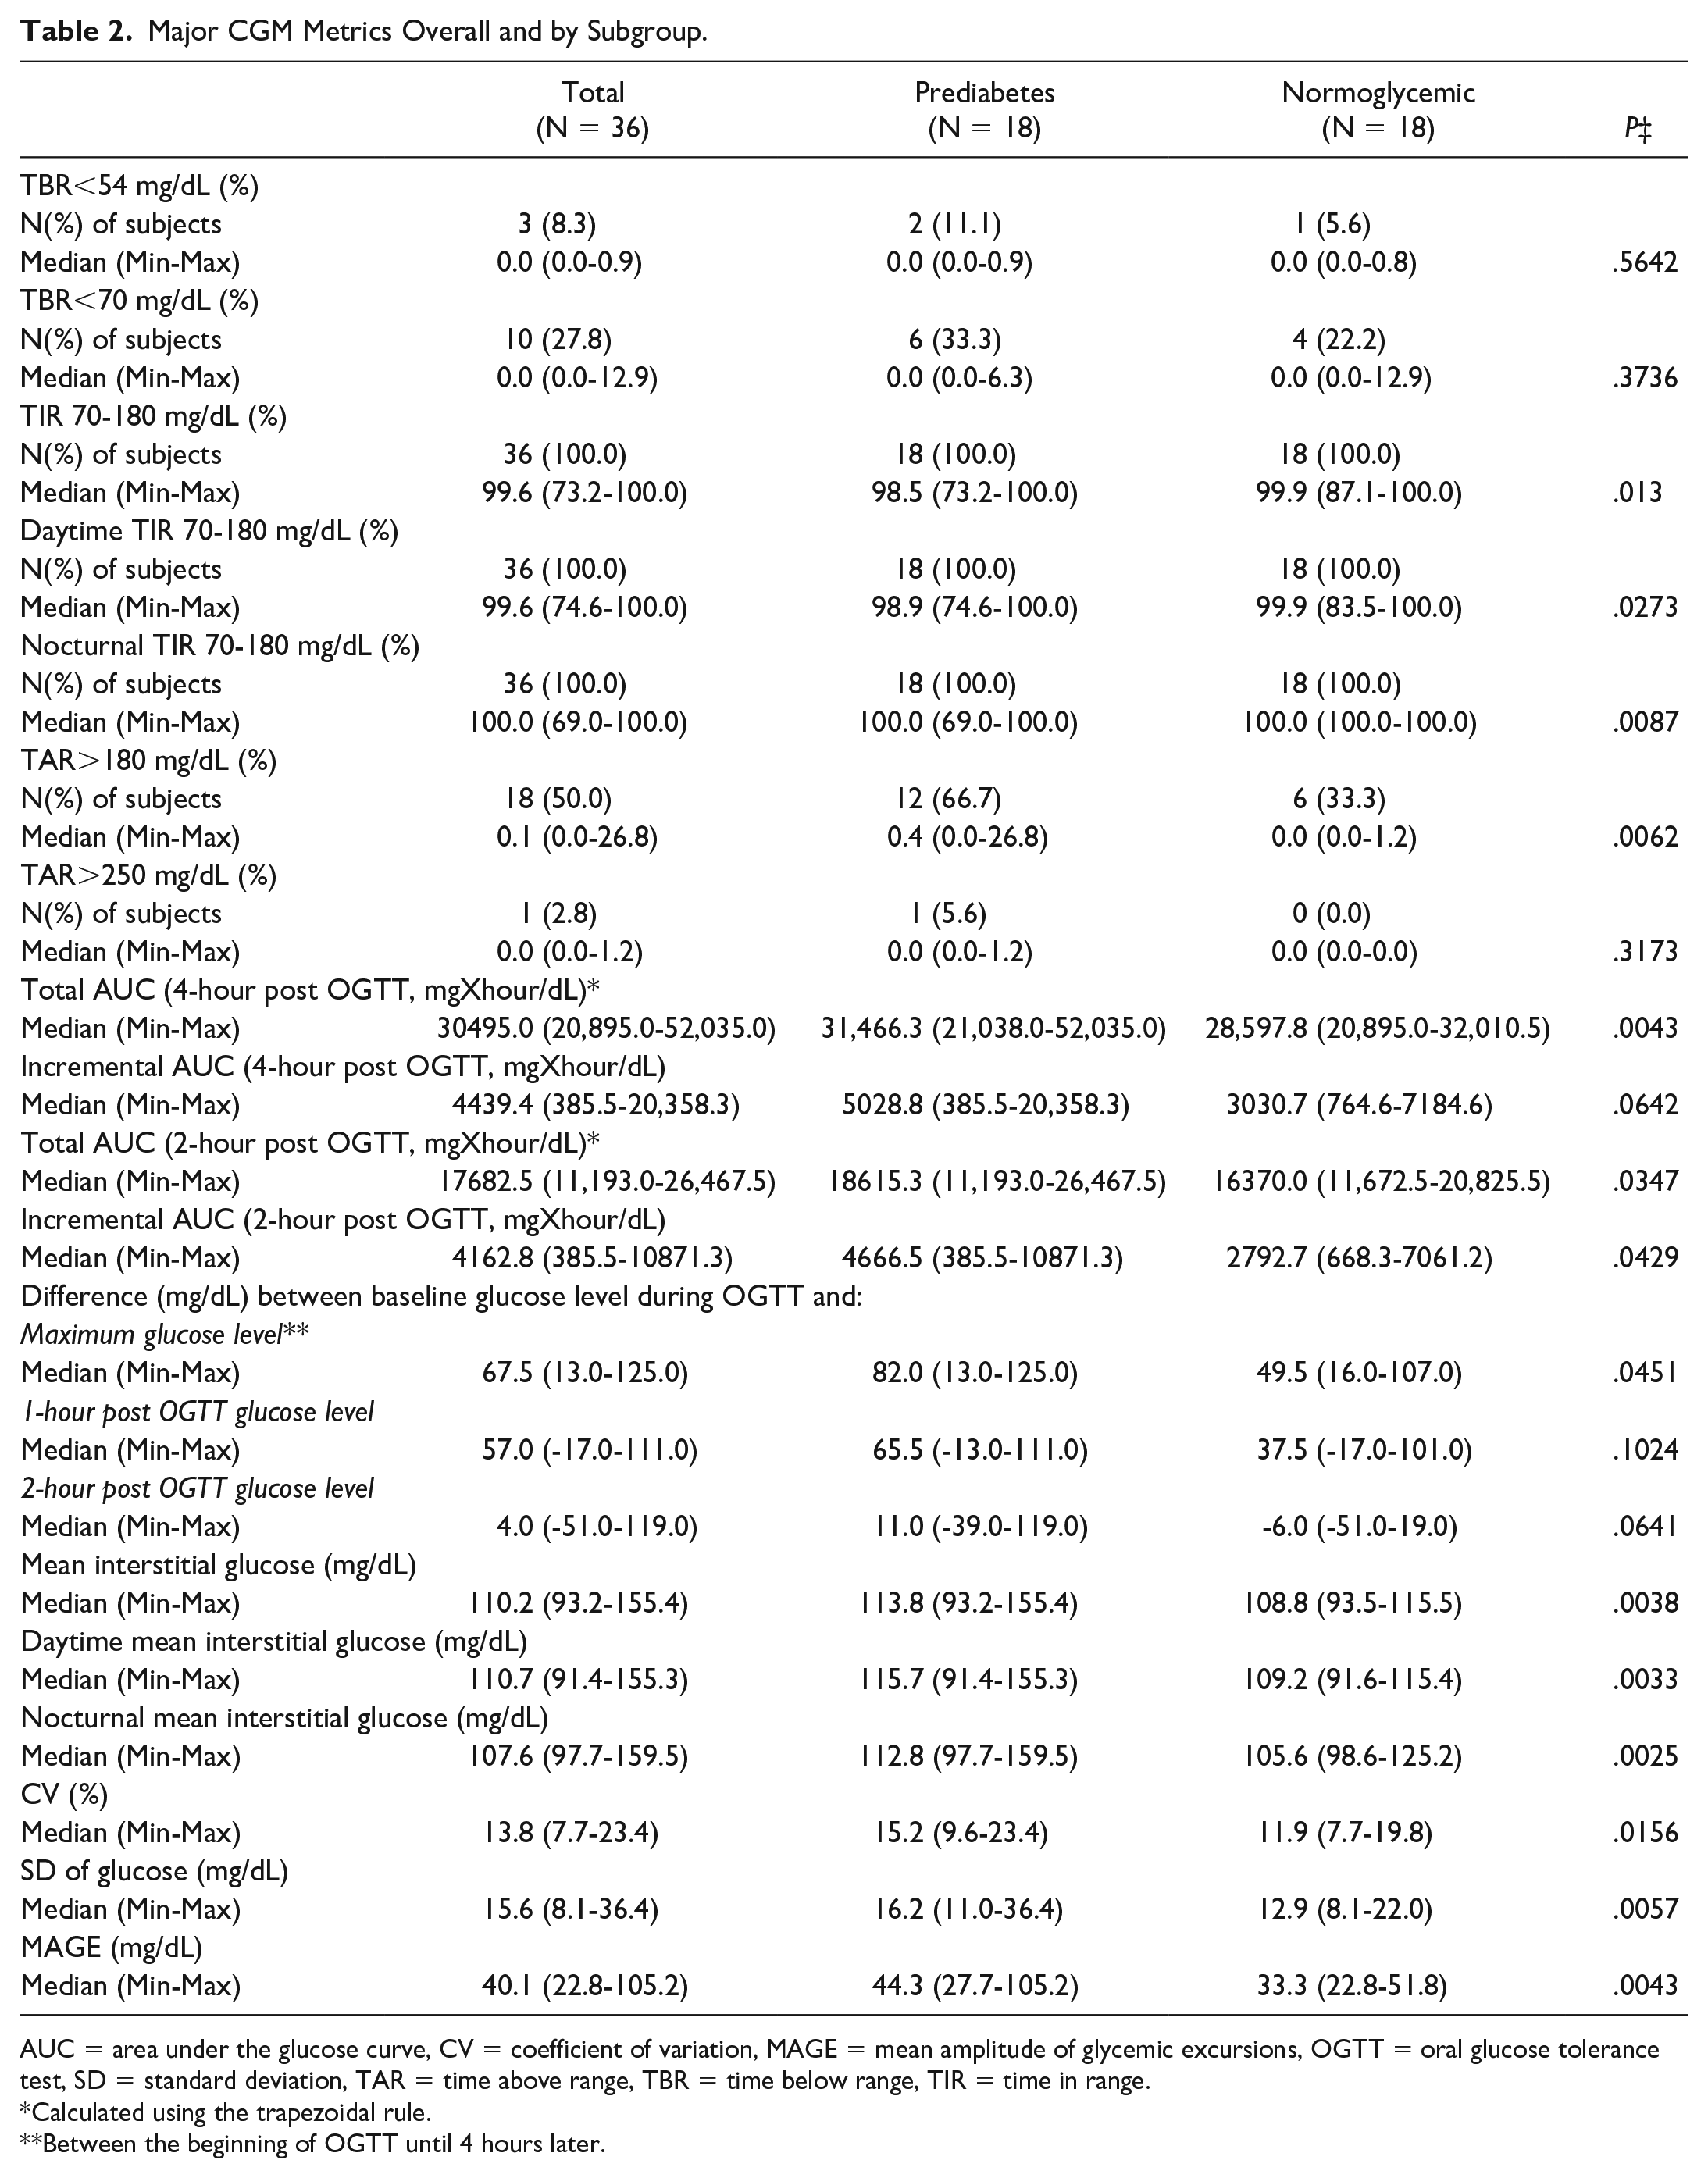
AUC = area under the glucose curve, CV = coefficient of variation, MAGE = mean amplitude of glycemic excursions, OGTT = oral glucose tolerance test, SD = standard deviation, TAR = time above range, TBR = time below range, TIR = time in range.
Calculated using the trapezoidal rule.
Between the beginning of OGTT until 4 hours later.
The median percentage of TIR (70-180 mg/dL) was 98.5% (range: 73.2%-100.0%) in individuals with prediabetes and 99.9% (range: 87.1%-100.0%) in normoglycemic participants (P = .013). Similarly, there was a statistically significant difference both in daytime and nocturnal percentages of TIR between individuals with prediabetes and normoglycemic participants (P = .0273, P = .0087, respectively) (Table 2). When normoglycemia was defined using the ranges 70 to 125 and 70 to 140 mg/dL, participants with prediabetes spent on average less TIR during 24-hour, or during daytime and nighttime. Regardless of the time window, the median percentages of time spent in mild hyperglycemia (126-180 or 141-180 mg/dL) were significantly higher in the prediabetes than the normoglycemic group (Supplementary Table 1).
Table 2 shows that only 10 participants (6 in the prediabetes and 4 in the normoglycemic group) had glucose readings below 70 mg/dL and even fewer had below 54 mg/dL (3 overall; 2 individuals with prediabetes, 1 normoglycemic). Both groups with median percentage of time below 54 or 70 mg/dL equal to 0%. In contrast, over 60% of participants with prediabetes had glucose readings greater than 180 mg/dL. Specifically, in the prediabetes group the median percentage of TAR >180 mg/dL was 0.4% (range: 0.0%-26.8%) vs. 0.0% (range: 0.0%-1.2%) in the normoglycemic group (P = .0062). There was a statistically significant difference between the percentages of pairs in which only one participant recorded glucose readings greater than 180 mg/dL (prediabetes only: 7 pairs [38.9%], normoglycemic only: 1 pair [5.6%], P = .0391) (Supplementary Table 2). Glucose readings above 250 mg/dL occurred only in one participant in the prediabetes group (Table 2). Finally, a similar pattern of results for all CGM-related outcomes was found when linear regression models were applied (Supplementary Table 3). Finally, using the app as well the record of the participants, we did not observe any marked deviations from the suggested dietary patterns as well as their lifestyle during the week of the CGM.
Differences on CGM Response Following OGTT
Total and incremental AUC were significantly lower in the normoglycemic compared to the prediabetes group following OGTT (Table 2, Figure 1, Supplementary Figures 1–2, Supplementary Table 3). For the whole study population, the peak glucose levels following OGTT were in 1 hour, following by the restoration toward the baseline values between the next 2 to 3 hours (Supplementary Figure 3). However, the difference between baseline glucose levels and glucose levels 1 and 2 hours following OGTT did not reach statistical significance (Table 2, Supplementary Table 3). Figure 1 shows how the glycemic profile differs between individuals with prediabetes compared to normoglycemic individuals: notably the differences in glucose levels are exaggerated when a glycemic load such as the OGTT is administered.
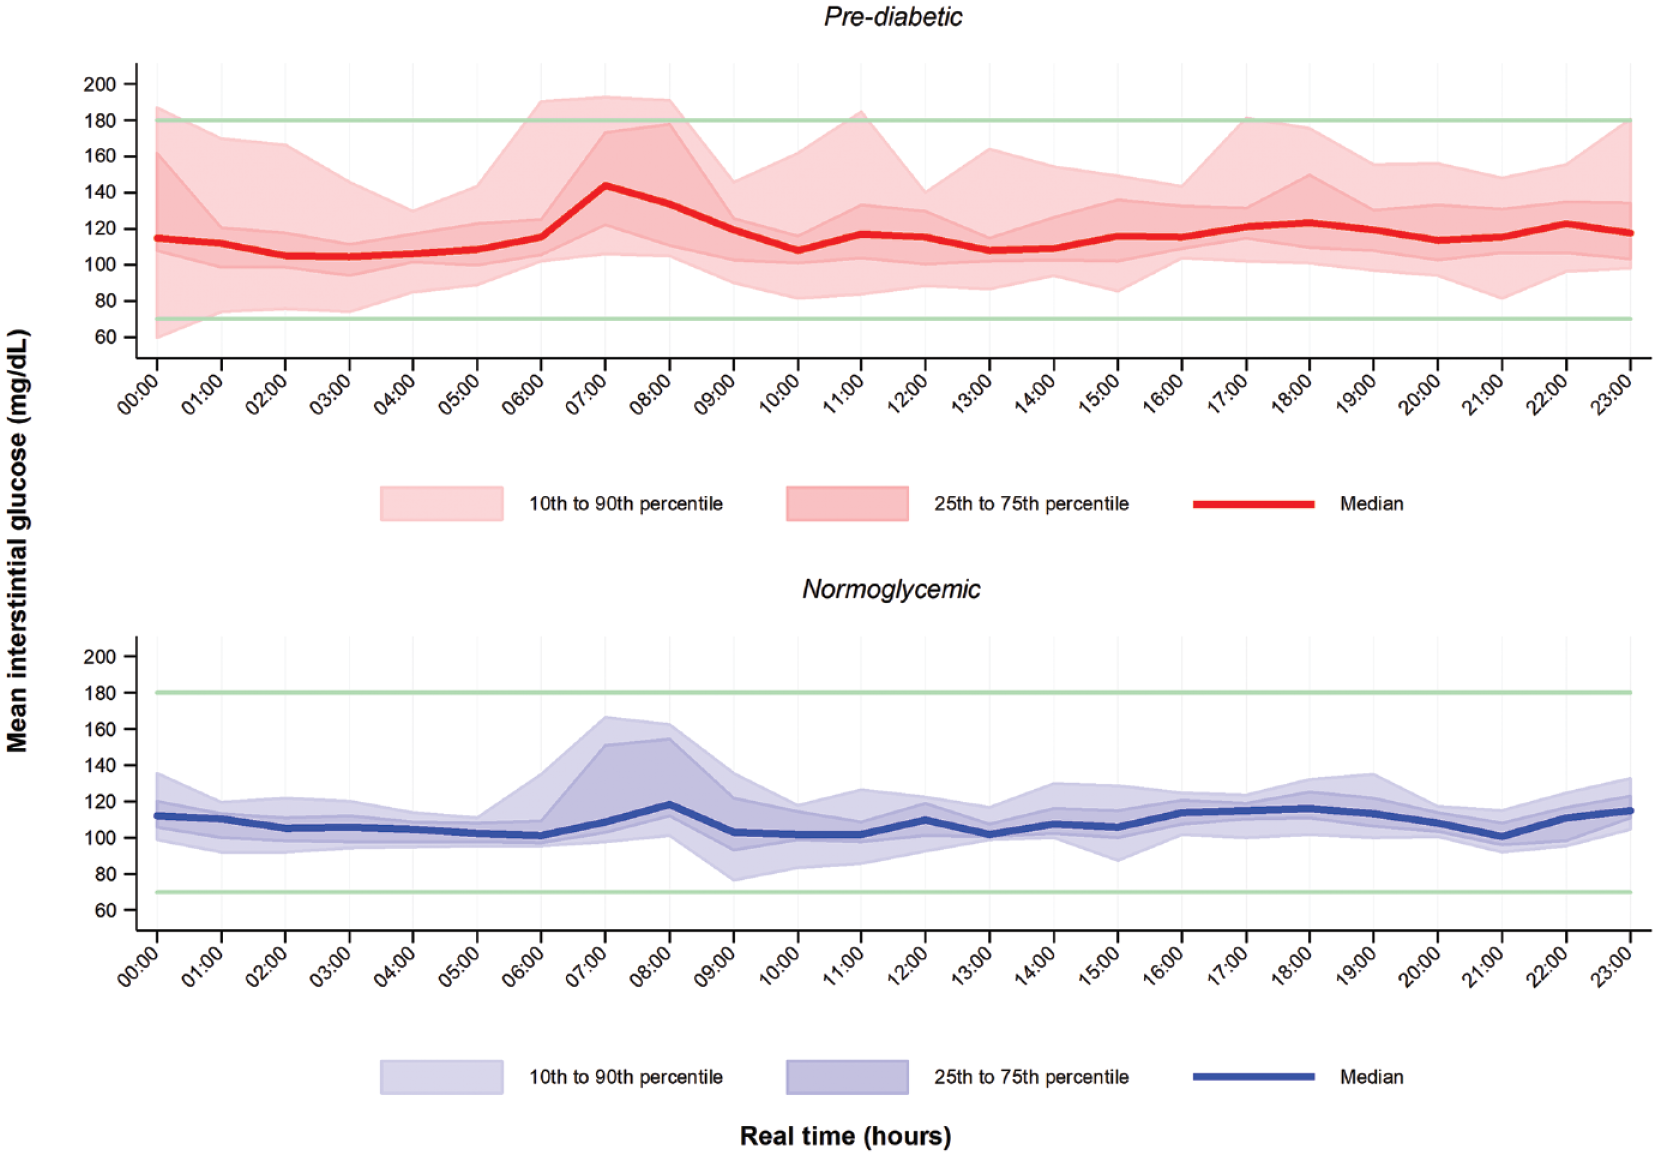
Ambulatory glucose profile (AGP) during 2nd day, when the oral glucose tolerance test (OGTT) was performed (morning, not synchronized at a specific morning hour). The Y-axis represents interstitial glucose measurements. The X-axis represents real time in hours. AGP in red corresponds to individuals with prediabetes and AGP in blue corresponds to normoglycemic subjects.
Discussion
In this matched-pair analysis, we studied the comprehensive glycemic profiles of individuals with prediabetes and normoglycemic individuals based on analytical data provided by a professional CGM. We found that the prediabetes population differs significantly in time spent in mild hyperglycemia during the usual lifestyle as well as during the OGTT, and that the glucose variability is greater in this group compared to the normoglycemic individuals.
To date, the evidence reporting on the comprehensive glucose profiles of individuals with prediabetes, as well as normoglycemic individuals is limited. Previous publications using CGM have shown some differences between these 2 populations in various CGM metrics including glycemic variability indices such as CV and MAGE, as well as TIR, but mostly refer to a glucose range of 70 and 140 mg/dL. In detail, CGM data in normoglycemic individuals showed that 91% of the time spent in TIR 70 and 144 mg/dL, while 3% (43 minutes) was spent in TBR < 70 mg/dL and the remaining 6% in TAR > 145 mg/dL. 3 Equally, in the A1C-Derived Average Glucose (ADAG) study including healthy individuals with FPG levels ≤ 97 mg/dL and HbA1c <6.5%, almost all (93%) participants exceeded glucose levels >140 mg/dL for a median time of 31 minutes, and 25% of the total cohort experienced glucose levels >140 mg/dL for > 75 min/day. 4 Mazze et al 18 showed that CGM measurements in normoglycemic individuals averaged 105 +/- 8 mg/dL in daytime and 97 +/- 6 mg/dL in nighttime. In another study of 78 participants without diabetes, Hill et al 19 showed that the time spent on glucose levels below 63 mg/dL (3.5 mmol/L) was on average 1.2% for all subjects, and the percentage of time spent with values greater than 126 mg/dL (7.0 mmol/L) was on average 2.1%. Regarding individuals with prediabetes, in a study including participants at high risk of developing diabetes, IFG subjects had 2% (29 minute) of their time spent at glucose levels > 140 mg/dL compared to 1% (15 minute) of the normoglycemic individuals. 5 In another study, mean 24-hour and daytime but not nocturnal glucose levels, as well as AUC for glucose levels >140 mg/dL were significantly higher in individuals with prediabetes compared to normoglycemic subjects, with a mean time spent >140 mg/dL of 82 minute in the normoglycemic compared to 187 minute in the prediabetes group. 6 In the AEGIS study, the percentage of time with glucose levels > 140 mg/dL in a Spanish population was 3.6% (52 minutes) in individuals with prediabetes vs. 1.2% (17 minutes) in normoglycemic individuals. 7 Finally, in hospitalized on a fixed diet schedule, obese, first-degree relatives of type 2 diabetes patients, the IFG and IGT groups spent 9.7 hours and 9.9 hours, respectively, for a glucose cutoff > 140 mg/dL, compared with 3.2 hours in the normoglycemic group, and 2.1 and 2.9 hours for glucose levels > 200 mg/dL, respectively, compared with 1.3 hours for the normoglycemic group. 8 In contrast to the above reports, TIR 70-140 mg/dL or TBR <70 mg/dL did not differ between individuals with prediabetes compared to normoglycemic Latino individuals. 9 Regarding the glycemic variability metrics such as SD of glucose and MAGE, it was reported to be higher in individuals with prediabetes compared to normoglycemic subjects.5,9,10 Morbidly obese individuals, either normoglycemic or with prediabetes, have higher glycemic variability compared with normal weight, individuals without diabetes. However, glycemic variability metrics did not seem to differ between individuals with prediabetes and normoglycemic morbidly obese subjects. 20 Madhu et al 8 reported that there is a progressive increase in several measures of glycemic variability as one moves from subjects with normal glucose tolerance, to IFG, to IGT, and finally to newly diagnosed diabetes mellitus. Similarly, Chakarova et al 10 highlighted the significant increase of glucose variability in individuals with prediabetes compared to normal glucose tolerance subjects. To sum up the evidence on the field, most reports highlight that the time spending in glucose values >140 mg/dL is more and glycemic variability is greater in individuals with prediabetes compared to normoglycemic individuals. Of note, significant heterogeneity prevails in the population assessed such as non-matching of the participants, definition of prediabetes (various thresholds for fasting glucose, prediabetes definition based on fasting glucose or IGT or glycated hemoglobin), various phenotypes (ranging from normal BMI to morbid obesity), differences in race, age and gender, definition of the upper limit of TIR (ranging from 125, 140, or 180 mg/dL of glucose values), and finally heterogeneity in reporting (percentage of time vs. absolute time spent in various glucose levels, mean vs. median glucose-related outcomes, selective reporting on TIR 70-140 vs. TIR 70-180 mg/dL) represent serious limitation to the interpretation of the findings.
In an effort to overcome these limitations, we used a different approach in the design our study and analysis of the results, using matched pairs of a homogeneous population with a structured lifestyle, uniformly accepted definitions of the eligibility criteria for the participants, clear definition of the endpoints and for the first time their response to an OGTT. We confirm some of the above findings of more time (median 51 min/day) for the prediabetes group spending in mild hyperglycemia (>140 mg/dL) compared to the normoglycemic group. Moreover, we did find that the individuals with prediabetes spent more than 21 (median) min/day (mean 50 min/day) in hyperglycemia defined as >180 mg/dL compared to normoglycemic subjects. This finding seems important when we randomly perform glucose measurements for diagnostic purposes, keeping in mind that randomly high glucose levels (>200 mg/dL plus symptoms) are still one of the criteria to diagnose diabetes. In line to most of the previously reported studies, we found higher glycemic variability in individuals with prediabetes compared to normoglycemic individuals.
Our findings imply the existence of a continuum between normoglycemic, individuals with prediabetes, or even individuals with diabetes with borderline (low) glucose levels, pointing that the cut-off values we use (<100 mg/dL, 100-125 mg/dL, >126 mg/dL) are helpful but not necessarily accurate to classify a subject as normoglycemic or as an individual with prediabetes or diabetes. CGM has been recently reported as a valid tool for a more accurate classification of prediabetes and diabetes.12,21Thus, further evaluation is probably needed with more analytical tools like CGM in borderline cases. We additionally show that in normoglycemic individuals the glucose values may exceed 140 mg/dL during the day, but never during the night. No differences were found for any threshold of hypoglycemia (<70 or <54 mg/dL), as well as for marked hyperglycemia (>250 mg/dL) between individuals with prediabetes normoglycemic individuals. During OGTT, we notice marked differences in the glycemic profile between the 2 groups, which remain for a total period of 4 hours post OGTT. Thus, the restoration of glucose values toward normal is difficult and time-consuming following a high carbohydrate load in individuals with prediabetes. Moreover, the glycemic profile for the whole population following OGTT shows that the highest glucose values are during the first post-OGTT hour, with quick restoration toward the baseline levels in the next 2 hours. These findings should be taken into consideration when we use the OGTT as a diagnostic tool for prediabetes or diabetes, as it underlies the importance of the right timing for the post-OGTT serum glucose measurement (currently applies for 2 hours). Any difference far from this time-point might result in false interpretation of the OGTT. To the best of our knowledge, there are no reports assessing the glycemic profile following a glucose load in matched individuals with prediabetes and normoglycemic individuals. In a selected population of normoglycemic, insulin-resistant women, OGTT showed peak glucose levels between 30 and 90 minutes following the performance of the test, close to our finding of a steep glucose increase during the first post-OGTT hour. 11 In a different design Chakarova et al 10 reported that based on glucose tolerance test, individuals with prediabetes had higher glycemic variability compared to subjects with normal glucose tolerance. We found that all standard metrics of glycemic variability such as CV, SD of glucose and MAGE differ significantly between the 2 groups, which means that the fluctuations of glucose levels are evident even in this group of individuals with prediabetes and should be probably taken into consideration for borderline cases of normoglycemics to individuals with prediabetes. As such, it has been reported that specific types of glycemic responses (glycotypes) incorporating CGM data, clinical features, biochemical parameters, genotype, microbiome, physical activity, sleep monitoring, and response to standardized meals may reveal different patterns of glucose dysregulation and tailor personalized diets to restore the glycemic profile.12-14
A limitation of our study is that prediabetes was diagnosed based on IFG and HbA1c, whereas OGTT was performed during the last year. Another OGTT at the screening of the population was difficult to perform, since we had to repeat an OGTT in the second day of the CGM use, which would probably discourage the participants and increased the drop-out rate. Among the strengths of our study is that contrary to the previously published papers, the participants were chosen from the general population without a specific predisposing factor like obesity or first-degree relatives with diabetes. Furthermore, the participants with prediabetes were matched in terms of age, sex, and BMI with the normoglycemic individuals, so that, contrary to the previous reports, we did not find any significant differences in the baseline characteristics. In this context, linear regression also verified our major findings. Finally, adherence to CGM wearing (median 6 days) and adherence to dietary and lifestyle pattern was high, whereas all participants followed the instructions to perform the standardized 75 g OGTT, which valuably enriched the relative CGM information and differentiates our study from previously published papers.
Conclusion
Individuals with prediabetes have different glucose profiles compared to the normoglycemic individuals. They tend to spend more time in mild-moderate hyperglycemia, they have different response during the performance of an OGTT and show more variability of their glucose levels. CGM might be helpful in those subjects with borderline glucose values between normoglycemia, prediabetes or even diabetes for a more accurate reclassification, as current glucose cutoff values cannot be always accurate keeping in mind that glucose levels are a continuum and do not represent strictly a categorical value.
Supplemental Material
sj-docx-1-dst-10.1177_19322968221123530 – Supplemental material for Difference on Glucose Profile From Continuous Glucose Monitoring in People With Prediabetes vs. Normoglycemic Individuals: A Matched-Pair Analysis
Supplemental material, sj-docx-1-dst-10.1177_19322968221123530 for Difference on Glucose Profile From Continuous Glucose Monitoring in People With Prediabetes vs. Normoglycemic Individuals: A Matched-Pair Analysis by Evangelos C. Rizos, Afroditi Kanellopoulou, Panagiotis Filis, Georgios Markozannes, Konstantinos Chaliasos, Evangelia E. Ntzani, Athina Tzamouranou, Nikolaos Tentolouris and Konstantinos K. Tsilidis in Journal of Diabetes Science and Technology
Footnotes
Guarantor
Evangelos Rizos, MD, PhD
Department of Internal Medicine, University Hospital of Ioannina, Ioannina, Greece.
School of Medicine, European University Cyprus, Nicosia, Cyprus.
Author Contributions
Declaration of Conflicting Interests
The author(s) declared no potential conflicts of interest with respect to the research, authorship, and/or publication of this article.
Funding
The author(s) disclosed receipt of the following financial support for the research, authorship, and/or publication of this article: The project is co-financed by the European Regional Development Fund of the European Union and Greek national funds through “the Operational Program Competitiveness, Entrepreneurship and Innovation (EPAnEK), NSRF 2014-2020 (Project code MIS: OΠΣ5047228)”, and “the Operational Programme Epirus 2014–2020 of the Prefecture of Epirus (Project code MIS: HΠ1AB-0028180)”.
Supplemental Material
Supplemental material for this article is available online.
References
Supplementary Material
Please find the following supplemental material available below.
For Open Access articles published under a Creative Commons License, all supplemental material carries the same license as the article it is associated with.
For non-Open Access articles published, all supplemental material carries a non-exclusive license, and permission requests for re-use of supplemental material or any part of supplemental material shall be sent directly to the copyright owner as specified in the copyright notice associated with the article.