
Abstract
Background:
Early detection of dysglycemia is important to delay the progression to diabetes. Continuous glucose monitoring (CGM) may offer advantages over current diagnostic methods for prediabetes. However, reference intervals for CGM metrics among Asians with normoglycemia (NG), and their differences compared with prediabetes, have not been well characterized.
Method:
Healthy Asian adults were classified using American Diabetes Association criteria via 75-g oral glucose tolerance test and HbA1c as NG, prediabetes, or diabetes. Participants without diabetes wore a blinded CGM device. Reference intervals (2.5th and 97.5th percentiles) for NG were determined. Continuous glucose monitoring metrics were compared between NG and prediabetes using the two-sample t-test or Mann-Whitney U test as appropriate. The area under the receiver operating characteristic (AUROC) curve and the Youden Index were used to identify optimal diagnostic thresholds for prediabetes.
Results:
Of 160 participants, one was diagnosed with diabetes. A total of 151 individuals with adequate CGM data were analyzed, including 27 participants with prediabetes (median age 32 years, BMI 22 kg/m², HbA1c 5.4%, 36 mmol/mol). Reference intervals for NG included: mean glucose (78-106 mg/dL), TIR 70 to 180 mg/dL (69%-100%), TIR 54 to 140 mg/dL (86.4%-100%), TAR >140 mg/dL (0%-9.7%), and standard deviation (10.9-25.6 mg/dL). Among CGM metrics, TAR140 had the highest AUROC at 0.72 and an optimal threshold of 5.6%.
Conclusions:
Asians with NG spend most of their time within TIR 54 to 140. TAR140 may be a useful metric for distinguishing prediabetes from NG.
Introduction
Diabetes is a rapidly escalating public health concern worldwide. 1 To address this growing diabetes pandemic, prevention efforts must focus not just on diagnosis of diabetes, but on identifying early dysglycemia. Decades-long studies on Pima Indians have identified two phases of dysglycemia preceding the diagnosis of diabetes: a slow, progressive linear phase, followed by a short, exponential phase of worsening glycemia before the onset of diabetes. Detecting dysglycemia early, during the linear phase, provides opportunities for interventions to alter disease progression. 2 The International Diabetes Federation (IDF) reports a global prediabetes prevalence of 7.5%. 3 Furthermore, studies from the United Kingdom, Biobank have shown that even prediabetes is associated with structural changes in subcortical gray matter compared with normoglycemia. 4 Research has demonstrated that intensive lifestyle modifications and weight management can effectively reduce the risk of prediabetes progressing to diabetes.5,6 Even brief periods of reverting from prediabetes to normoglycemia lower long-term diabetes risk. 7 Therefore, early identification of prediabetes is critical.
Current prediabetes diagnostic methods rely on fasting, post-glucose load or random glucose thresholds, and HbA1c. 8 These methods have several limitations, including reliance on single time-point measurements, which fail to account for intra-individual day-to-day glucose variability. Studies have shown that a single fasting glucose based classification could over diagnose normoglycemia; with about a quarter reclassified as having dysglycemia on repeat testing. 9 In addition, these tests are logistically challenging, requiring venous blood sampling, 8 to 10 hours of fasting, a 75-g glucose load, and visits to health care facilities, which restricts widespread screening. 10 Finally, threshold-based diagnoses may miss the gradual transition from normoglycemia to diabetes, potentially delaying early intervention.
Continuous glucose monitoring devices, on the other hand, record 96 to 288 readings daily for 10 to 14 days, significantly improving abnormal glycemia detection compared with current single time point assessments. Most CGM devices are self-applied at home, with data retrievable via smartphones or cloud platforms. While global CGM availability and affordability vary, this is expected to improve with increasing demand, manufacturer competition, and production scaling. 11 A similar technology transition occurred with arrhythmia detection using smartwatches, enabling large-scale implementation and early detection outside traditional clinical settings. 12
Furthermore, traditional risk factors for diabetes like body mass index (BMI), may not apply equivalently to Asians. It is well known that Asians have higher visceral adiposity for equivalent BMI compared with Caucasians. 13 Consequently, a lower BMI threshold has been recommended for screening for Asians at risk of diabetes. 14 Even within Asian ethnicities, there are pathophysiologic differences, with South Asians having a higher adiposity and lower lean mass compared with the rest. 15 Continuous glucose monitoring may offer the necessary granularity required in characterizing dysglycemia and applying ethnicity specific thresholds for identification of Asians at risk of diabetes.
The earliest sign of beta cell dysfunction in diabetes is the reduction and eventual loss of first-phase insulin response to glucose. 16 This loss means that post-carbohydrate load hyperglycemia precedes increases in fasting glucose, as postprandial glucose contributes more to HbA1c in early diabetes. 17 This suggests that postprandial hyperglycemia and increased glucose variability may be early markers of dysglycemia, but relevant thresholds in people without diabetes remain unclear. Similarly, it is uncertain which measures of glucose variability first become abnormal in prediabetes and can predict future diabetes risk.
Identifying CGM metrics that distinguish prediabetes from normoglycemia is essential for early detection and intervention. The primary objective of this study was to characterize CGM metrics in Asians with normoglycemia. The secondary objective was to compare CGM metrics between Asians with normoglycemia and prediabetes. We hypothesized that time above range (TAR) and glucose variability metrics would differ significantly between normoglycemia and prediabetes.
Methods
We conducted a prospective observational study at Singapore General Hospital, approved by the Central Institutional Review Board (CIRB No: 2024-2176). Healthy participants were recruited through social media advertisements and in-hospital posters, with individuals able to express interest via a dedicated link if they met inclusion criteria. We included Asian adults aged 21 to 65 years without known diabetes and with a body mass index (BMI) less than 30 kg/m². Pregnant and lactating women and those taking steroid medications were excluded. Recruitment occurred from April 2024 to October 2024.
After obtaining informed consent, we collected demographic data, anthropometric measurements, and medical history. Participants underwent oral glucose tolerance testing (OGTT) with 75 g of glucose, HbA1c, height and weight measurements. Based on results, participants were classified as having diabetes, prediabetes, or normoglycemia using the American Diabetes Association diagnostic criteria. Diabetes was defined as one or more values in the diabetes range (HbA1c ≥ 6.5% or fasting glucose ≥ 126 mg/dl, or two-hour post-glucose ≥ 200 mg/dl). Prediabetes was defined as one or more values in prediabetes range without any value in the diabetes range (HbA1c 5.7%-6.4%, fasting glucose > 100 mg/dl and < 126 mg/dl, or two-hour glucose > 140 mg/dl and < 200 mg/dl). Normoglycemia was defined as all values in the normoglycemia range (HbA1c < 5.7%, fasting glucose < 100 mg/dl, and two-hour glucose < 140 mg/dl). 8
Participants without diabetes wore a blinded Freestyle Libre Pro CGM device, recording interstitial glucose every 15 minutes for up to 14 days. We offered a second sensor if the first provided less than seven days of CGM data, though this was not mandatory. Participants returned glucose sensors by mail after the wear period. We downloaded all CGM data as CSV files and analyzed them using the iglu R package. 18 Missing data up to 45 minutes were interpolated, and we excluded participants with less than three days of CGM data. Seventy percent data coverage over 14 days has been recommended as optimal for diabetes. 19 However, given the lower glucose variability in prediabetes and normoglycemia, we decided to use a cut-off of three days. Data normality was assessed using the Shapiro-Wilk Test. We present normally distributed data as mean and standard deviation, mean (SD), and non-normal distributions as median with interquartile range, IQR (25th centile, 75th centile). We created ambulatory glucose profiles with cubic spline smoothing to visually represent glycemia for prediabetes and normoglycemia, depicting the 5th and 95th centiles over 24 hours. We calculated various glucose metrics: Time in Range (TIR70-180, TIR70-140, TIR54-140), Time Above Range (TAR140, TAR180), and Time Below Range (TBR70, TBR54). TIR70-140 is also known as Time in Tight Range (TITR). We also calculated mean glucose and measures of glucose variability including Standard Deviation, Mean Amplitude of Glycemic Excursion (MAGE), Continuous Overlapping Net Glycemic Action-1 hour (CONGA1), Mean of Daily Differences (MODD), and Coefficient of Variation (CV). In addition, we calculated the average duration of hyperglycemia episodes above 140 mg/dl for ≥ 30 minutes (TAR140 ≥ 30 minutes). This was based on the hypothesis that persistent elevation of glucose above 140 mg/dl is likely to indicate worse dysglycemia compared with multiple short durations of glucose above 140 mg/dl.
Comparisons between normoglycemia and prediabetes groups were performed using Student’s two-sample t-test or Mann-Whitney U test as appropriate. Area under the receiver operating characteristic (AUROC) curve analysis was applied to metrics with significant differences between groups, with optimal thresholds determined using the Youden Index. All analyses used R version 4.4.2. To study the incremental value of the CGM metric with highest AUROC, we created two logistic regression models, Model 1 with classical risk factors (age, sex, BMI and family history of diabetes) and Model 2 with additional CGM variable (Model 2 = Model 1 + CGM Variable). Comparison of the two models were done using Likelihood Ratio Test, Akaike Information Criterion (AIC) and Effect size using Odds Ratio.
Sample Size Calculation
Sample size was estimated for reference intervals of key variables using prior data 20 and assuming 95% confidence and 80% power.21,22 Required sample size for mean glucose (SD = 7 mg/dL, error = 2 mg/dL) was 48; for SD of glucose (SD = 3 mg/dL, error =1 mg/dL) was 71; for TAR140 (IQR = 0.9%-3.9%, error = 0.5%) was 76; and for TIR70-140 (IQR = 93%-98%, error = 1%) was 108 participants. Accounting for a 15% sensor error rate and 15% undiagnosed prediabetes/diabetes, we recruited 160 participants.
Results
Of the 160 recruited participants, one (0.6%) was classified as having diabetes based on HbA1c of 6.5%, 27 (16.9%) had prediabetes and 132 (82.5%) had normoglycemia. All participants without diabetes (159) proceeded with blinded CGM, however, eight participants had insufficient CGM data (< 3 days). The final analysis comprised 151 participants: 124 (82.1%) with NG and 27 (17.9%) with prediabetes. Among those with prediabetes, 21 (77.8%) were classified based on HbA1c, one based on both fasting and two-hour postprandial glucose, one based on fasting glucose only, and four based on two-hour postprandial glucose.
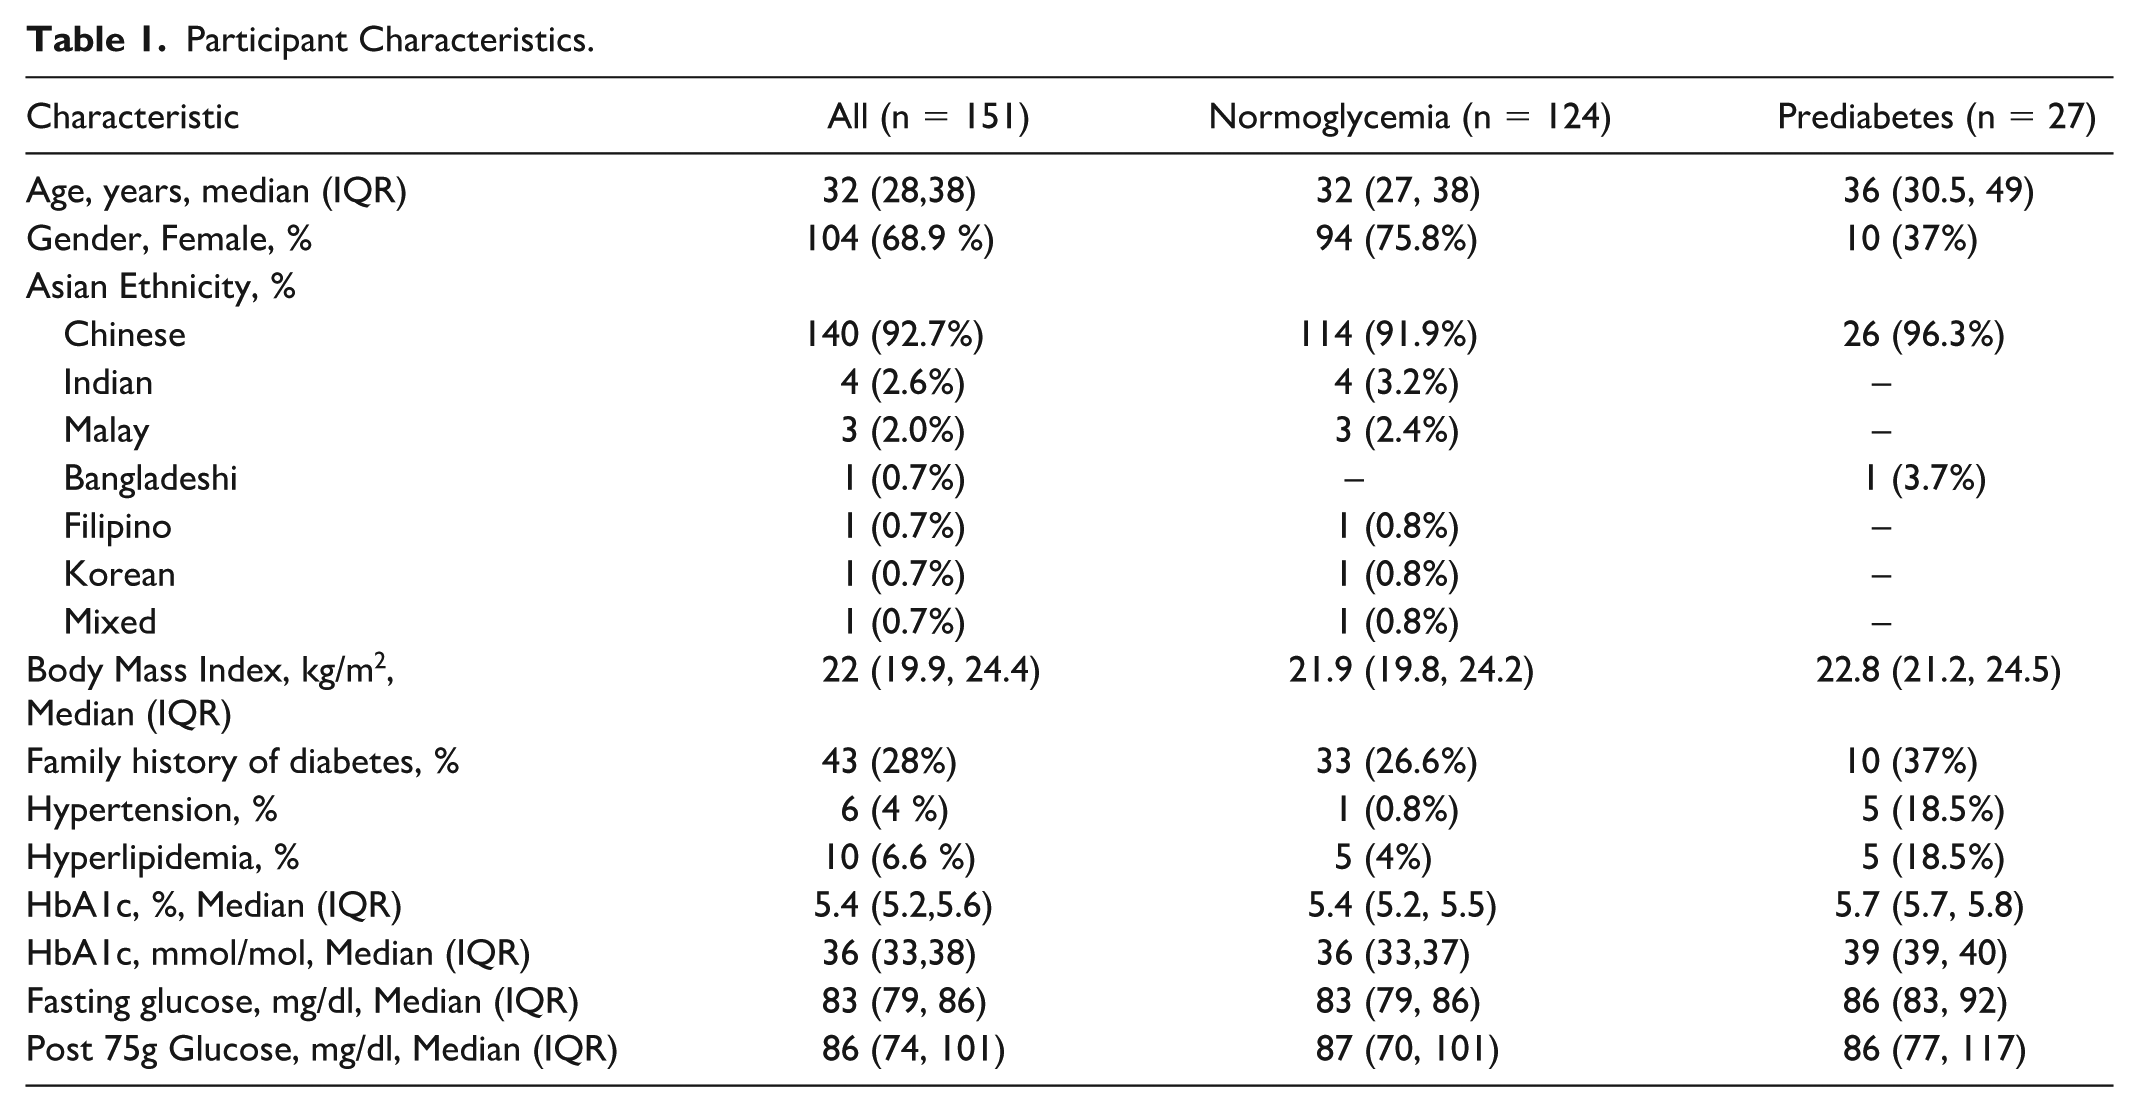
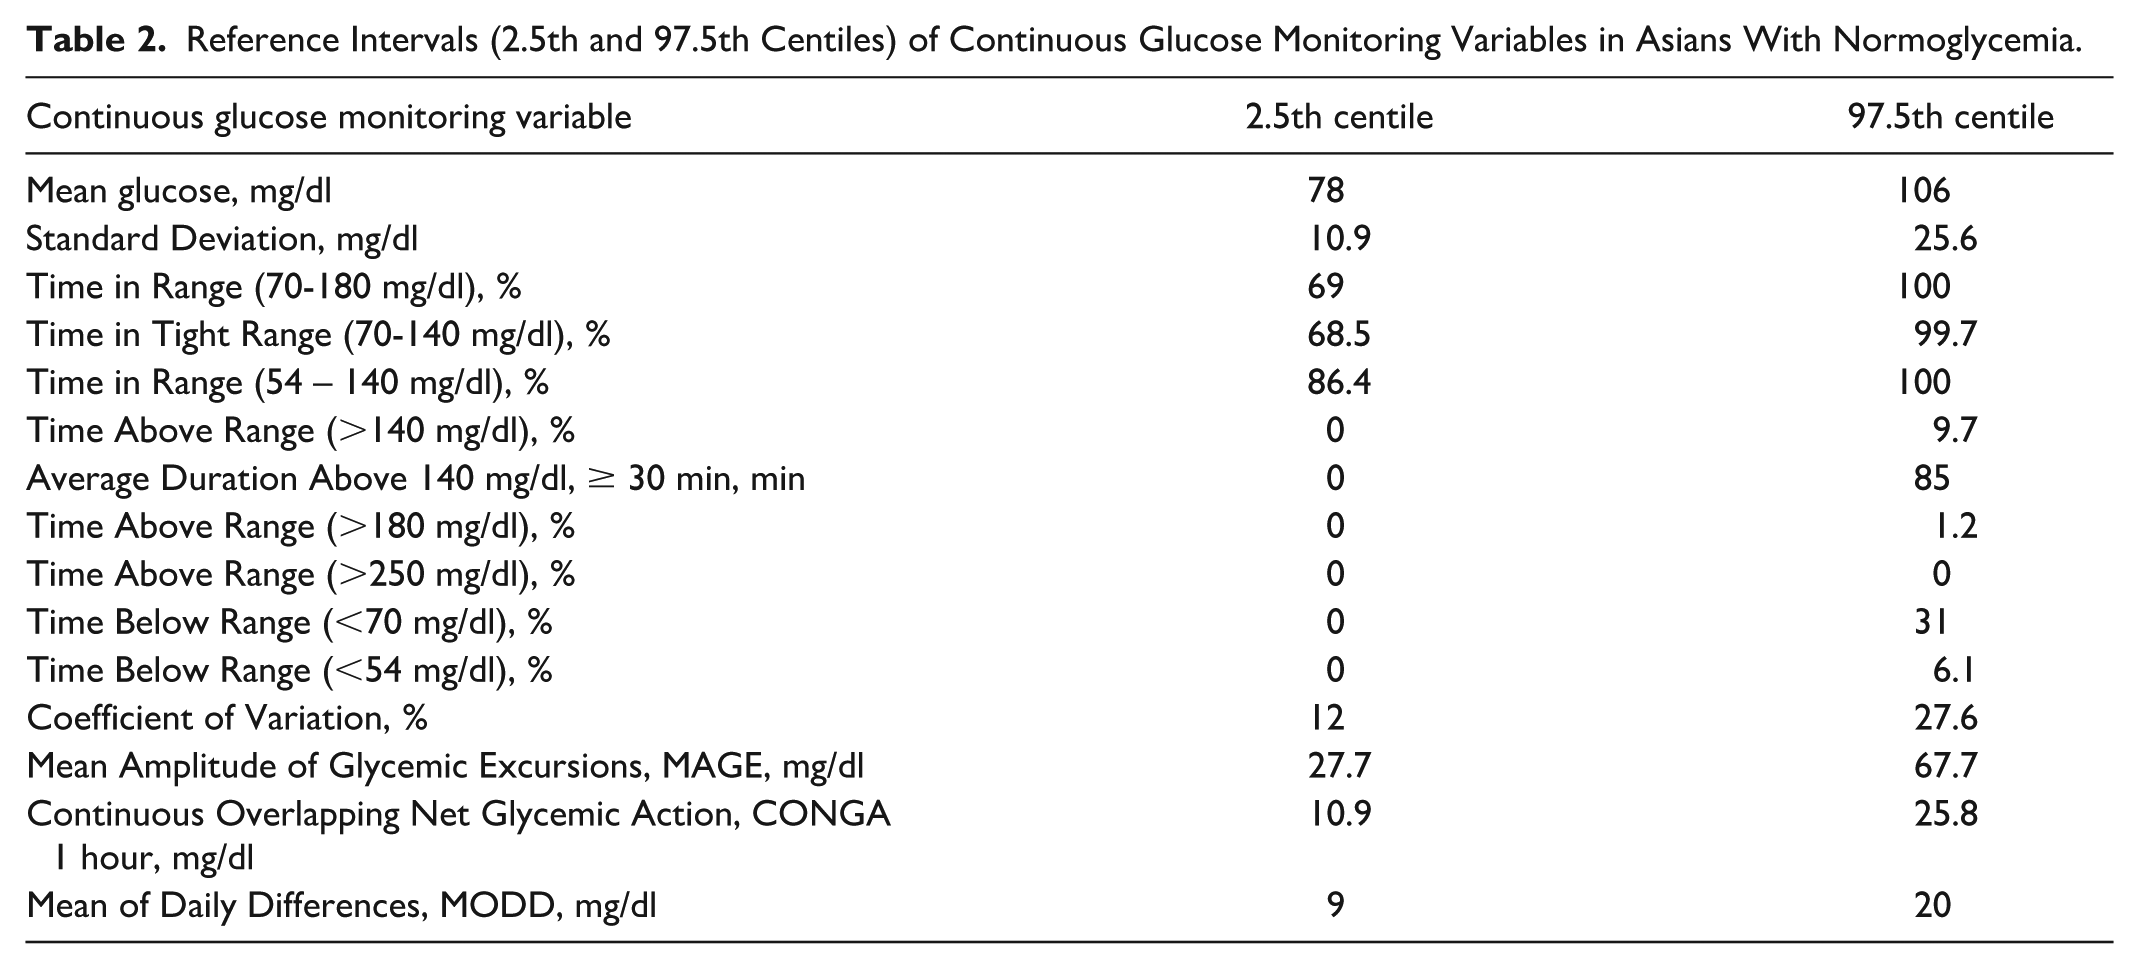
Table 1 summarizes participant characteristics. The cohort had a median age of 32 years, with women comprising 68.9% of participants. Chinese ethnicity was predominant (92.7%). Participants had a median BMI of 22 kg/m2, 28% reported a family history of diabetes, and the median HbA1c was 5.4%. Table 2 provides reference intervals (2.5th and 97.5th centiles) for normoglycemia. Mean glucose values ranged from 78 to 106 mg/dl, TIR70-180 from 69% to 100%, TBR70 from 0% to 31%, and TBR54 from 0% to 6.1%. TIR54-140 spanned from 86.4% to 100%. The mean CV in normoglycemia group was 19 (3.8)%.
Participant Characteristics.
Reference Intervals (2.5th and 97.5th Centiles) of Continuous Glucose Monitoring Variables in Asians With Normoglycemia.
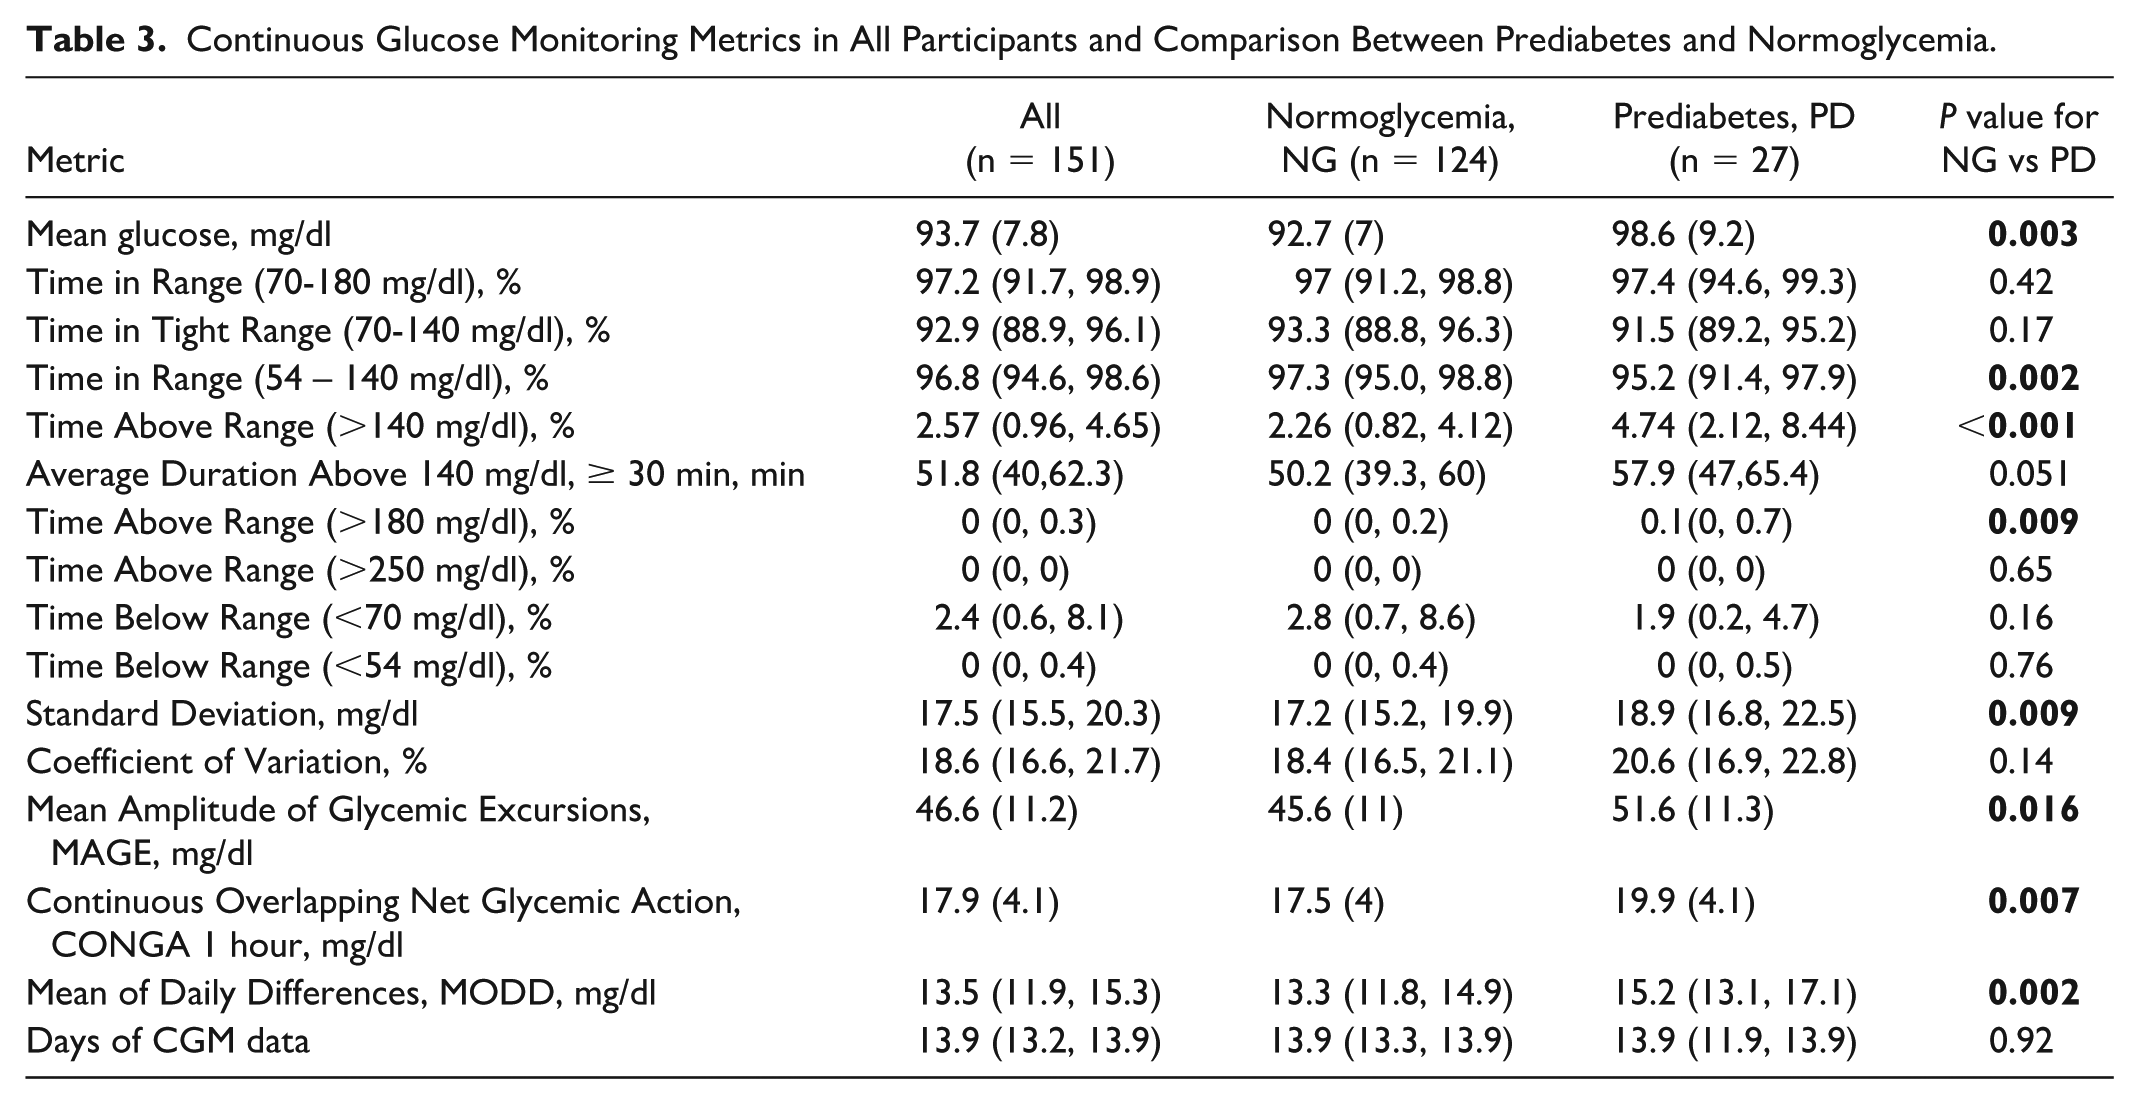
Although Ambulatory Glucose Profiles for normoglycemia and prediabetes overlapped substantially (Figure 1), participants with prediabetes spent more time above 140 mg/dL, while those with normoglycemia had more time below 70 mg/dL. Table 3 summarizes all CGM-derived metrics for normoglycemia and prediabetes. Comparing normoglycemia and prediabetes, mean glucose (98.6 vs. 92.7 mg/dL) was significantly higher in prediabetes. Measures of glucose variability (SD, MAGE, CONGA1, and MODD) were also higher in prediabetes, while CV did not differ significantly. Of the glucose range proportions, only TAR140, TAR180, and TIR54–140 significantly differed between groups. TAR180 although statistically significant was not clinically meaningful (median TAR180, normoglycemia vs prediabetes, 0% vs 0.1%).
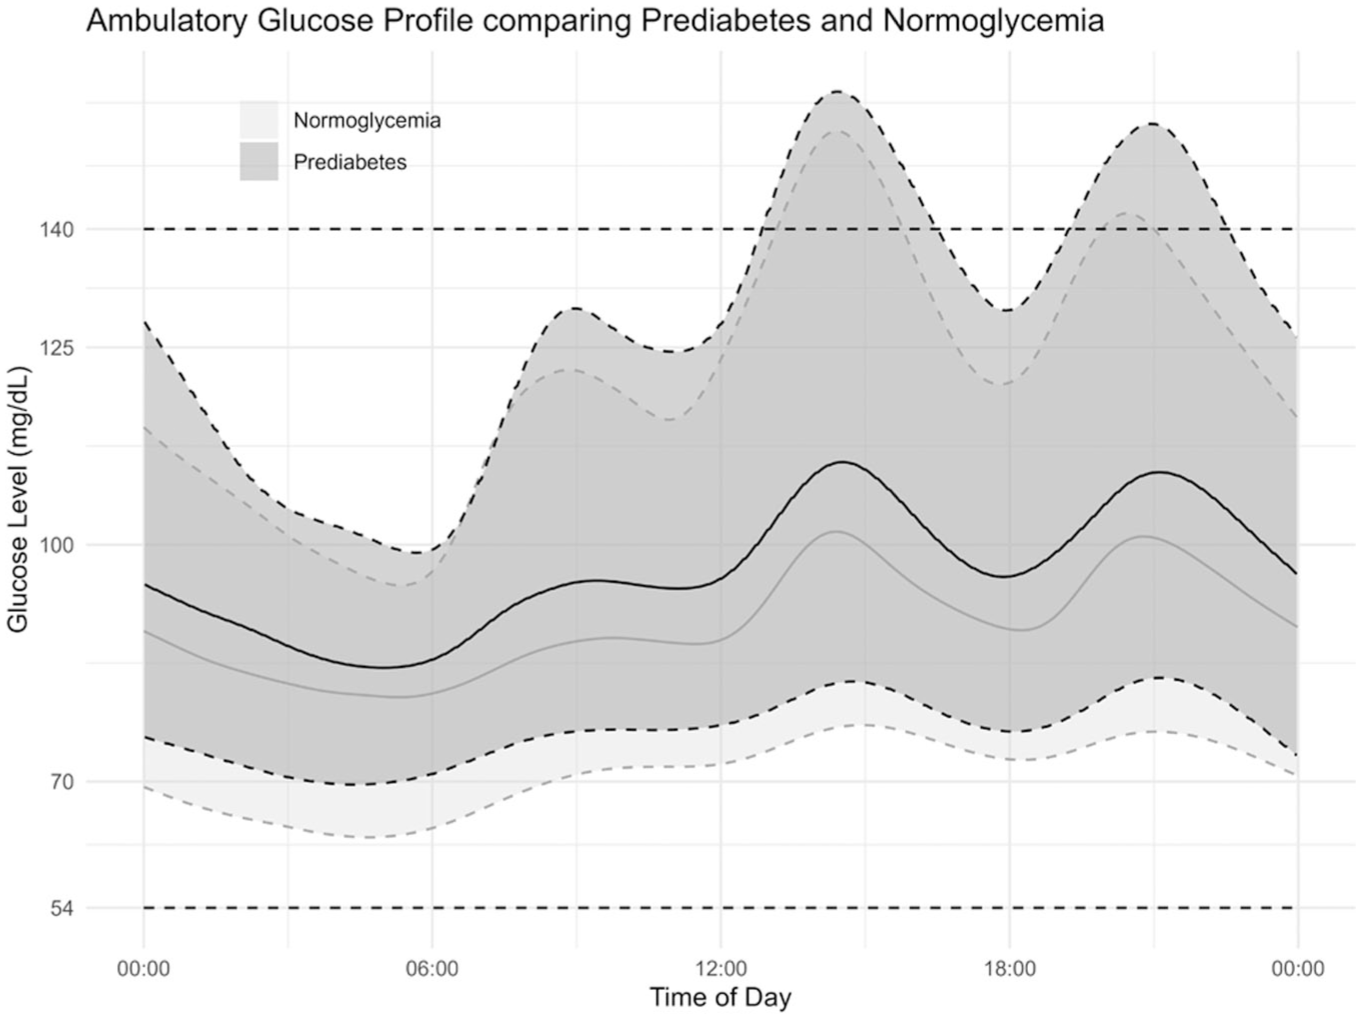
Ambulatory glucose profile of prediabetes and normoglycemia.
Continuous Glucose Monitoring Metrics in All Participants and Comparison Between Prediabetes and Normoglycemia.
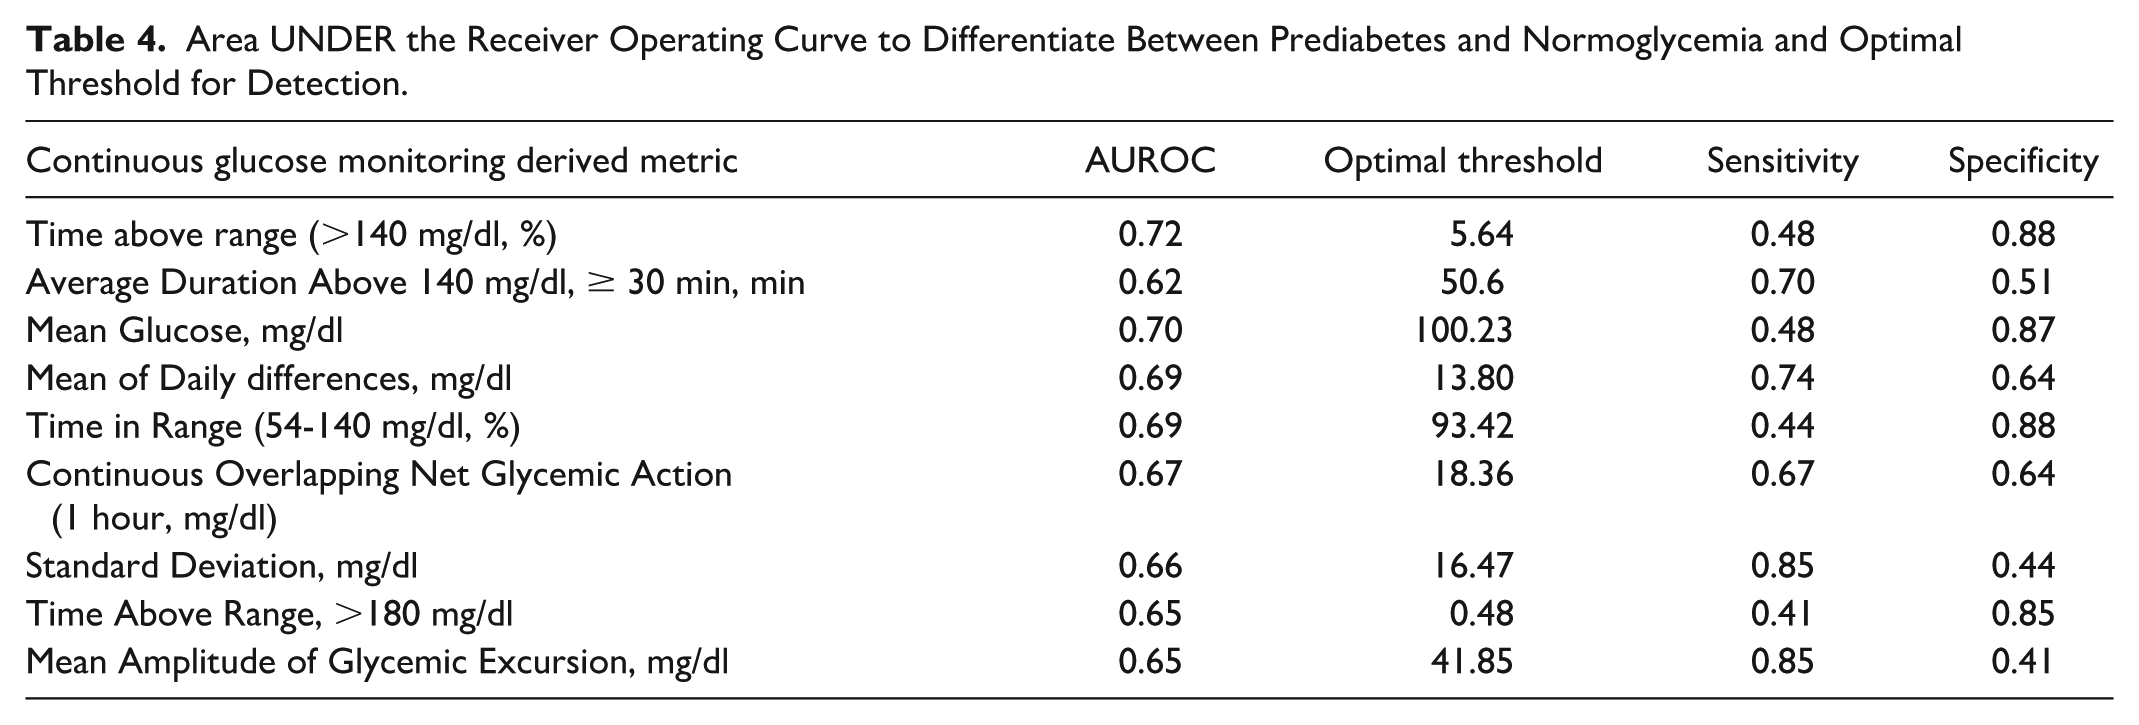
AUROC analysis assessed the ability of CGM metrics to distinguish prediabetes from normoglycemia. TAR140 achieved the highest AUROC (0.72), with an optimal threshold of 5.64% yielding 88% specificity and 48% sensitivity. Table 4 presents corresponding values for other CGM metrics. Figure 2 illustrates the significant overlap in the distribution of TAR140 across normoglycemia and prediabetes.
Area UNDER the Receiver Operating Curve to Differentiate Between Prediabetes and Normoglycemia and Optimal Threshold for Detection.
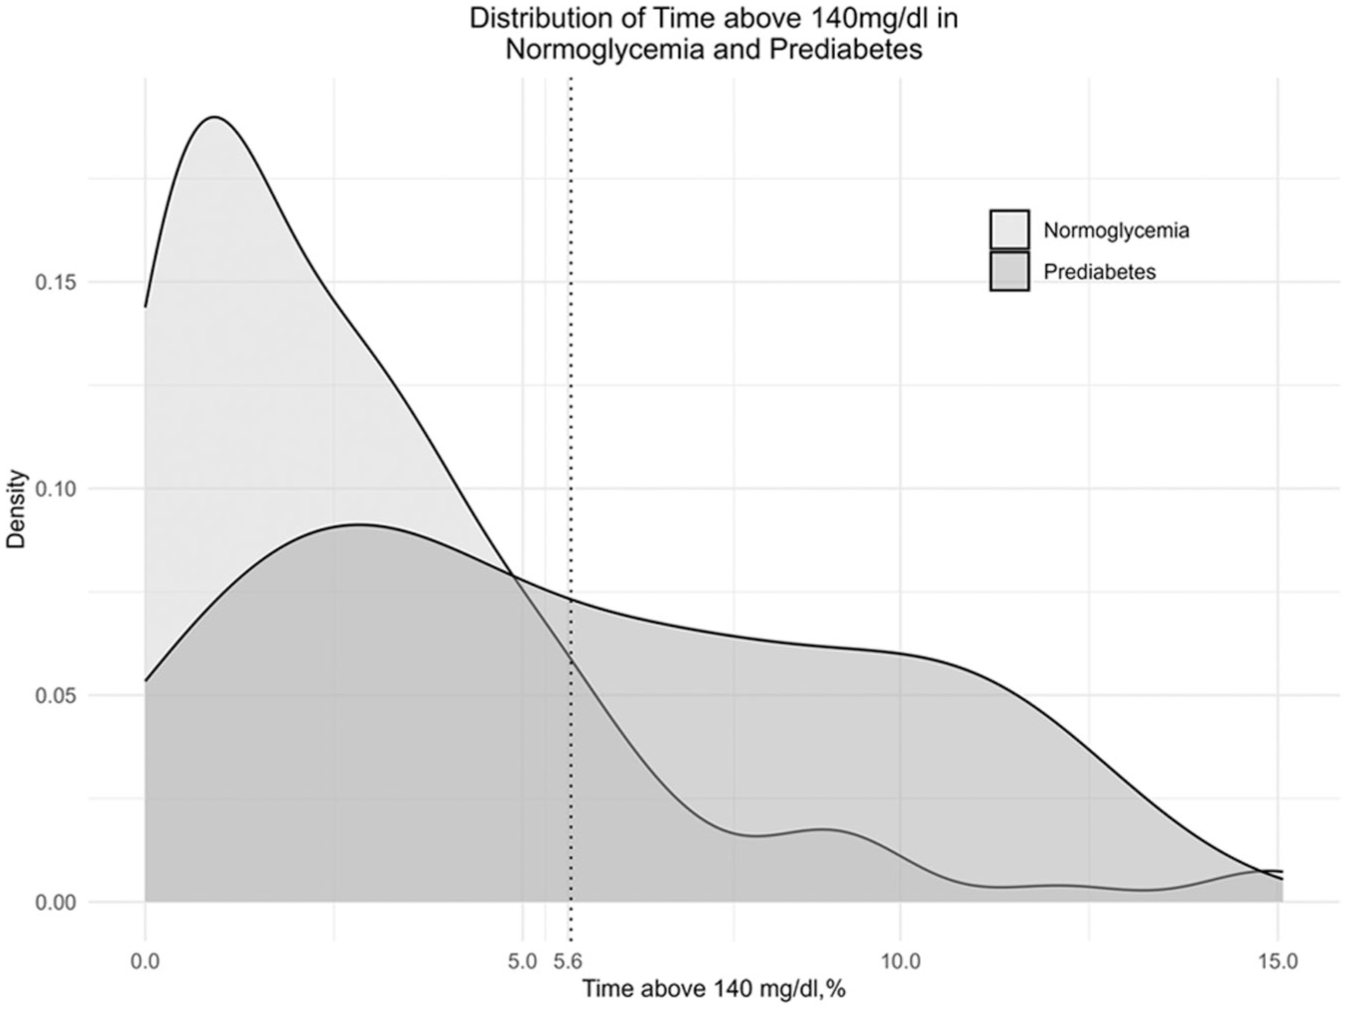
Density plot of time above 140mg/dl in people with normoglycemia and prediabetes.
We compared two logistic regression models: model 1 with classical risk factors (age, BMI, family history of diabetes) with Model 2 (Model 1 + TAR140). Adding TAR140 to the logistic regression model significantly improved prediction of prediabetes. The likelihood ratio test showed a strong model fit improvement (χ2 = 8.99, P = .0027), and the AIC decreased from 141.27 to 134.29, indicating improvement in model fit. The odds ratio for TAR140 was 1.21 (95% CI: 1.07-1.39), indicating a meaningful and statistically significant association with prediabetes after adjusting for age, BMI, and family history of diabetes.
Discussion
Key findings include a high prediabetes prevalence (16.9%) in a young, non-obese cohort from Singapore and the predominance of HbA1c-based diagnosis. Participants with normoglycemia spent more than 86% of time within TIR54-140, and TAR140 best differentiated prediabetes from normoglycemia.
Prediabetes was diagnosed using only HbA1c in most cases, indicating that relying solely on OGTT would miss many cases. In agreement with earlier Asian studies, fasting glucose is a poor discriminator, as only two participants with prediabetes had abnormal fasting glucose. 23 This is in keeping with the known pathophysiology of early beta cell dysfunction, which is the loss of first-phase insulin secretion, resulting in post prandial rather than fasting hyperglycemia. Prior studies have also shown that the use of HbA1c in addition to 75 g OGTT can greatly improve the prediction of incident rate of diabetes. 24 Despite discordant OGTT and HbA1c results, CGM metrics still identified significant dysglycemia in prediabetes. This suggests that HbA1c may detect early dysglycemia more effectively than OGTT.
Reference intervals for TIR70-180 were broad (69%-100%) due to the wide TBR70 (0%-31%) reference intervals, while those for TAR180 was narrow (0%-1.2%). Elevated TBR70 in some normoglycemia subjects may result from physiologically low fasting glucose, compression artifacts, or sensor inaccuracy at low readings.25,26 Furthermore, prior studies have shown that Freestyle Libre may have a systematic under-reporting bias compared with reference glucose readings, resulting in a higher time below range. 27 We did not exclude compression artifacts or sensor-related hypoglycemia to reflect real-world CGM use. However, the narrow reference interval of TBR54 (0%-6.1%) suggests that TBR54 might be a more suitable hypoglycemia marker for non-diabetes populations consistent with prior studies.20,28,29 The use of TBR54 will overcome some of the current limitations of CGM systems that may contribute to a higher TBR70, which may induce potentially unnecessary evaluations in people without diabetes and low risk of hypoglycemia. Furthermore, given that TAR180 was minimal, an optimal glucose interval to report for people without diabetes may be TIR54-140, as suggested and reported in other studies.28,29 Indeed 97.5% of people with normoglycemia spent more than 86.4% of the time in TIR54-140, with a median TIR54-140 of 97.3%. A study from Bulgaria using Freestyle Libre Pro, and using OGTT and HbA1c to classify glycemic status of participants found very similar data for TIR54-140 (97% in normoglycemia and 93.9% in prediabetes, significantly different between groups) and TAR140 (2.1% in normoglycemia and 5.1% in prediabetes, significantly different between groups). 30 Another study from Spain using Medtronic iPro2 for 7 days using HbA1c and fasting plasma glucose to classify glycemic status also reported a TAR140 of 1.2% in normoglycemia and 3.6% in prediabetes, significantly different between groups. 31 Thus, like our findings, TAR140 and TIR54-140 been shown to be different between normoglycemia and prediabetes.
Our Asian cohort’s TIR70-180 and TAR180 metrics were comparable to those found in a large cohort of non-Hispanic White Americans (n = 560) 32 and another smaller American cohort (n = 153) with a similar mean age of 32. 20 Median TBR70 was numerically higher in our study (2.8% vs 0.91 and 1.1%, respectively). When compared specifically to the smaller cohort of mostly White participants with a similar mean age, we observed lower mean glucose (93 vs 99 mg/dl) but similar standard deviation (17.2 vs 17 mg/dl), and lower median TIR54-140 (93 vs 99%). 20 However, these previous studies used less stringent criteria to define glycemic status, relying on historical data and self-reports 32 or HbA1c alone. 20 On the other hand, our cohort with normoglycemia was defined by a 75 g OGTT and HbA1c and this might have resulted in a lower mean glucose (92.7 mg/dl) compared with the American cohorts (114 and 99 mg/dl).20,32 Second, the higher TBR70 in our study could also contribute to an overall lower mean glucose and account for the differences.
Prediabetes was characterized by higher mean glucose, Standard Deviation, TAR140, MAGE, MODD, CONGA1, and lower TIR54-140. The CV showed no significant difference, due to similar proportional increases in both mean glucose and standard deviation in prediabetes compared with normoglycemia. These findings are supported by prior studies finding similar significant differences between prediabetes and normoglycemia in mean glucose,30,31,33,34 SD,31,33,34 MAGE, 31 ,33 -35 CONGA1, 30 TAR140,30,31 TIR54-140. 30 Unlike our study, a couple of studies did find %CV to be higher in prediabetes compared with normoglycemia.30,33 MODD has not been reported by majority of the studies.
However, a significant difference from prior studies reporting cohorts of prediabetes was the BMI. The BMI of prediabetes cohorts ranged from 29.3 kg/m2 in a largely non-Hispanic white cohort, 32 31 kg/m2 in a Spanish population based random sample, 31 and 30.3 kg/m2 in a study from Bulgaria. 30 In contrast our prediabetes cohort had a BMI of just 22.8 kg/m2. This highlights the well-known phenomenon of the thin-fat Asian phenotype, due to the higher visceral adiposity even at a lower BMI and the consequent higher risk of prediabetes and diabetes. 36
AUROC curve analysis revealed that TAR140 (>5.6%) and mean glucose (>100 mg/dl) were the most effective metrics for distinguishing prediabetes from normoglycemia, with 87-88% specificity but modest sensitivity (48%). Indeed, TAR140 had considerable overlap in the distribution between groups. TAR140 has gained attention in defining normoglycemia and predicting type 1 diabetes progression in people with at least one positive autoantibody. 37 We found that 97.5% of normoglycemia participants had TAR140 <9.7%. However, as is evident from Figure 2, a 10% threshold would have high specificity but low sensitivity due to the significant overlap in TAR140 between normoglycemia and prediabetes. AUROC analysis identified an optimal cut off at 5.6, however this had very low sensitivity at only 48%. TAR140_>30 minutes did not perform better than TAR140. However, it should be noted that Freestyle Libre Pro only provides sensor glucose every 15 minutes and hence underestimates the duration of all threshold-based metrics. CGMs with sensor glucose values generated every 5 minutes or 1 minute may improve the discriminatory value of these metrics. The optimal thresholds for detection of prediabetes and future incident diabetes need to be tested in larger longitudinal cohorts.
Extension of the use of CGM to people with normoglycemia and prediabetes have multiple benefits. Firstly, this may lead to improved and early diagnosis of those at risk of future diabetes. The current methods of fasting, 2-hour post glucose load and HbA1c have multiple limitations, as discussed. In addition, interpersonal and day-to-day variability makes a single test-based diagnosis prone to misclassifications. 9 Furthermore, the diagnostic accuracy and relationship to cardiovascular risk vary between fasting and postprandial glucose. Only postprandial glucose is associated with cardiovascular risk. 38 The use of a CGM allows for interrogation of fasting, postprandial and mean glycemia simultaneously. CGM could also be used as a therapeutic intervention for personalized lifestyle and dietary intervention. Studies show that factors like age, BMI, gut-microbiome and even genetics may affect the postprandial glucose responses. 39 Hence, CGM could be used to guide a personalized approach to dietary intervention. It could also form the basis for motivation to sustain lifestyle and dietary changes as improvements in glycemia are evident to the user within days as opposed to months in the setting of HbA1c guided interventions. 39
Our study’s strengths include its moderate sample size and prospective classification using both HbA1c and oral glucose tolerance testing. Limitations include underrepresentation of non-chinese Asian ethnicities, use of an uncalibrated CGM system with a potential under-reporting bias, 27 lack of islet cell autoantibody assessment and the lack of evaluation of red blood cell metrics for any potential interference with the HbA1c levels. Furthermore, we did not collect data on time of meals, and hence specific postprandial glycemic assessments from CGM could not be done. Finally, as our cohort was relatively young, our findings may not apply to older Asian cohorts. Thus, all these limitations must be considered while extrapolating our findings to other Asian cohorts.
Future studies in Asian cohorts should attempt more balanced representation of multiple Asian ethnicities and explore the differences between fed vs fasting state and day versus night time in CGM metrics. 40
Conclusion
Asians with normoglycemia maintain their glucose levels predominantly within the range of 54 to 140 mg/dl. Time above range 140 mg/dl (TAR140) shows promise as a discriminative metric for identifying prediabetes from normoglycemia.
Footnotes
Acknowledgements
Authors acknowledge the use of Chat GPT and Copilot to correct spelling and grammatical mistakes and improve the clarity of the manuscript. All output from these AI tools have been thoroughly reviewed and validated by authors.
Abbreviations
AUROC, area under the receiver operating curve; CGM, continuous glucose monitoring; CONGA, continuous overlapping net glycemic action; CV, coefficient of variation; HbA1c, glycated hemoglobin; MAGE, mean amplitude of glycemic excursion; MODD, mean of daily differences; NG, normoglycemia; OGTT, oral glucose tolerance test; TAR, time above range; TBR, time below range; TIR, time in range.
Declaration of Conflicting Interests
The authors declared the following potential conflicts of interest with respect to the research, authorship, and/or publication of this article: SRC and DG declare participation in advisory boards and receipt of speaker fees from Abbott Diabetes Care, Medtronic, and Dexcom.
Funding
The authors disclosed receipt of the following financial support for the research, authorship, and/or publication of this article: The study was supported by grants from the National Medical Research Council, Singapore (Center Grant—CGOct23S09).