
Abstract
Background:
The glycemia risk index (GRI) is a composite metric developed and used to estimate quality of glycemia in adults with diabetes who use continuous glucose monitor (CGM) devices. In a cohort of youth with type 1 diabetes (T1D), we examined the utility of the GRI for evaluating quality of glycemia between clinic visits by analyzing correlations between the GRI and longitudinal glycated hemoglobin A1c (HbA1c) measures.
Method:
Using electronic health records and CGM data, we conducted a retrospective cohort study to analyze the relationship between the GRI and longitudinal HbA1c measures in youth (T1D duration ≥1 year; ≥50% CGM wear time) receiving care from a Midwest pediatric diabetes clinic network (March 2016 to May 2022). Furthermore, we analyzed correlations between HbA1c and the GRI high and low components, which reflect time spent with high/very high and low/very low glucose, respectively.
Results:
In this cohort of 719 youth (aged = 2.5-18.0 years [median = 13.4; interquartile range [IQR] = 5.2]; 50.5% male; 83.7% non-Hispanic White; 68.0% commercial insurance), baseline GRI scores positively correlated with HbA1c measures at baseline and 3, 6, 9, and 12 months later (r = 0.68, 0.65, 0.60, 0.57, and 0.52, respectively). At all time points, strong positive correlations existed between HbA1c and time spent in hyperglycemia. Substantially weaker, negative correlations existed between HbA1c and time spent in hypoglycemia.
Conclusions:
In youth with T1D, the GRI may be useful for evaluating quality of glycemia between scheduled clinic visits. Additional CGM-derived metrics are needed to quantify risk for hypoglycemia in this population.
Introduction
The glycemia risk index (GRI) is a composite metric that facilitates clinicians’ use of continuous glucose monitor (CGM) data to efficiently and holistically characterize an individual’s “quality of glycemia”—ie, the amount of time that an individual’s sensor glucose level is very low/low (<54 mg/dL; <3.0 mmol/L and 54-<70 mg/dL; 3.0-3.9 mmol/L) or high/very high (>180-250 mg/dL; >10.0-13.9 mmol/L and >250 mg/dL; >13.9 mmol/L). 1 To develop the GRI, 330 clinicians ranked, from most optimal to least optimal quality of glycemia, CGM tracings from 225 adults with diabetes. Clinicians’ rankings were principally based on their assessments of the following two “components” of glycemia: (1) a low component, comprised of time spent with very low/low sensor glucose and (2) a high component, comprised of time spent with high/very high sensor glucose. A GRI score is calculated as the weighted sum of time spent in each component of glycemia, where time spent in hypoglycemic states is weighted more heavily than time spent in hyperglycemic states. The GRI more strongly correlates with clinicians’ rankings of individuals’ quality of glycemia than do other CGM-derived metrics (eg, time in target range). 1 It can also be used to reliably discern optimal from suboptimal glycemic control in adults with type 1 diabetes (T1D)2-4 and type 2 diabetes. 5
Although the GRI is known to accurately describe glycemia quality in adults with T1D during the one- to two-week time frame during which the glucose data used to calculate the GRI were collected, little is known about whether the GRI correlates with other measures of metabolic control (eg, glycated hemoglobin A1c [HbA1c]) assessed over time, especially among youth. Studies in youth with T1D have evaluated the impact of changes in diabetes care modalities (eg, initiation of hybrid closed-loop therapy) on youths’ GRI scores and HbA1c.6-14 Prior research also demonstrates the prognostic significance of HbA1c for predicting risk for T1D-associated complications. 15 Therefore, positive correlations existing between an individual’s GRI score and longitudinal HbA1c measures may analogously suggest that the GRI holds predictive potential (similar to that of HbA1c) for identifying individuals who are at risk for suboptimal near- and long-term health outcomes.
As the rate of CGM device adoption by youth with T1D continues to increase, the use of the GRI is also likely to increase. 16 This, in turn, will afford clinicians additional opportunities to evaluate youths’ glycemia quality between regularly scheduled diabetes clinic visits and HbA1c measurements, which typically occur at least 90 days apart. As the GRI is increasingly used to evaluate individuals’ glycemia quality between clinic visits, care providers will have the opportunity to engage at-risk individuals in more timely interventions that can reduce risk for both short- and long-term complications of T1D.
To test the hypothesis that the GRI correlates positively with longitudinal HbA1c measures, we used electronic health record and CGM device data to evaluate correlations between youths’ GRI scores at baseline and HbA1c results obtained at baseline (0 months) and 3, 6, 9, and 12 months later. Furthermore, we examined correlations between the low component (ie, time spent in very low/low hypoglycemic range) of each youth’s baseline GRI score and their longitudinal HbA1c measures (at 0, 3, 6, 9, and 12 months). We also analyzed correlations between the high component (ie, time spent in high/very high hyperglycemic range) of each youth’s baseline GRI and their longitudinal HbA1c measures (at 0, 3, 6, 9, and 12 months).
Methods
Data Source and Cohort Selection
We extracted data from electronic health records for 2606 youth with T1D who used CGM devices and received care from a network of pediatric diabetes clinics in the Midwest USA between March 2016 and May 2022. Data from CGM devices were collected via an application programming interface (API) or exported as flat files and then stored in a secure cloud storage account. Individuals included in the analysis met the following criteria: (1) CGM wear time ≥50% during the seven-day window used to calculate a baseline GRI score; (2) T1D duration ≥1 year; (3) age ≤18 years; (4) HbA1c measurement within three weeks (±21 days) of the baseline GRI score calculation; (5) minimum of 2 follow-up HbA1c measurements within a 386-day window; and (6) no HbA1c measurements missing at 2 or more consecutive timepoints (ie, for those that did not have HbA1c measurements at all five timepoints) (Figure 1).
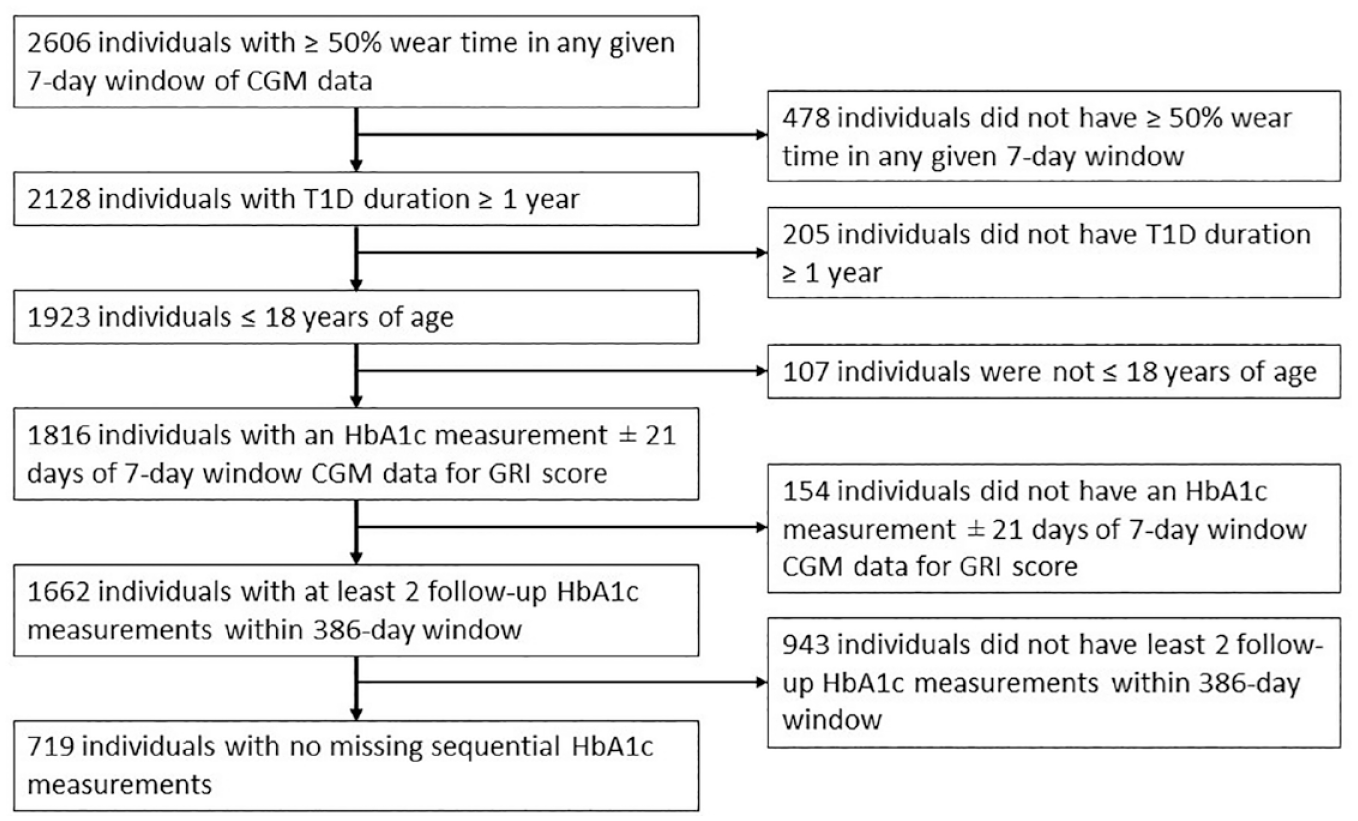
Cohort identification flowchart.
Cohort Characteristics
We used seven days of CGM data to calculate baseline GRI scores. We calculated CGM wear time as the number of glucose measurements that were recorded by the CGM device divided by the maximum number of glucose measurements that could have been recorded by the device, per the type of device used. Glycemia risk index was calculated according the equation described by Klonoff et al. 1 The investigators who originally developed the GRI elected to cap GRI scores at 100, even though GRI scores >100 are mathematically possible. 1 We elected to not cap GRI scores, given that alteration of outliers could artificially decrease GRI variability and thereby affect correlations between GRI scores and HbA1c. Of note, GRI scores can also be stratified into ranked zones or quintiles (A-E; Figure 2). Glycemia risk index scores in the highest quintiles reflect suboptimal glycemia while GRI scores in the lowest quintiles reflect optimal glycemia.
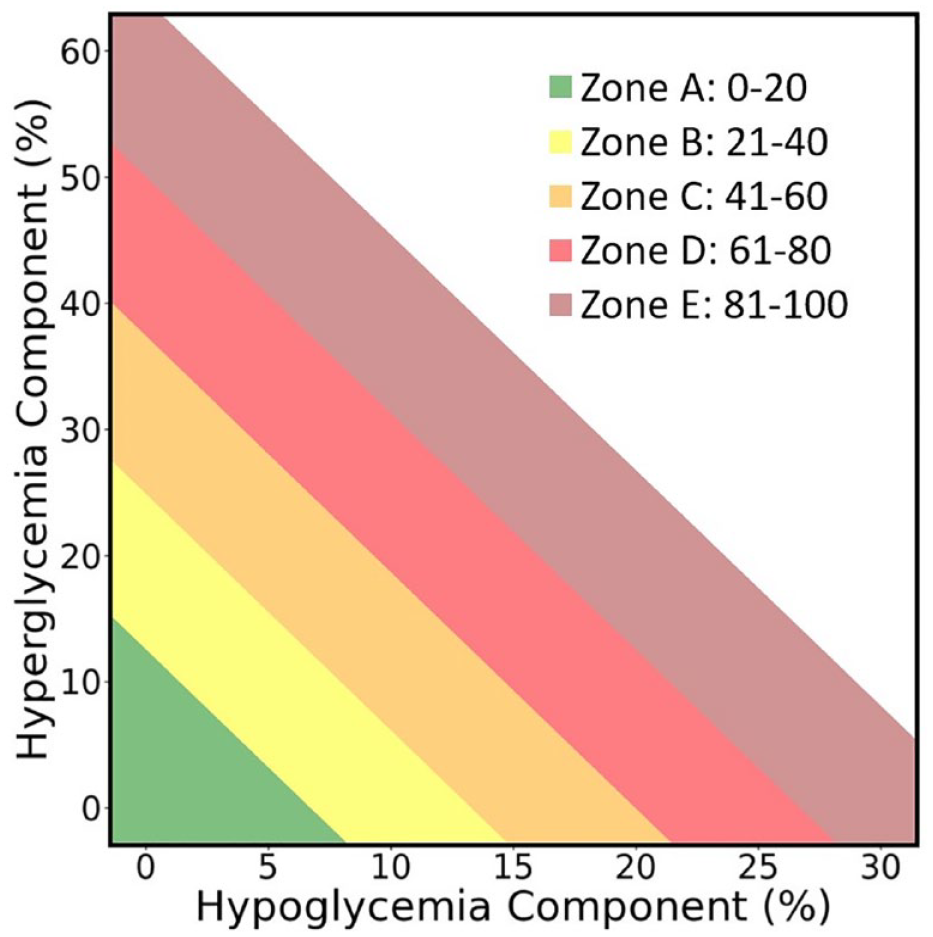
Representation of the glycemia risk index (GRI) grid, adapted from Klonoff et al. This representation of the GRI grid displays the GRI quintiles; however, it is not based on data from this study or on data from the original paper. GRI scores appearing in the lowest quintile (Zone A) reflect optimal glycemia. GRI scores appearing in all subsequent zones (ie, Zones B-E) reflect increasingly suboptimal GRI scores.
Baseline GRI scores were only calculated during seven-day windows that occurred within three weeks (±21 days) of an HbA1c measurement, and the seven-day window closest in time to the HbA1c measurement was selected when multiple windows were possible. The first day of the seven-day window served as the GRI score date. Thereafter, we also assessed follow-up HbA1c measures documented 3, 6, 9, and 12 months after baseline. We allowed longitudinal HbA1c measurements to occur within 386 days (rather than within 365 days) of each other to allow for instances where the baseline HbA1c measurement was recorded up to three weeks after the date of the baseline GRI score calculation. Figure 3 depicts the timeline used to calculate GRI scores and assess subsequent HbA1c measurements. For each 12 month time window, we calculated a single GRI score at baseline. Although most individuals were represented in the data set a single time, 154 individuals had sufficient data to examine multiple 12 month time windows.
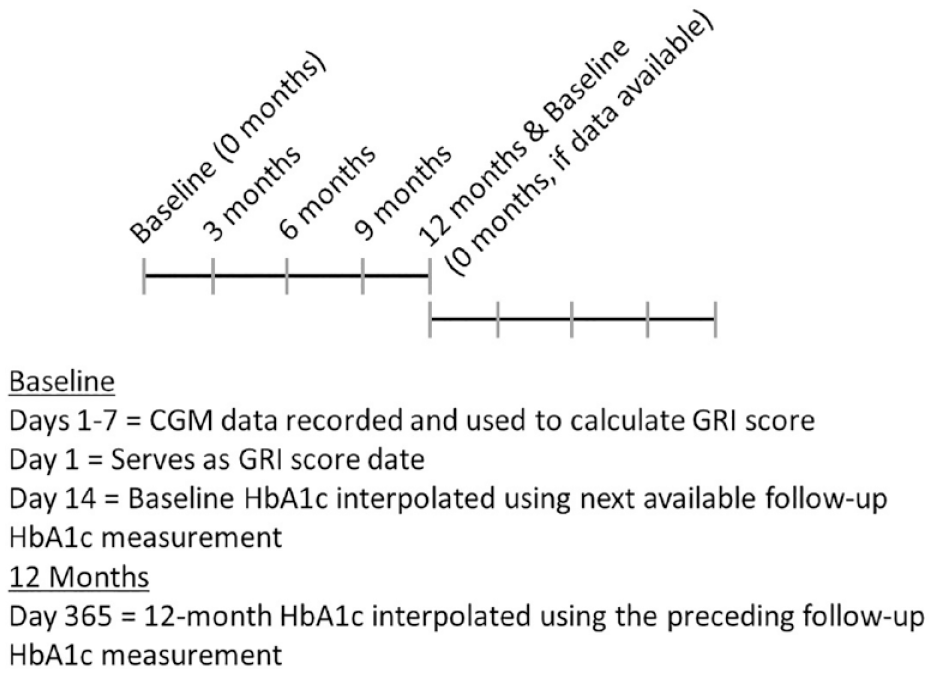
Timeline of GRI score calculation and HbA1c follow-up measurements. GRI and HbA1c windows were generally structured to prevent overlapping. The only exception to this was in instances where a given 12 month measure met inclusion criteria that allowed it to also serve as a baseline measure for a subsequent longitudinal time window among individuals with sufficient data to allow examination of multiple time windows.
Individuals with diabetes often have HbA1c measures every three to four months; however, in real-world data, the actual timepoints at which HbA1c results are documented can vary substantially within and across individuals. We therefore used an imputation procedure (see Supplemental Materials) to interpolate/extrapolate baseline and 12-month follow-up HbA1c values (but not 3-, 6-, or 9-month HbA1c values). This imputation procedure resulted in (1) all baseline HbA1c values having the same relative “starting point” (relative to the date on which the GRI score was calculated) and (2) all 12 month HbA1c values being spaced equally from the baseline “starting point.”
Clinical data were coded and collected in an institutional review board–approved research data repository (IRB #11120355) that met the requirements for a waiver of written informed consent. This study followed the Strengthening the Reporting of Observational Studies in Epidemiology (STROBE) reporting guideline. 17
Statistical Analysis
Analyses were conducted in R (Version 4.1.2-1.2004.0). 18 Pearson pairwise correlations were used to examine the relationship between the baseline GRI and HbA1c at 0, 3, 6, 9, and 12 months. Any non-sequentially missing HbA1c values were treated as such and ignored in the Pearson pairwise correlation calculations. We also examined the correlations between the high and low components of the baseline GRI and HbA1c measures over time.
We then conducted a series of sensitivity analyses to evaluate the impact of various cohort selection criteria on correlations observed between GRI scores and HbA1c (Supplemental Tables 1–6). First, we assessed the impact on correlations observed when GRI scores were capped at 100—per the original paper that introduced the GRI metric. 1 In our primary analysis, 108 of 901 GRI scores (12.0% of all observations) were ≥100; therefore, in this first sensitivity analysis, these 108 scores were adjusted to 100 (Supplemental Table 1). Second, we assessed the impact on correlations observed when only a single (ie, the most recent) GRI score for each person was analyzed. Our primary analysis included 719 individuals; therefore, 719 observations (ie, one per person) were included in this sensitivity analysis (Supplemental Table 2). Third, we assessed the impact on correlations observed when only non-interpolated HbA1c measurements and GRI scores were analyzed (Supplemental Table 3). Fourth, we explored the impact on correlations observed when the required threshold for CGM wear time was increased to 50% to 70% (Supplemental Table 4) and then to ≥70% (Supplemental Table 5), given previous studies’ use of these thresholds for CGM wear time.19-21 Finally, we examined correlations between GRI equation components (eg, the correlation between the Very Low Weight [3.0 × percent time spent in <54 mg/dL or <3.0 mmol/L]) and HbA1c to better understand the GRI score equation weighting factors (Supplemental Table 6).
Results
We analyzed data for 901 longitudinal (ie, 12 month) time windows for 719 individuals. Demographic characteristics of the cohort (N = 719) are reported in Table 1. Comparisons to the original population of CGM users’ demographic and glycemic characteristics are included in the Supplemental Materials (Supplemental Table 7). Mean (SD) GRI was 64 (29), which corresponds to Zone D of the GRI quintiles. At baseline, mean (SD) HbA1c was 8.1% (1.4) (10.3 mmol/L, (2.23)).
Participant Demographics.
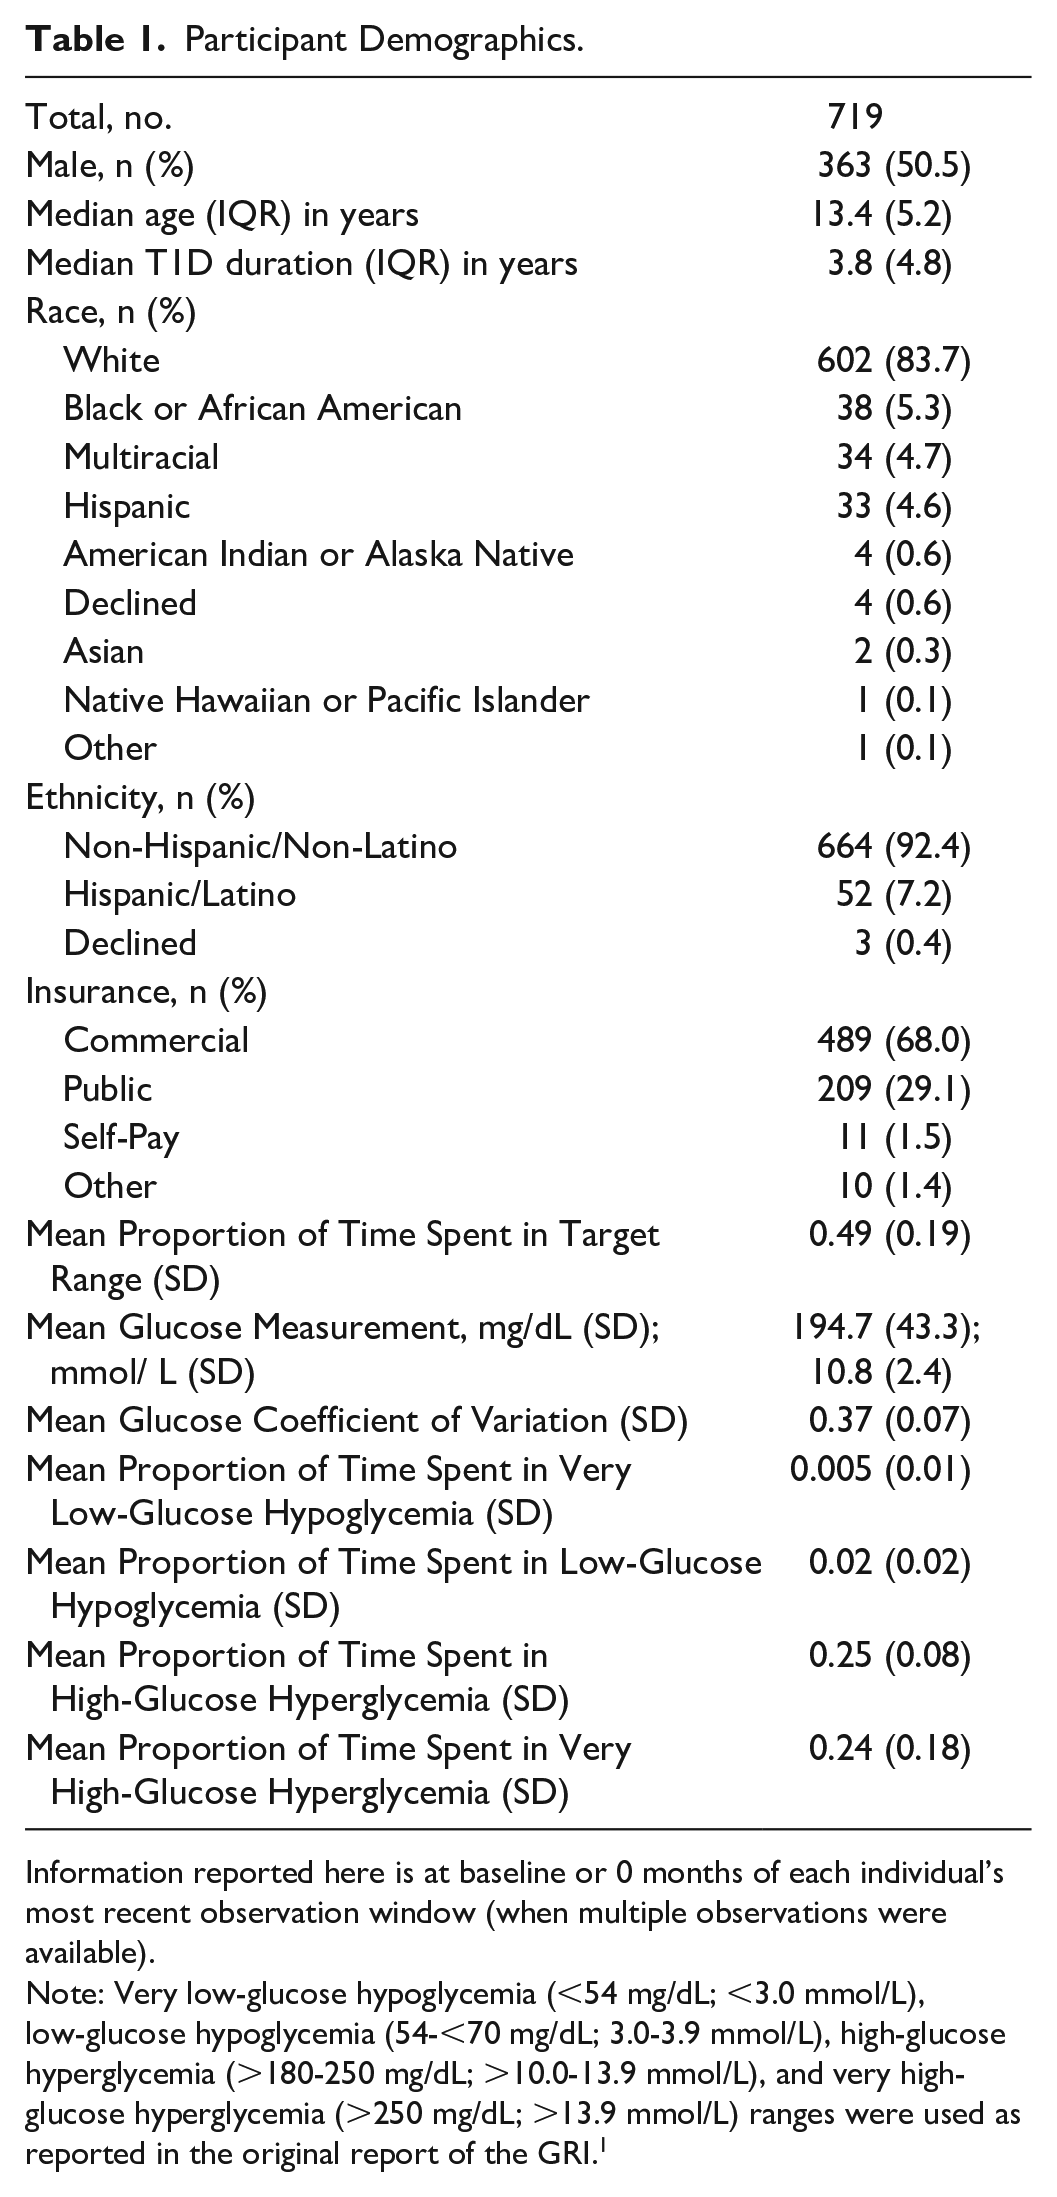
Information reported here is at baseline or 0 months of each individual’s most recent observation window (when multiple observations were available).
Note: Very low-glucose hypoglycemia (<54 mg/dL; <3.0 mmol/L), low-glucose hypoglycemia (54-<70 mg/dL; 3.0-3.9 mmol/L), high-glucose hyperglycemia (>180-250 mg/dL; >10.0-13.9 mmol/L), and very high-glucose hyperglycemia (>250 mg/dL; >13.9 mmol/L) ranges were used as reported in the original report of the GRI. 1
The GRI score at baseline positively correlated with HbA1c at baseline (r = 0.68, 95% confidence interval CI = [0.65, 0.72]). The GRI also positively correlated with HbA1c measures at 3 months (r = 0.65, 95% CI = [0.60, 0.70]), 6 months (r = 0.60, 95% CI = [0.54, 0.66]), 9 months (r = 0.57, 95% CI = [0.52, 0.62]), and 12 months (r = 0.52, 95% CI = [0.47, 0.57]). Correlations between the GRI score at baseline and longitudinal HbA1c measurements are shown in Table 2.
Correlations Between GRI at Baseline and HbA1c Measurements Over Time.
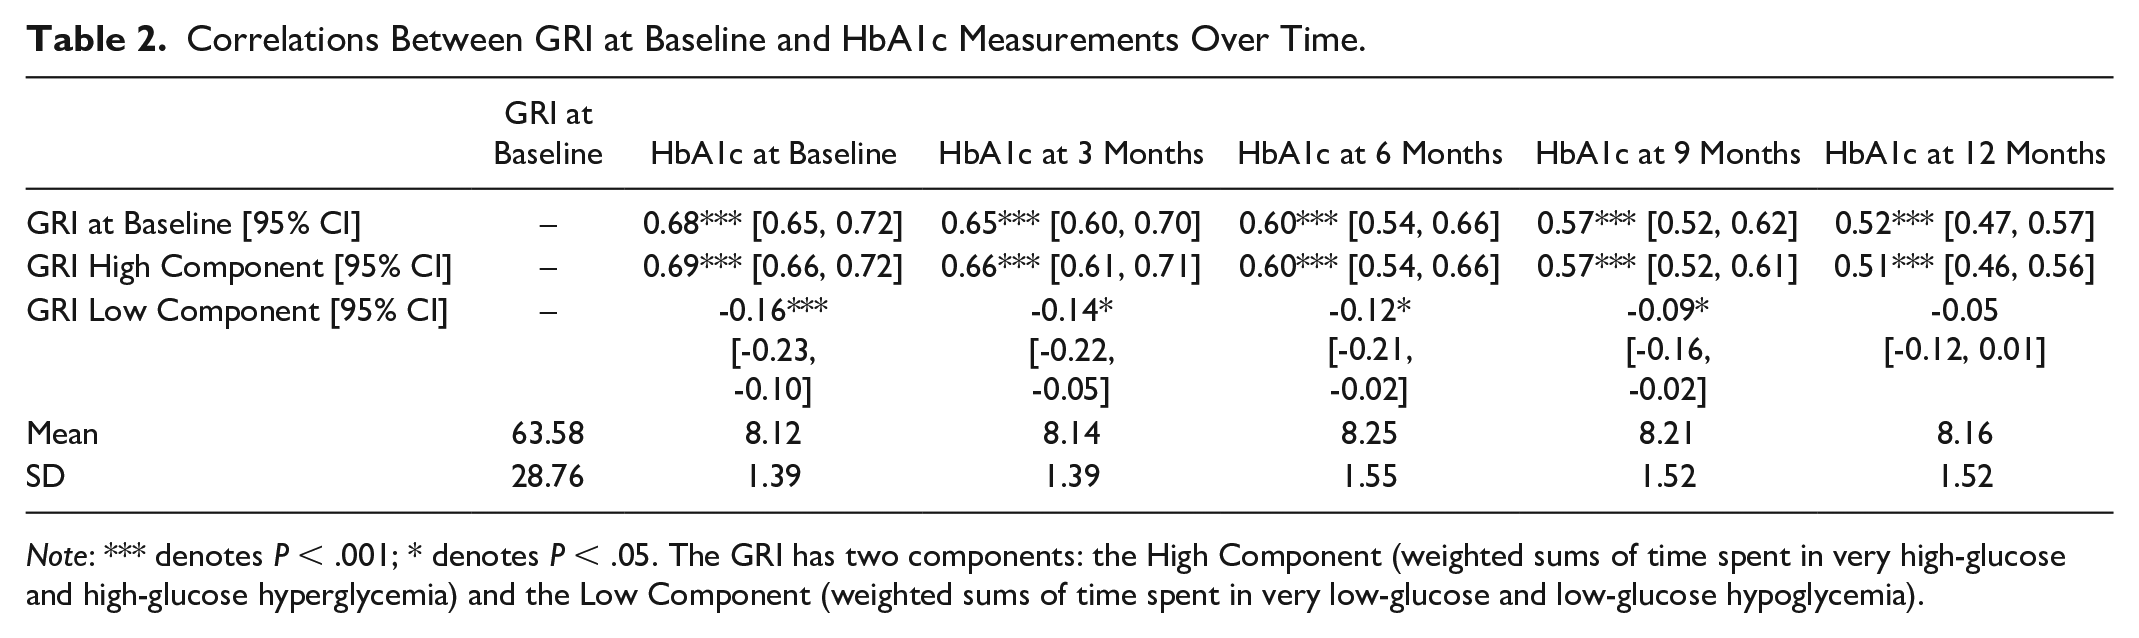
Note: *** denotes P < .001; * denotes P < .05. The GRI has two components: the High Component (weighted sums of time spent in very high-glucose and high-glucose hyperglycemia) and the Low Component (weighted sums of time spent in very low-glucose and low-glucose hypoglycemia).
The high component of baseline GRI demonstrated substantial positive correlation with HbA1c measures at 0 months (r = 0.69; 95% CI = [0.66, 0.72]), 3 months (r = 0.66; 95% CI = [0.61, 0.71]), 6 months (r = 0.60; 95% CI = [0.54, 0.66]), 9 months (r = 0.57; 95% CI = [0.52, 0.61]), and 12 months (r = 0.51; 95% CI = [0.46, 0.56]) (Table 2). Correlations observed between the low component of baseline GRI scores and HbA1c measures were negative, and also weaker, at 0 months (r = −0.16, 95% CI = [−0.23, −0.10]), 3 months (r = −0.14, 95% CI = [−0.22, −0.05]), 6 months (r = −0.12, 95% CI = [−0.21, −0.02]), and 9 months (r = −0.09, 95% CI = [−0.16, −0.02]). At 12 months, the correlation between the two (r = −0.05, 95% CI = [−0.12, 0.01]) was not statistically significant.
Results from the sensitivity analyses were similar, in both direction and strength, to those observed in the primary analysis. We found that capping the GRI, including only the most recent observation for each individual, analyzing only raw (vs interpolated) HbA1c measures, and increasing the threshold for CGM wear time did not substantially alter our results (Supplemental Tables 1–5). We observed similar longitudinal correlations when comparing GRI equation components’ correlations with HbA1c to overall GRI score correlations with HbA1c (Supplemental Table 6).
Discussion
In youth with T1D, we found that seven-day GRI scores positively correlated with concurrent HbA1c measurements. The GRI also positively correlated with HbA1c measurements 3, 6, 9, and 12 months later. We identified strong and consistently positive correlations between the GRI high component and HbA1c over time, whereas the low component only weakly (and negatively) correlated with HbA1c at 0, 3, 6, and 9 months; at 12 months, no correlation was observed.
This study supports and extends previous work examining GRI in youth with T1D. Previous research showed a positive correlation between a single HbA1c measurement and a single GRI score calculated from four weeks of CGM data preceding the HbA1c measurement in 1067 children with T1D in Italy. 8 This study supports and extends earlier findings over a 12 month time window and in a US-based cohort. Taken together, GRI adequately describes glycemia quality in youth with T1D.
This study is the first to examine the relationship between HbA1c and the GRI high and low components. One prior study did show that the GRI high component, but not the low component, was significantly different between pediatric individuals using CGM with multiple daily injections versus those using hybrid closed-loop systems. 8 Similarly, GRI zones stratify adults with T1D based on time spent in high and very high-glucose ranges but not in low and very low-glucose ranges. 2 We conclude that further research is needed to understand how to best present the GRI to clinicians and individuals with T1D to adequately convey the risk to safety from hypoglycemia, particularly in youth with T1D. Youth with T1D may experience severe hypoglycemia more often than adults with T1D,16,22 which may be due in part to increased variability in blood glucose levels, and frequent fluctuations between high and low blood glucose levels may offset any effect of hyperglycemia on HbA1c. Previous research showed that risk of severe hypoglycemia and hypoglycemic coma was relatively the same across different HbA1c levels in youth with T1D, 23 and results of a recent literature review on established CGM-derived metrics suggest that no single composite metric sufficiently conveys overall glycemia, especially risk of hypoglycemia. 24 The GRI (with the current weight applied to the low/very low component) is not likely to adequately distinguish between youth who are and are not at risk of hypoglycemia, necessitating further research to better understand how to best educate individuals with T1D on the GRI and its utility. Sensitivity analyses comparing GRI equation components suggest the GRI may benefit from further weight being placed on time spent in low-glucose (54-<70 mg/dL) and very low-glucose (<54 mg/dL), as doing so may result in increased sensitivity of the GRI to this component of glycemia in youth with T1D (see Supplemental Materials). Clinicians may opt to use the GRI to stratify youth by level of priority for outreach during remote patient monitoring programs such as those incorporated into the 4T study. 25 Using the GRI to stratify risk may be an improvement over using time spent in target range or other pre-defined risk thresholds. Future research may also consider evaluating the stability of GRI scores over time to identify youth at risk of hypoglycemia based on increasing GRI scores or longitudinal variability in GRI scores.
The ease of obtaining GRI scores presents a major advantage to its use. Recent research suggests that a sampling duration of only 7 to 14 days of CGM data is needed to provide a stable estimate of GRI when compared with GRI scores calculated from 90 days of CGM data from adults with T1D. 26 Given that GRI scores can be calculated using one or two weeks of CGM data with no additional measures or laboratory work necessary, it is possible that the GRI may serve as an adequate proxy for HbA1c in situations where HbA1c cannot otherwise be obtained. The GRI may therefore provide additional value to clinicians and to individuals with T1D who agree to participate in a remote monitoring program between clinic visits. It is important to note that the metric is easily obtainable after handling the complexity of ingesting and managing CGM data in near real-time for diabetes centers. After the initial investment of technical infrastructure, in many cases, CGM data and CGM-derived metrics like GRI and Ambulatory Glucose Profile metrics 27 can be accessed remotely, allowing for review without the individual needing to travel to the clinic. In addition, CGM use is increasing among youth with T1D, 16 making GRI an increasingly relevant metric for evaluating glycemia. Our results suggest that the GRI positively correlates with HbA1c over time; therefore, GRI scores may be used to evaluate glycemic control in between HbA1c measurements, and potentially as part of an approach to forecast future glycemic control in youth.
Importantly, the GRI yields additional information, above and beyond time in range (TIR), the most commonly used CGM-derived metric. The precise reason that an individual experiences low TIR (ie, increased time in hypoglycemia vs hyperglycemia) is not elucidated by the TIR metric, and identification of individuals with low TIR due to hypoglycemia can be complicated by the much higher incidence of low TIR that occurs due to time spent in hyperglycemia. With appropriate weighting, the GRI can be fine-tuned to readily identify and stratify such risk—particularly in populations with elevated risk of low TIR due to hypoglycemia (eg, youth and older adults). Timely monitoring of glycemia quality may foster timely interventions to reduce the near-term and long-term risks of hyperglycemia and hypoglycemia.
It is important to note several limitations when considering the current results. First, as the GRI metric was developed using CGM tracings from adults with different types of diabetes (only some of whom had T1D), components used to calculate the GRI may require different weightings that are specific to youth with T1D. In addition, we examined the relationship between a single GRI score and HbA1c measures over the subsequent 12 months in a convenience sample from a tertiary care diabetes clinic network. However, the number and timing of follow-up HbA1c measures resulted in a relatively small cohort of individuals relative to the original population from the clinic network. The cohort was also limited to individuals with CGM wear time of ≥50%, so the GRI may not be accurately descriptive for individuals with low CGM wear time. Sensitivity analyses (see Supplemental Materials) showed that the correlations between GRI scores and HbA1c at 0, 3, 6, 9, and 12 months did not differ when examining observations with wear time ≥50%, 50% to 70%, or ≥70%. In addition, we did not examine GRI and HbA1c in the first year following T1D diagnosis. Further research is needed to determine whether GRI describes glycemia quality during this window, which often includes a “honeymoon period” where individuals may experience a partial remission of symptoms and require a reduced amount of insulin. 28 Finally, the retrospective analysis approach may introduce bias in sampling. In the current report, we chose not to cap GRI scores to help mitigate any artificial deflation of variability in the cohort. Sensitivity analyses (see Supplemental Information) showed that the correlations between GRI scores and HbA1c at 0, 3, 6, 9, and 12 months were not different when the GRI was capped at 100 vs when the GRI was not capped at 100. In larger population health studies, it remains possible that capping the GRI may artificially decrease variability. Further research in larger populations is needed to determine whether the GRI should be capped in youth with T1D.
Conclusions
The GRI, an easily obtainable metric of glycemic control in individuals who use CGM, positively correlates with HbA1c at baseline AND over a 12 month window in youth with T1D. The GRI may be useful for assessing the quality of glycemia between clinic visits and HbA1c measurements; it may also be used in a risk-stratified fashion to identify individuals with suboptimal glycemic control. It is not unexpected that the low component of the GRI was weakly and negatively correlated with HbA1c, but the GRI as it is currently calculated may be limited in its ability to identify youth at risk for hypoglycemia, particularly if clinics stratify patients by GRI score in order to determine how to prioritize outreach and intervention efforts. Improved monitoring of glycemia quality may enable more timely initiation of interventions designed to reduce risk for both short- and long-term complications of T1D.
Supplemental Material
sj-docx-1-dst-10.1177_19322968241247219 – Supplemental material for Correlation Between the Glycemia Risk Index and Longitudinal Hemoglobin A1c in Children and Young Adults With Type 1 Diabetes
Supplemental material, sj-docx-1-dst-10.1177_19322968241247219 for Correlation Between the Glycemia Risk Index and Longitudinal Hemoglobin A1c in Children and Young Adults With Type 1 Diabetes by Kelsey Panfil, Jacob M. Redel, Craig A. Vandervelden, Brent Lockee, Anna R. Kahkoska, Erin M. Tallon, David D. Williams and Mark A. Clements in Journal of Diabetes Science and Technology
Footnotes
Acknowledgements
The authors thank Susana Patton, PhD (Nemours Children’s Health, Jacksonville, FL, USA) Cinyta Schweisberger, DO (Children’s Mercy Kansas City, Kansas City, MO, USA), Rona Sonabend, MD (Texas Children’s Hospital, Houston, TX, USA; Baylor College of Medicine, Houston, TX, USA), and David Klonoff, MD (Mills-Peninsula Medical Center, San Mateo, CA, USA) for providing feedback related to this work.
Abbreviations
CGM, continuous glucose monitor; GRI, glycemia risk index; HbA1c, glycated hemoglobin A1c; MDI, multiple daily injections; T1D, type 1 diabetes; TIR, time in range.
Author Contributions
KP contributed to formal analysis, writing—original draft, and writing—review and editing. JMR contributed to writing—review and editing. CAV contributed to data curation and writing—review and editing. BL contributed to conceptualization, writing—review and editing, and supervision. ARK contributed to writing—review and editing. EMT contributed to writing—review and editing. DDW contributed to writing—review and editing. MAC contributed to conceptualization, funding acquisition, writing—review and editing, and supervision.
Declaration of Conflicting Interests
The author(s) declared the following potential conflicts of interest with respect to the research, authorship, and/or publication of this article: MAC receives consulting fees as Chief Medical Officer for Glooko, Inc and receives research support from Abbott Diabetes Care and Dexcom. Other authors have no conflicts of interest related to this work.
Funding
The author(s) disclosed receipt of the following financial support for the research, authorship, and/or publication of this article: This study was funded by the Leona M. and Harry B. Helmsley Charitable Trust foundation (grants G-2017PG-T1D019 and 2008-04043). ARK is supported by the National Center for Advancing Translational Sciences, National Institutes of Health, through Grant K12TR004416. The content is solely the responsibility of the authors and does not necessarily represent the official views of the NIH. ARK also reports receiving research grants from the Diabetes Research Connection and the American Diabetes Association, and a prize from the National Academy of Medicine, outside the submitted work.
ORCID iDs
Data Sharing Statement
The data that support the findings of this study are available from the corresponding author, MAC, upon reasonable request.
Supplemental Material
Supplemental material for this article is available online.
References
Supplementary Material
Please find the following supplemental material available below.
For Open Access articles published under a Creative Commons License, all supplemental material carries the same license as the article it is associated with.
For non-Open Access articles published, all supplemental material carries a non-exclusive license, and permission requests for re-use of supplemental material or any part of supplemental material shall be sent directly to the copyright owner as specified in the copyright notice associated with the article.