
Abstract
Background:
Continuous glucose monitoring (CGM) has transformed the care of type 1 and type 2 diabetes, and there is potential for CGM to also become influential in prediabetes identification and management. However, to date, we do not have any consensus guidelines or high-quality evidence to guide CGM goals and metrics for use in prediabetes.
Methods:
We searched PubMed for all English-language articles on CGM use in nonpregnant adults with prediabetes published by November 1, 2023. We excluded any articles that included subjects with type 1 diabetes or who were known to be at risk for type 1 diabetes due to positive islet autoantibodies.
Results:
Based on the limited data available, we suggest possible CGM metrics to be used for individuals with prediabetes. We also explore the role that glycemic variability (GV) plays in the transition from normoglycemia to prediabetes.
Conclusions:
Glycemic variability indices beyond the standard deviation and coefficient of variation are emerging as prominent identifiers of early dysglycemia. One GV index in particular, the mean amplitude of glycemic excursion (MAGE), may play a key future role in CGM metrics for prediabetes and is highlighted in this review.
Keywords
Introduction
As of 2021, there were an estimated 97.6 million adults in the United States, 1 and 464 million people worldwide,2 with prediabetes. It is projected that 638 million individuals will be affected by prediabetes globally by 2045. 2 Prediabetes is an intermediate stage of glucose dysregulation between a normoglycemic state and type 2 diabetes mellitus (T2DM). We currently define glycemic status categorically into normoglycemia, prediabetes, and diabetes based on static diagnostic measures of glucose assessment. There are various diagnostic criteria for prediabetes, differing slightly among the American Diabetes Association (ADA), the World Health Organization (WHO), and the International Expert Committee definitions. In the ADA 2024 standards of care, the criteria for a diagnosis of prediabetes are a fasting plasma glucose (FPG) of 100 to 125 mg/dl, a hemoglobin A1c (HbA1c) of 5.7% to 6.4%, or a plasma glucose of 140 to 199, 2 hours after a 75 g oral glucose tolerance test (OGTT). 3 The WHO published a report titled “Definition and Diagnosis of Diabetes Mellitus and Intermediate Hyperglycemia” in 2006 in which intermediate hyperglycemia is defined as FPG of 110 to 125 mg/dl or a plasma glucose of 140 to 199 mg/dl 2 hours after a 75 g OGTT. 4 The International Expert Committee defines prediabetes as an A1c of 6.0% to 6.4%. 5
Each of the above tests, FPG, A1c, and OGTT, may diagnose different populations of individuals with prediabetes since there is considerable discordance between these tests. This discordance likely exists because each of these tests provides different information about glycemic exposure. 6 Fasting plasma glucose reflects hepatic insulin resistance, 7 whereas A1c reflects average blood glucose levels over the last three months (which includes fasting and postprandial glucoses), and OGTT measures postprandial glucose following ingestion of a specific glucose load. Furthermore, prediabetes can be subclassified into impaired fasting glucose (IFG) when FPG is in the prediabetes range and/or into impaired glucose tolerance (IGT) when glucose on OGTT is in the prediabetes range. A graphical representation of these overlapping and distinct populations is found in Figure 1. Studies vary widely in the estimates of how discordant these laboratory tests are. A study from the National Health and Nutrition Examination Survey (NHANES) data sets examined 7412 US adults who each had an A1c, FPG and OGTT performed. 8 Using the A1c screening approach, 29.9% of participants were classified with prediabetes, while using FPG classified 41% and OGTT 16.5%. For all glycemic categorizations, overall (normal, prediabetes, and diabetes) OGTT and A1c had a kappa concordance index of 0.355, and OGTT and FPG had a kappa of 0.310. In a study of 3523 participants in Vietnam, A1c classified 34.6% of participants as having prediabetes whereas FPG only classified 6.3%. 9 A smaller study in Thailand (N = 512) showed that 45.9% compared with 37.3% of the same subjects were classified as having prediabetes by A1c and OGTT, respectively, and the kappa concordance index for prediabetes classification with these two tests was only 0.154. 10
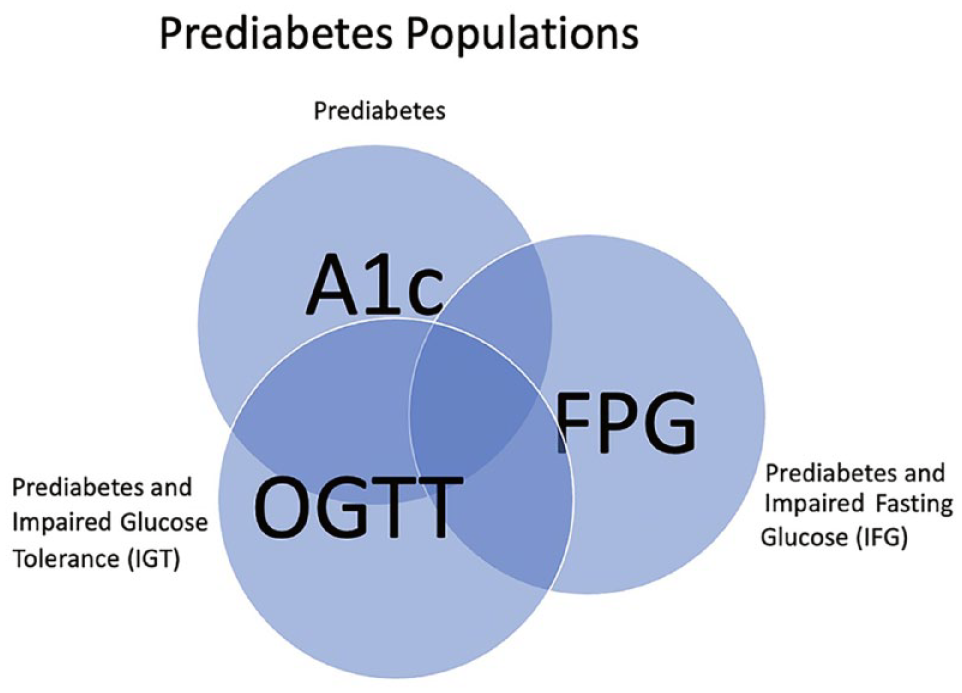
An illustration of the concordance (overlapping sections) and discordance (sections without overlap) in A1c, OGTT, and FPG in diagnosing prediabetes. This is a conceptual illustration only and the size of overlapping sections is not proportional to rates of inter-test concordance.
The reported rates of progression from prediabetes to diabetes vary but in the US Diabetes Prevention Program (DPP), the incidence of diabetes in the placebo arm was 62% at 15 years of follow-up. 11 Diabetes prevention trials for those with prediabetes have also been conducted in many other countries. For example, in the control arm of a program in China, the cumulative incidence of diabetes conversion from prediabetes was 67.7% after six years. 12 In a program in Finland, the cumulative incidence of diabetes in the control arm was 23% after four years 13 and in a study done in India, it was 55% after three years. 14
Prediabetes is associated with an increased risk of both the microvascular and macrovascular complications of diabetes. In the US DPP, 7.9% of participants with prediabetes had retinopathy at baseline 15 and in a metanalysis of prospective studies, the hazard ratio (HR) for chronic kidney disease associated with prediabetes compared with normoglycemia ranged from 1.09 to 1.50 depending on the prediabetes definition used. 16 National Health and Nutrition Examination Survey data also demonstrate a modest increase in peripheral neuropathy in prediabetes compared with normoglycemia. 17 With respect to macrovascular complications, a metanalysis of 53 prospective studies showed that prediabetes is associated with an increased risk of composite cardiovascular outcomes (varied definitions between studies) with relative risk (RR) ranging from 1.13 to 1.3 depending on which prediabetes definition was used, as well as of coronary heart disease RR = 1.1 to 1.2, stroke RR = 1.06 to 1.2, and all-cause mortality RR = 1.13 to 1.32. 18
Based on pathophysiologic findings and the relationship of prediabetes states with complications, many consider the natural history of T2DM to be a continuous progressive process. 19 This may be better evaluated with dynamic or continuous measures of glycemic assessment, rather than only the static measures that we currently use. With the advent and wider use of continuous glucose monitoring (CGM), we have an opportunity to re-evaluate how we identify early dysglycemia. This review is focused on published literature regarding the use of CGM in prediabetes, including CGM metrics, and explores the areas that require further investigation. Available data are sparse, and we propose potential considerations for CGM metrics for use in individuals with prediabetes.
Methods
We searched PubMed for all English-language articles with the following terms: “continuous glucose monitoring” AND “prediabetes” OR “impaired glucose tolerance” OR “abnormal glucose tolerance” OR “abnormal fasting glucose” OR “glucose intolerance” OR “impaired fasting glucose” in human subjects available by November 1, 2023. Articles were included if they pertained to a general nonpregnant adult population, and their primary aim was to address the use of CGM for diagnosis, monitoring, or treatment of prediabetes. We excluded any articles that included subjects with type 1 diabetes or who were known to be at risk for type 1 diabetes due to positive islet autoantibodies.
CGM Metrics for Diabetes
To discuss CGM metrics in prediabetes and the data published in this field thus far, we must first review what our metrics are for diabetes. A series of expert panels and consensus statements culminated in an international panel that convened in 2019 to develop clinical targets for CGM-derived metrics to publish as unified recommendations.
Clinical CGM metrics can provide information about glycemic control (mean glucose, glucose management indicator [GMI], time within range of 70 to 180 mg/dl, time above range [> 180 mg/dl and > 250 mg/dl], time below range [< 70 and < 54 mg/dl]) and about glycemic variability (GV, as standard deviation [SD] and the coefficient of variation [CV]). The GMI is calculated from the mean CGM glucoses and provides an estimated A1c equivalent for a specific period of time. The goal for GMI for each patient mirrors our goals for A1c. Specific clinical targets for time in range (TIR), time below range, and time above range have been published in an international consensus statement for most adults with diabetes and those who were older/at high risk for hypoglycemia. 20 These targets are illustrated in Figure 2. Each 5% increment in time spent in the target range 70 to 180 mg/dl is extrapolated to correlate with a reduction in A1c by 0.4%, 21 which is associated with clinically significant benefits for individuals with type 1 diabetes mellitus and T2DM.20 For GV, the consensus statement established a goal for the CV for those with diabetes, and this was set to <= 36%. 20
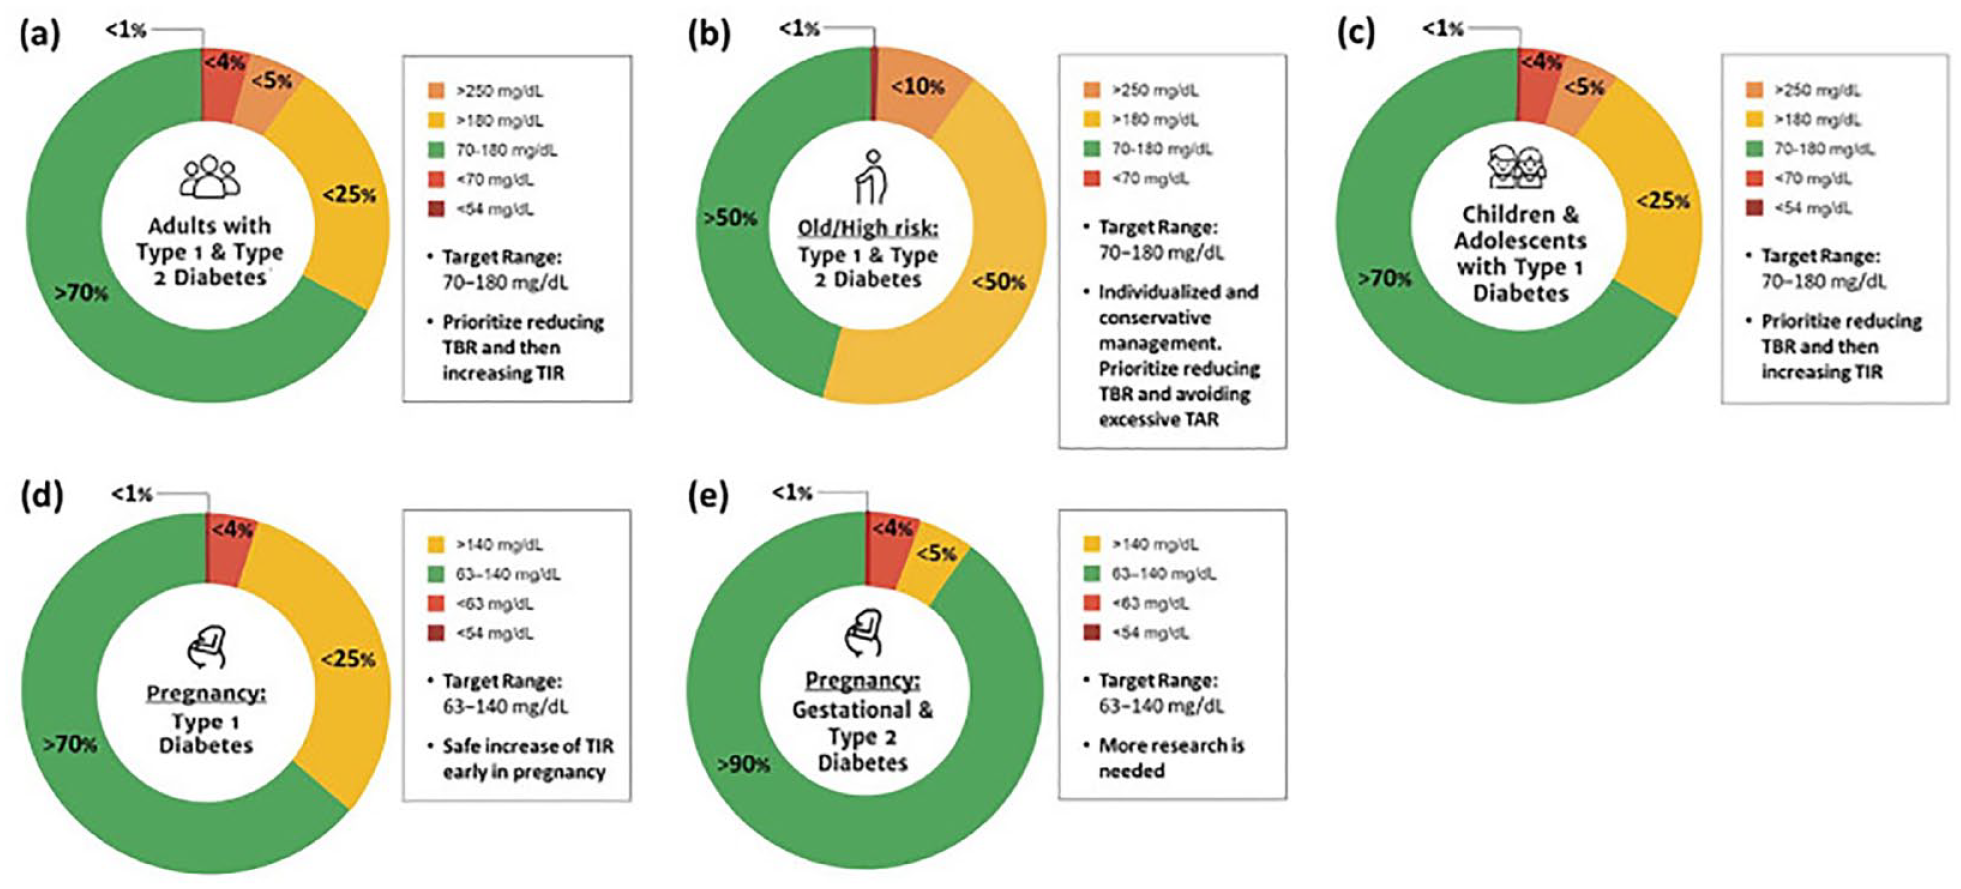
Consensus recommendations for time in range, time above range and time below range for different patient populations (a) adults with type 1 or type 2 diabetes; (b) older adults and/or adults with type 1 or type 2 diabetes at higher risk of hypoglycemia due to age, duration of diabetes, duration of insulin therapy and/or hypoglycemia unawareness; (c) children and adolescents; (d) pregnant women with type 1 diabetes, based on limited evidence; and (e) pregnant women with gestational or type 2 diabetes, but no consensus recommendations available. This figure was reproduced from the work of Bellido et al 22 Reprinted with permission.
Glycemic variability has been of particular interest in exploring the changes that accompany transitions from normoglycemia to prediabetes and to diabetes. Furthermore, CGM and GV metrics allow the assessment of postprandial glucose responses, which may be the first sign of beta-cell dysfunction. 19 Although SD and the CV are the most commonly used metrics of GV in clinical practice, several additional measures of GV have been developed for research use. Therefore, in the summary of studies that follow we will define several measures of GV that investigators used in each study, but it will be important to bear in mind that many of these are not metrics currently used in clinical practice. One of these measures of GV in particular that will be discussed frequently below is the mean amplitude of glycemic excursion (MAGE). Mean amplitude of glycemic excursion is the arithmetic mean of all the amplitudes of glucose excursions that are greater than the SD of the total glucose values.
CGM Studies in Normoglycemia
Several studies, summarized in Figure 3, have laid the groundwork for understanding what CGM values and patterns are representative of normoglycemia. In the discussion of the literature that follows, we have converted blood sugar values measured in mmol/l to mg/dl for ease of comparison using the formula, 1 mmol/L = 18.0182 mg/dl.
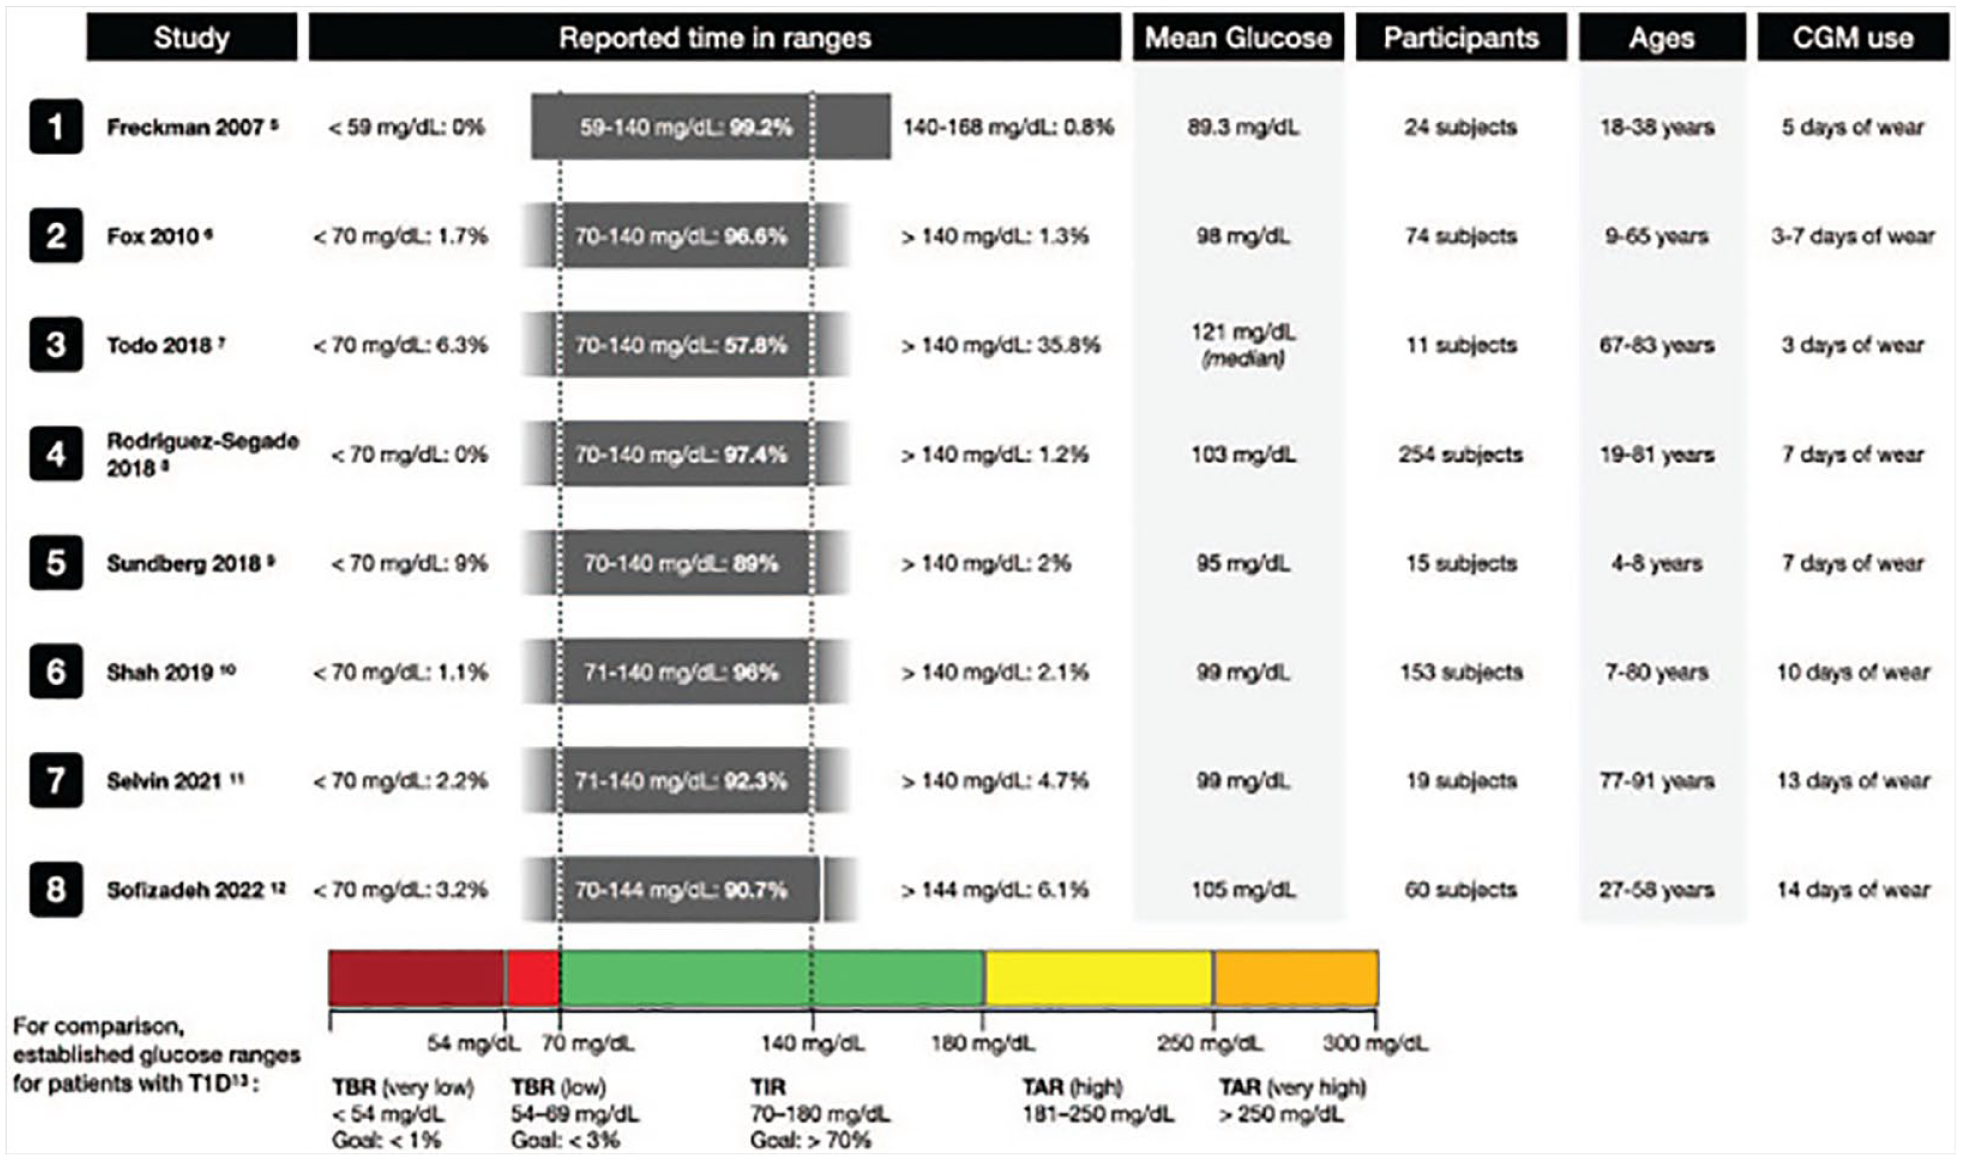
A summary of studies from 2007 to 2022 that examined normoglycemia on CGM. This figure was reproduced from the work of Klonoff et al 23 Reprinted with permission.
In a study of 153 participants age >= 6 years old who had A1c values < 5.7%, blinded Dexcom G6 CGMs were worn for a mean of eight days. 24 The average glucose amongst all participants for the duration of CGM wear was 99 mg/dl and the average CV was 17%. The median percent of sensor glucose values falling in the ranges of 70 to 120 and 70 to 140 mg/dl were 89% and 96%, respectively. Furthermore, the median percent values > 180 mg/dl was 0, < 70 mg/dl was 1.1, and < 54 mg/dl was 0. Sofizadeh et al 25 also studied Dexcom G4 Platinum CGM data in 60 normoglycemic adults in Sweden. These participants underwent OGTT in addition to HbA1c and FPG to rule out diabetes and prediabetes prior to inclusion. Of note, in this study, prediabetes was defined differently than the conventions discussed in this review, with cutoffs for 2-hour OGTT glucose >= 160 mg/dl, FPG >= 110 mg/dl, or HbA1c >= 6.0%. Mean glucose during the blinded CGM period in this study was 105 mg/dl and mean CV was 20%. The median percent time spent in the 70 to 144 mg/dl range was 92.9, > 180 mg/dl was 0.25, < 70 mg/dl was 1.6, and < 54 mg/dl was 0. Figure 4a depicts an example of an individual with normoglycemia on a CGM tracing.
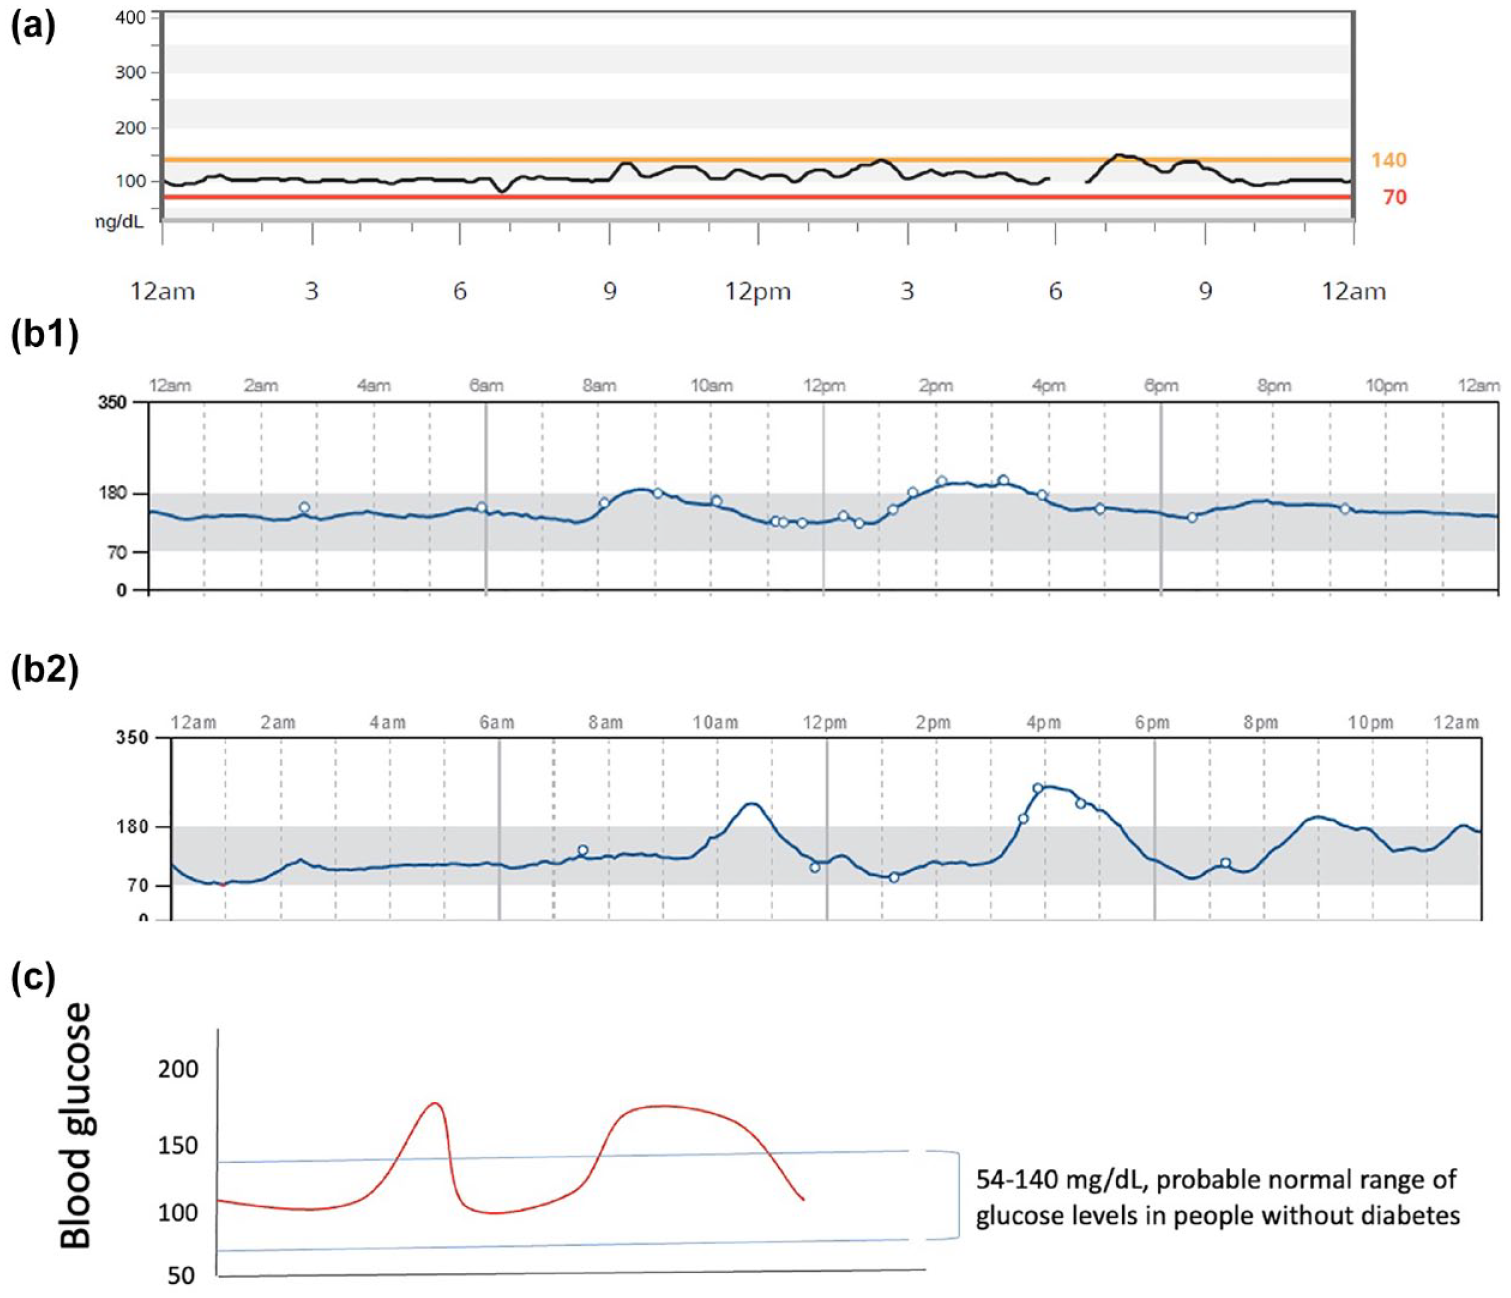
Illustration of CGM profiles in states of normoglycemia and prediabetes. (a) Example of a CGM profile in a healthy 41-year-old man with an A1c of 5.5%. The average overnight glucose is within the normal range, close to 100 mg/dl. Minor glycemic spikes occur after meals, but most postmeal excursions remain < 140 mg/dl with a duration of < 30 minutes. (b) Two illustrations of possible CGM profiles in prediabetes. Prediabetes may be characterized by elevated overnight glucose, sharp postmeal glucose spikes, increased duration of postprandial hyperglycemia, increased frequency of hyperglycemia over 24 hours or a combination of any of these profiles. (b1) The average glucose overnight is high, close to 150 mg/dl. Moderate glucose spikes occur after meals. Post-meal glucose excursions persist for hours. (b2) The average glucose overnight is near normal. More severe glucose spikes occur after meals. Postmeal glucose excursions have variable durations but can persist up to hours. (c) Hypothetical illustration, represented by the light blue horizontal lines, of the probable normal range of glucose levels in people without diabetes that could serve as the target range for prediabetes.
In addition to the studies cited in Figure 3, several studies have examined glycemic metrics on CGM in large cohorts of people without a previous diagnosis of diabetes. Keshet et al 26 performed an extensive study of 49 CGM-derived measures in 7104 adults and analyzed these measures by age and gender. One of the key findings was that MAGE (a measure of GV that we defined above) increased with age, even when accounting for carbohydrate intake. Zeevi et al 27 highlighted the heterogeneity of postprandial responses on CGM between people to identical meals. Berry et al 28 included some patients with diabetes in an examination of a variety of metabolic responses to food and found large inter-individual variability in postprandial responses by CGM.
CGM Studies in Prediabetes
Most of the published literature that examines the use of CGM in prediabetes focuses on elucidating the hallmarks of differences seen between normoglycemia and various degrees of dysglycemia on CGM. Figure 4b1 and b2 shows the illustrations of selected features that can be seen on CGM tracings in subjects with prediabetes. Table 129–44 summarizes the 16 studies we identified that examine the CGM profiles of prediabetes in general nonpregnant adult populations. These studies are all observational, had various aims, and reported different metrics. We have compiled the key CGM metrics of interest that were reported in each of these studies and make note of other GV indices that were found to differ significantly between participants with normoglycemia and prediabetes.
Summary of the Observational Studies That Evaluate CGM Profiles of Adults With Prediabetes.
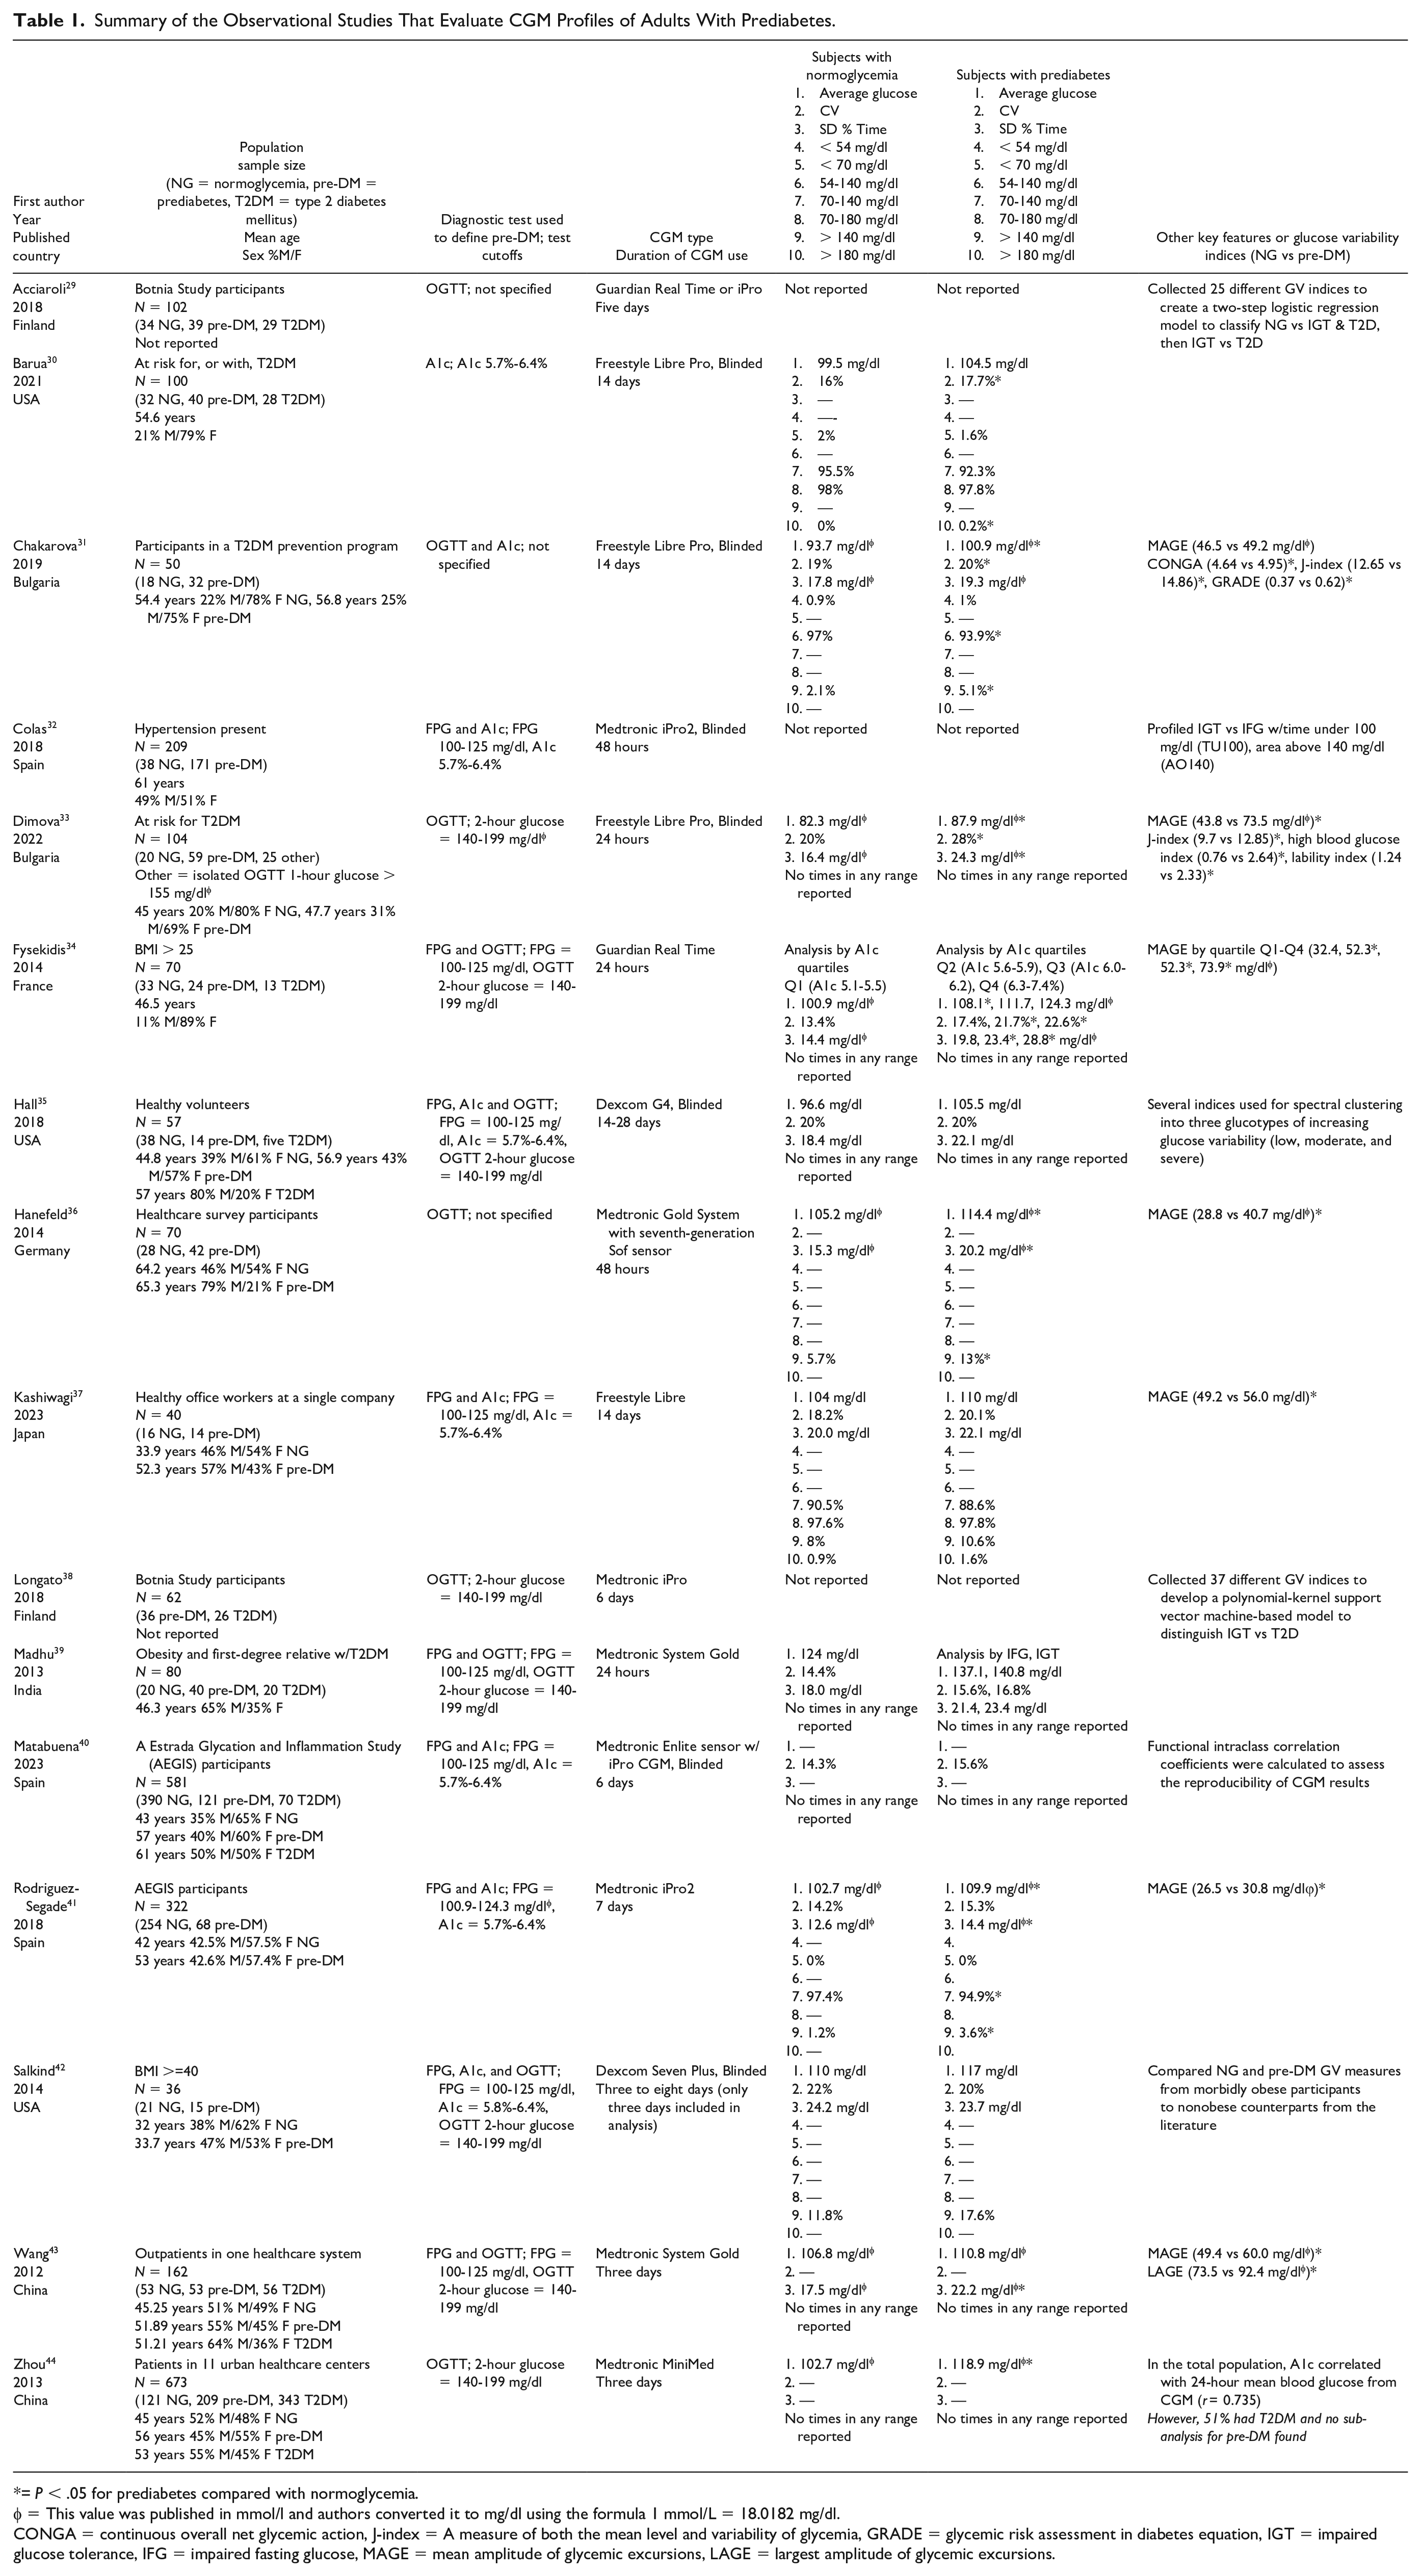
= P < .05 for prediabetes compared with normoglycemia.
= This value was published in mmol/l and authors converted it to mg/dl using the formula 1 mmol/L = 18.0182 mg/dl.
CONGA = continuous overall net glycemic action, J-index = A measure of both the mean level and variability of glycemia, GRADE = glycemic risk assessment in diabetes equation, IGT = impaired glucose tolerance, IFG = impaired fasting glucose, MAGE = mean amplitude of glycemic excursions, LAGE = largest amplitude of glycemic excursions.
One area of common ground found in these studies is mean glucose and time spent in various glucose ranges for subjects with normoglycemia compared with prediabetes. Both Barua et al 30 and Chakarova et al 31 used the Freestyle Libre Pro, blinded, for 14 days in participants, and found mean glucose in normoglycemic subjects to be 99.5 and 93.7 mg/dl, respectively, compared with 104.5 and 100.9 mg/dl in subjects with prediabetes. Barua et al 30 classified glycemic groups by A1c only and found that participants with normoglycemia and prediabetes spent 2 and 1.6% time, respectively, < 70 mg/dl, and Chakarova et al 31 (using A1c and OGTT to classify subjects) found that both groups spent very little time < 54 mg/dl and most of the time could be captured in the range of 54 to 140 (97% for normoglycemia and 93.9% for prediabetes). In a larger cohort of participants, Rodriguez-Segade et al 41 studied 254 people who were normoglycemic and 68 who had prediabetes by FPG and A1c criteria and used the Medtronic iPro2 CGM for seven days. In this study, they defined a normal target range for glucose on CGM to be 70 to 140 mg/dl and for 140 to 200 mg/dl to be the IGT range. The normoglycemic group had a mean glucose of 102.7 mg/dl and spent 97.4% time in the specified target range, while 73% had glucose excursions into the IGT range. The prediabetes group had a mean glucose of 109.9 mg/dl and spent 94.9% in this target range, while 78% had excursions into the IGT range. The normoglycemic participants that had higher glucose excursions had GV indices similar to those in the prediabetes group.
Measures of GV are emerging to be some of the most important features on CGM to identify early dysglycemia. Table 1 includes a comparison of CV and SD found in each of these studies. CV in normoglycemic groups ranged from 13.4% to 22% and from 15.3% to 28% in prediabetes groups. Several studies focused on MAGE since it is a measure that includes information from peaks and nadirs of glucose throughout CGM wear, and many found a statistically significant increase in MAGE in prediabetes groups compared with normoglycemic groups. Wang et al 43 classified glycemic status by FPG and OGTT and gathered three days of data with Medtronic Gold CGMs. They found that the prediabetes group had a MAGE of 60 mg/dl (vs 49.4 mg/dl in normoglycemic group) and a largest amplitude of glycemic excursion (LAGE) of 92.4 mg/dl (vs 73.5 mg/dl in normoglycemic group). Studies in Japan 37 and Germany 36 found MAGEs of 56 and 40.7 mg/dl, respectively, in prediabetes groups compared with 49.2 and 28.8 mg/dl in their normoglycemia groups. Chakarova et al 31 did not find the difference in MAGE to be statistically significant between their prediabetes and normoglycemia groups, however, they did find several other GV indices, including CV, J-index (a measure of both the mean level and variability of glycemia), continuous overall net glycemic action (CONGA), and glycemic risk assessment in diabetes equation (GRADE), to be significantly higher in the prediabetes group. These additional GV indices were calculated using a software package called Easy GV version 9.0.R2. J-index is a measure of both the mean level and variability of glycemia, CONGA is the SD of the differences of glucose readings for a defined period of hours, and GRADE is an estimate of the risk of hyperglycemia or hypoglycemia associated with a glucose profile.
Selected studies also administered standardized test meals in their CGM data collection periods. Hanefeld et al 36 found that the most pronounced difference after the test meal was the peak glucose of 138.4 mg/dl in the normoglycemic group compared with 165.2 mg/dl in the prediabetes group. Dimova et al 33 also administered a standardized mixed meal to all participants with instructions to follow a pre-defined dietary plan for the remaining 24 hours of CGM wear. They found significant increases in several GV indices (CV, SD, J-index, high blood glucose index, lability index, and MAGE) in the prediabetes group. High blood glucose index is an estimate of the risk of hyperglycemia and lability index is based on the change in blood glucose levels over time. 31 They also assessed insulin secretion and beta-cell function (using the insulin secretion-sensitivity index-2 = ISSI-2) during the standardized mixed meal and found that these were inversely correlated with GV indices. 33
CGM Studies in Prediabetes Management
Although there are several studies that utilize CGM to assess the impact of different interventions for prediabetes management, only a few small studies have examined the impact of using CGMs as an intervention itself on prediabetes treatment or outcomes. Bailey et al 45 randomized 13 participants with prediabetes or T2D to an eight-week standard care exercise program or a self-monitoring exercise intervention consisting of education regarding self-monitoring of exercise and blood glucose, goal setting, and use of CGM to observe how exercise influences glucose excursions. The self-monitoring intervention group showed greater increases in self-monitoring, goal setting, and self-efficacy in self-monitoring immediately after the program and at 1-month follow-up compared with the standard care exercise program. Yost et al 46 studied 15 adults who wore CGMs and were provided low carbohydrate diet coaching. They found high satisfaction rates, significant weight reduction, and reduction in HbA1c with the intervention. From qualitative interviews, participants reported that using CGM drove them to make the low carbohydrate dietary changes they were coached on. Finally, Lee et al 47 enrolled 32 subjects with prediabetes to wear CGMs for 28 days, and 68.8% participants agreed or strongly agreed that they would pay a copay if their insurance covered the CGM sensors. In response to interview questions, themes of “positive behavior change” and “improved understanding from real-time feedback” emerged.
Proposed CGM Metrics for Prediabetes and Future Directions
It is clear that some of the current goals used for diabetes care will not be pertinent for CGM metrics in prediabetes. Several targets, including TIR (70-180 mg/dl), GMI, and CV will need to be determined for people with prediabetes. First, our current definition of TIR as 70 to 180 mg/dl may not be appropriate for people with prediabetes. A key goal in prediabetes is to prevent the progression of, and/or improve the degree of, dysglycemia present. In essence, the goal is to more closely resemble the values and patterns found in a normoglycemic state. Taking the data presented above into account, a normal range of blood sugars in normoglycemia may be set to 54 to 140 mg/dl. We propose that this may be an appropriate target range for patients with prediabetes. Second, most people who do not have dysglycemia have glucose values within the 54 to 140 mg/dl range 95% to 98% of the time.24,25,41 Therefore, the goal for prediabetes TIR (54-140 mg/dl) that we propose is > 95%. Third, metrics of hypoglycemia will have less relevance in prediabetes, since the main concern is iatrogenic or medication-induced hypoglycemia, and these medications are rarely utilized in prediabetes. Figure 4c is a hypothetical illustration of this target range on CGM for patients with prediabetes. We need more studies of patients with prediabetes to validate whether this is a suitable target range and goal TIR.
Glucose management indicator (GMI) was developed using a linear regression model from CGM data collected from three clinical trials.48-50 Since most participants in those clinical trials had A1c values between 7% and 10%, the current GMI regression overestimates glycemic status in those with A1c of < 7% while it underestimates glycemic status when A1c is > 10%. A recent study by one of the authors, Dr Shah et al, 51 demonstrated that GMI correlated poorly with laboratory measured A1c in people without diabetes, with up to a 0.59% positive bias in GMI estimation. The correlation between mean glucose and A1c in people without diabetes was poor (r = 0.27). Because mean glucose and GMI are not well correlated with A1c, we recommend against using GMI for the diagnosis and monitoring of prediabetes.
As discussed above, measures of average glucose exposure in people with prediabetes may miss many of the hyperglycemic spikes, often postprandial, that result from defects in first-phase insulin secretion. 52 Glycemic variability metrics, such as SD, CV, MAGE, and others discussed in our summary of the literature, may have greater relevance in these patients, and may detect some of the spikes seen with impending insulin secretory defects in the early stages of dysglycemia. Many of these studies demonstrated that metrics of GV increase from normoglycemic states to prediabetes and one showed that GV metrics were inversely related to insulin secretion indices. Furthermore, GV metrics have been shown to have good correlation with endothelial dysfunction and increased oxidative stress and have been associated with cardiovascular risk in observational studies. 53 There is not enough evidence to propose target ranges for any of these indices, but we anticipate that GV metrics will play a prominent role in CGM metrics for prediabetes.
Conclusion
Continuous glucose monitoring has revolutionized the care of patients with diabetes and has the potential to play a role in patients with prediabetes, but more data are needed. In March 2024, the Food and Drug Administration (FDA) approved the first over the counter CGM in the United States and this will undoubtedly add to the need to clarify CGM use outside of diabetes. Most large trials have assessed CGM accuracy in people with diabetes, and the precision and accuracy of various CGM systems is unclear in individuals with normoglycemia and those with prediabetes. Therefore, future trials are needed in this area. In addition, larger sample sizes are needed to identify glucose target ranges and CGM metrics for prediabetes that can adequately differentiate individuals with prediabetes from those who are normoglycemic, while taking into account the heterogeneity of prediabetes. Identified CGM metrics for prediabetes will need to include a measure(s) of GV. The purpose of optimal CGM metrics in prediabetes will be to adequately identify patients at risk for diabetes complications and progression to diabetes, and to guide strategies for both prevention of progression of dysglycemia and facilitating reversion to normoglycemia. Appropriate use of CGM in prediabetes has the potential to have a large impact if these goals can be achieved.
Footnotes
Abbreviations
ADA, American Diabetes Association; CV, Coefficient of variation; CGM, Continuous glucose monitoring; CONGA, Continuous overall net glycemic action; FPG, Fasting plasma glucose; GRADE, Glycemic risk assessment in diabetes equation; GV, Glycemic variability; HR, Hazard ratio; IFG, Impaired fasting glucose; IGT, Impaired glucose tolerance; ISSI-2, Insulin secretion-sensitivity index-2; LAGE, Largest amplitude of glycemic excursion; MAGE, Mean amplitude of glycemic excursion; NHANES, National Health and Nutrition Examination Survey; OGTT, Oral glucose tolerance test; RR, Relative risk; SD, Standard deviation; TIR, Time in range; T2DM, Type 2 diabetes mellitus; DPP, Diabetes Prevention Program; WHO, World Health Organization.
Declaration of Conflicting Interests
The author(s) declared the following potential conflicts of interest with respect to the research, authorship, and/or publication of this article: Salwa J Zahalka: none.
Rodolfo J Galindo: RJG has received research support to Emory University for investigator-initiated studies from Novo Nordisk, Dexcom, and Eli Lilly and consulting/advisory/honoraria fees from Abbott, Dexcom, Eli Lilly, Novo Nordisk, Bayer, Boehringer, and Astra Zeneca, outside of this work. RJG is supported in part by the National Institute of Diabetes and Digestive and Kidney Diseases (NIDDK) of the National Institutes of Health (NIH) under award numbers 5P30DK111024-08, 1R03DK138255-01, and K23DK123384-06
Viral N Shah: VNS reported receiving research grants from NovoNordisk, Alexion, Tandem Diabetes Care, Insulet, JDRF, and NIH and has received honoraria from Sanofi, NovoNordisk, Tandem Diabetes Care, Insulet, Dexcom, Ascensia Diabetes Care, and Embecta for speaking, consulting or being on advisory board.
Cecilia C Low Wang: CCL reported receiving research support from Dexcom Inc, Virta Health, and CellResearch Corp.
Funding
The author(s) received no financial support for the research, authorship, and/or publication of this article.