
Abstract
Background:
Two weeks of continuous glucose monitoring (CGM) sampling with >70% CGM use is recommended to accurately reflect 90 days of glycemic metrics. However, minimum sampling duration for CGM use <70% is not well studied. We investigated the minimum duration of CGM sampling required for each CGM metric to achieve representative glycemic outcomes for <70% CGM use over 90 days.
Methods:
Ninety days of CGM data were collected in 336 real-life CGM users with type 1 diabetes. CGM data were grouped in 5% increments of CGM use (45%-95%) over 90 days. For each CGM metric and each CGM use category, the correlation between the summary statistic calculated using each sampling period and all 90 days of data was determined using the squared value of the Spearmen correlation coefficient (R2).
Results:
For CGM use 45% to 95% over 90 days, minimum sampling period is 14 days for mean glucose, time in range (70-180 mg/dL), time >180 mg/dL, and time >250 mg/dL; 28 days for coefficient of variation, and 35 days for time <54 mg/dL. For time <70 mg/dL, 28 days is sufficient between 45 and 80% CGM use, while 21 days is required >80% CGM use.
Conclusion:
We defined minimum sampling durations for all CGM metrics in suboptimal CGM use. CGM sampling of at least 14 days is required for >45% CGM use over 90 days to sufficiently reflect most of the CGM metrics. Assessment of hypoglycemia and coefficient of variation require a longer sampling period regardless of CGM use duration.
Introduction
Continuous glucose monitoring (CGM) has been the standard of care in diabetes management and clinical trials.1,2 Use of CGM has been increasing due to improved sensor accuracy, greater convenience, ease of use, and increasing reimbursement.3,4 CGM use has been shown to improve glycemic outcomes from youth to elderly people and early initiation of CGM has been shown to improve glycemic outcomes.5 -10
Numerous CGM metrics have been defined, and standardization of data reporting and target metrics to achieve better glycemic outcomes have been suggested.1,2,11,12 International Consensus on Time in Range recommends using the last 14 days of CGM data if CGM use >70% to assess time in range, mean glucose, and hyperglycemia metrics and acknowledges that correlations using 14 days of data are weaker for hypoglycemia and glycemic variability metrics if CGM use >70%.1,12 The Glycemia Risk Index was based on 14-day tracings with at least 92% of the potential data points. 13 It is unknown if these recommendations are applicable to CGM users < 70%.
Prior studies demonstrated that 14 days of CGM data provide a good approximation of glucose metrics collected over a 90-day period.14,15 Another study suggested that a longer period of sampling is necessary for closed-loop insulin therapy to achieve stable sensor glucose metrics. 16 However, these studies included different clinical trials that utilized different CGMs and had many restrictions for inclusion criteria including use of CGM duration (>70% CGM use). In this study, we evaluated real-life CGM users without any restriction (1) to understand the effect of CGM use duration on CGM minimum sampling duration on each CGM metric and to define optimal sampling period for CGM users <70% and (2) to find out the minimum sampling duration for CGM users >70% for CGM metrics including hypoglycemia and variability as International Consensus stated that longer duration of CGM collection may be required in individuals with glycemic variability to assess hypoglycemia.
Research Design and Methods
In a single center, Barbara Davis Center for Diabetes, 336 adults (>18-year-old) with type 1 diabetes (>2 years) using Dexcom G6 CGM (>six months) with either multiple daily injections (MDI) or continuous subcutaneous insulin infusion (CSII) (no hybrid closed loop) in 2019 were reviewed. All patients remained on the same therapy during the study. Continuous glucose monitoring data was downloaded from Dexcom Clarity Software. Data was analyzed using cgmanalysis package for R software (R Core Users Group, Vienna).17,18 HbA1c was measured as point of care in the clinic with the same device (DCA Vantage Analyzer, Siemens Health Care Diagnostics). This study was approved by the Colorado Multiple Institutional Review Board.
This study aimed to find minimum sampling duration, which is defined as the minimum required duration for CGM sampling to reflect 90 days of CGM data accurately in CGM users <70%. CGM data was pulled from subjects with varying amounts of CGM use and grouped into 5% increments of CGM use between 45% and 95% over 90 days. CGM usage (%) was defined as the data availability as percentage in the last 90 days. Mean glucose, time in range (70-180 mg/dL), time >180 mg/dL, time >250 mg/dL, time <70 mg/dL, time <54 mg/dL, and coefficient of variation (CV) were calculated in each CGM use category. Additionally, similar descriptive statistics were calculated for those with CGM use >70% over the last 90 days. For each CGM metric and each CGM use category, the correlation between each sampling period and all 90 days of data was determined using the squared value of the Spearman correlation coefficient (R)2. This represents the proportion of total variance explained by the sample. There is no consensus on what R2 cutoff should be an acceptable degree of agreement; however, in a previous study with a similar methodology, the optimal sampling R2 for most of the CGM metrics was .84-.88. 14 A recent study used R2 ≥ .9 for close alignment. 19 In our study, a plateau was reached around .88 for all CGM metrics. A plateau was defined as the flattening of R2 curve with consideration of incremental changes in R2. In parallel with previous studies, as mentioned earlier, and based on the plateau, we used R2 ≥ .88 for cutoff for CGM metrics. All other analyses were performed using SAS software version 9.4 (SAS Institute, Cary, NC) and R software version 4.1.3.
Results
Out of 336 patients, 56% were female, 80% were White, mean age was 41.9 ± 14 years, mean HbA1c was 7.2 ± 1.4%, 131 were on MDI and 205 were on CSII. As also shown in previous studies14 -16,19 -21 longer duration of CGM sampling has a higher correlation (R2) with the entire dataset for any CGM usage percentage (45-95%) as seen in Supplementary Materials. The correlations between the full 90-day and 7-day increments from 7-day to 84-day sampling periods improved with increasing days of CGM data for all CGM metrics for all use categories but reached a plateau at different days for each CGM metrics (Figures 1 and 2). Higher CGM use increased the correlation for all CGM metrics; however, change was minimal between 45% and 95% for most of the CGM metrics (Supplementary Material). Figure 1 shows basic CGM metrics faceted by CGM sampling percentage, and Figure 2 shows all CGM sampling percentages faceted by CGM metrics. Supplementary material shows detailed R2 correlations divided by sampling percentages and CGM use from 45% to 95% CGM use.
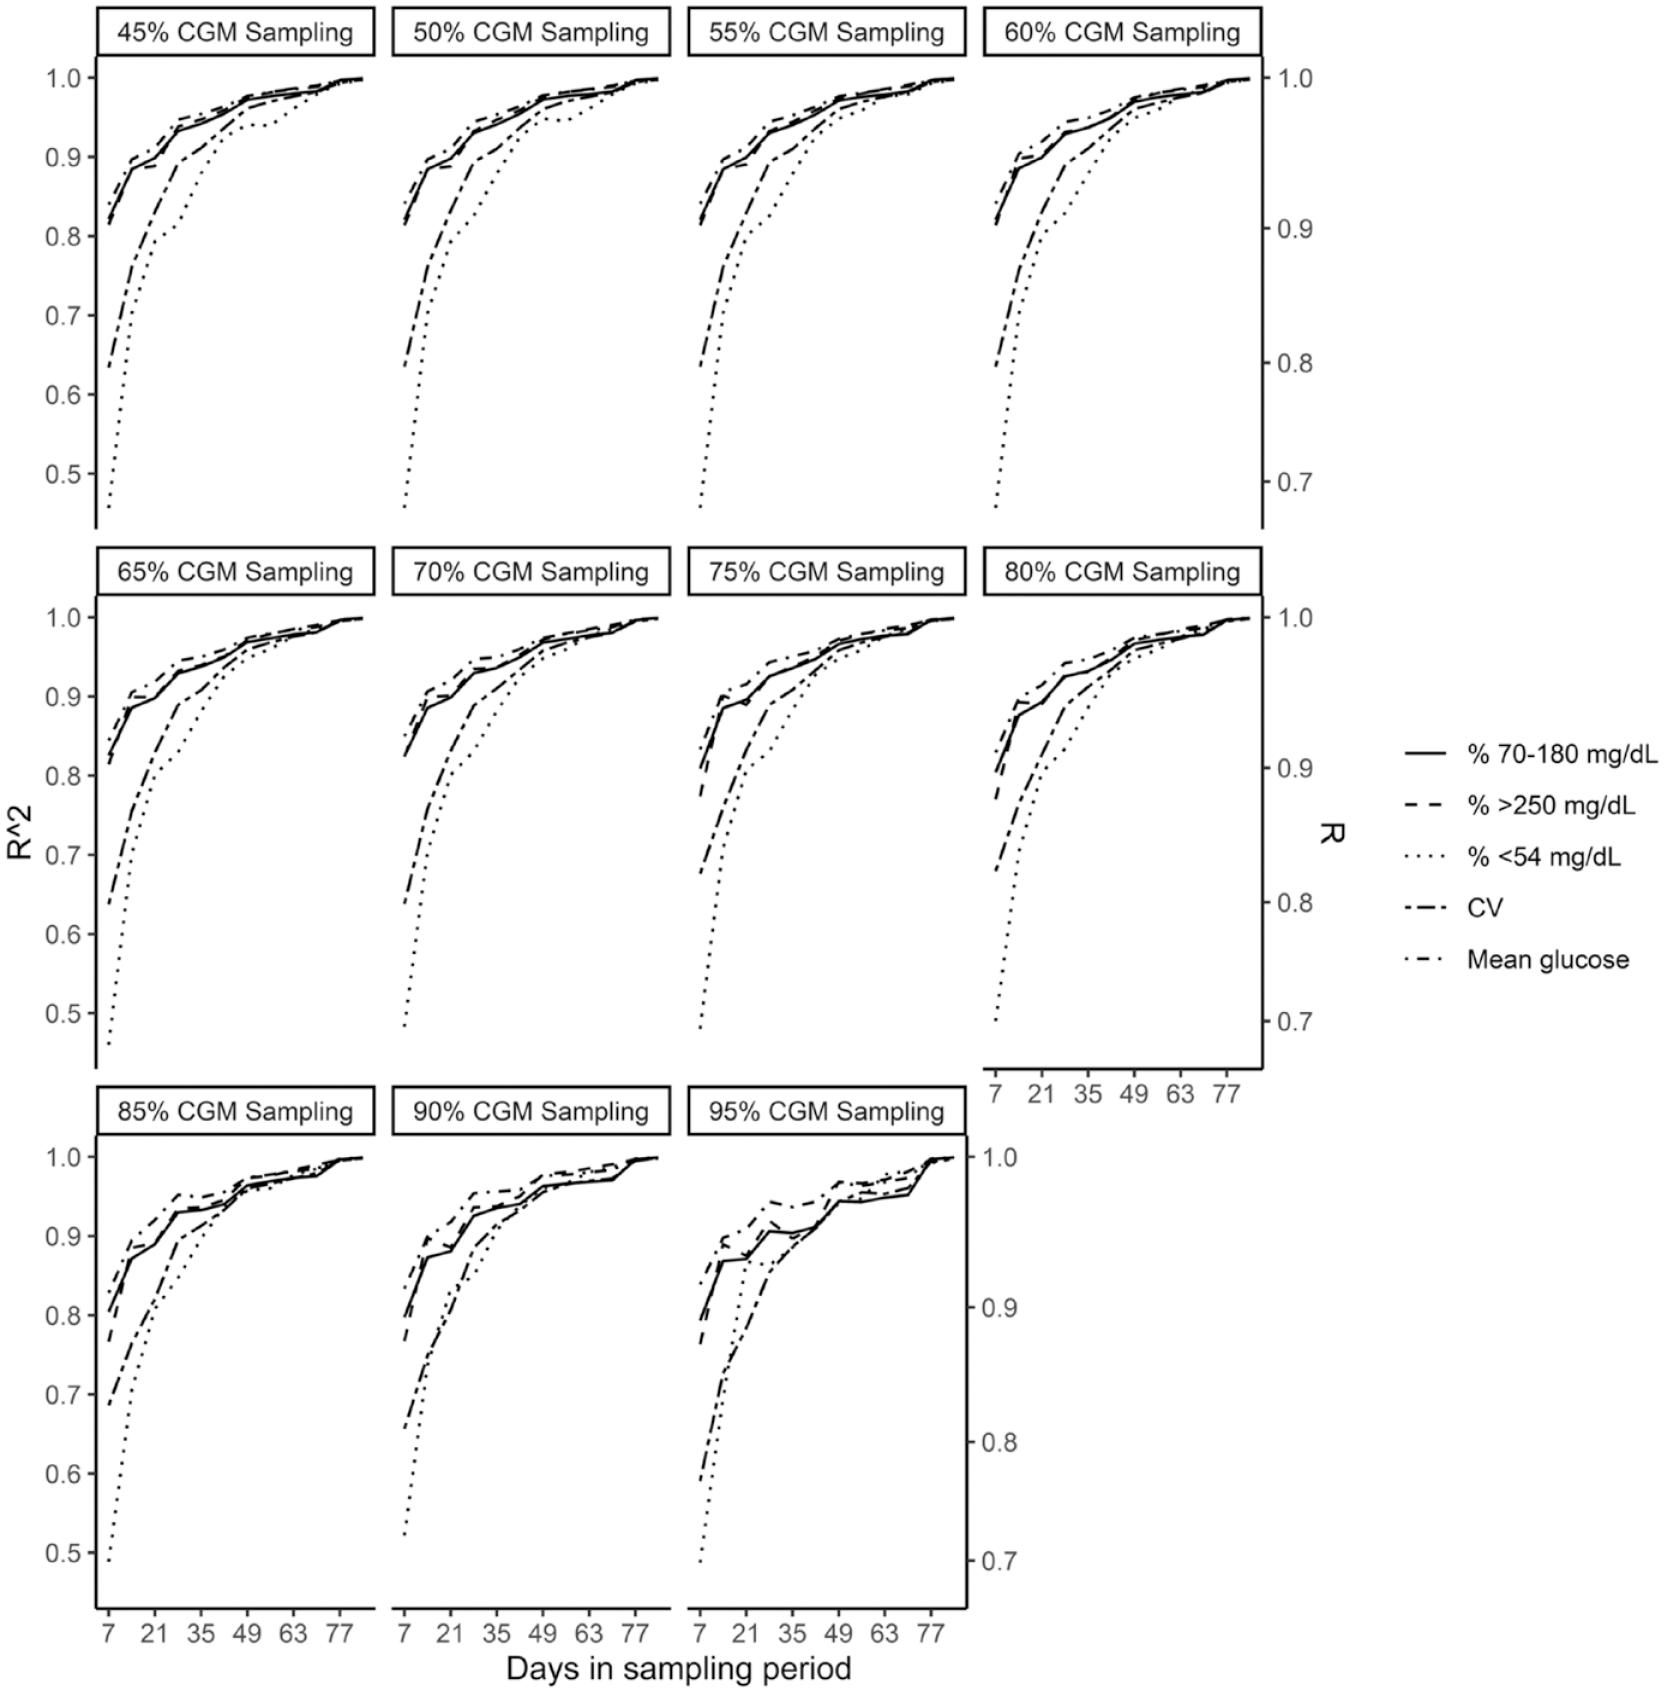
CGM metrics faceted by CGM sampling percentage.
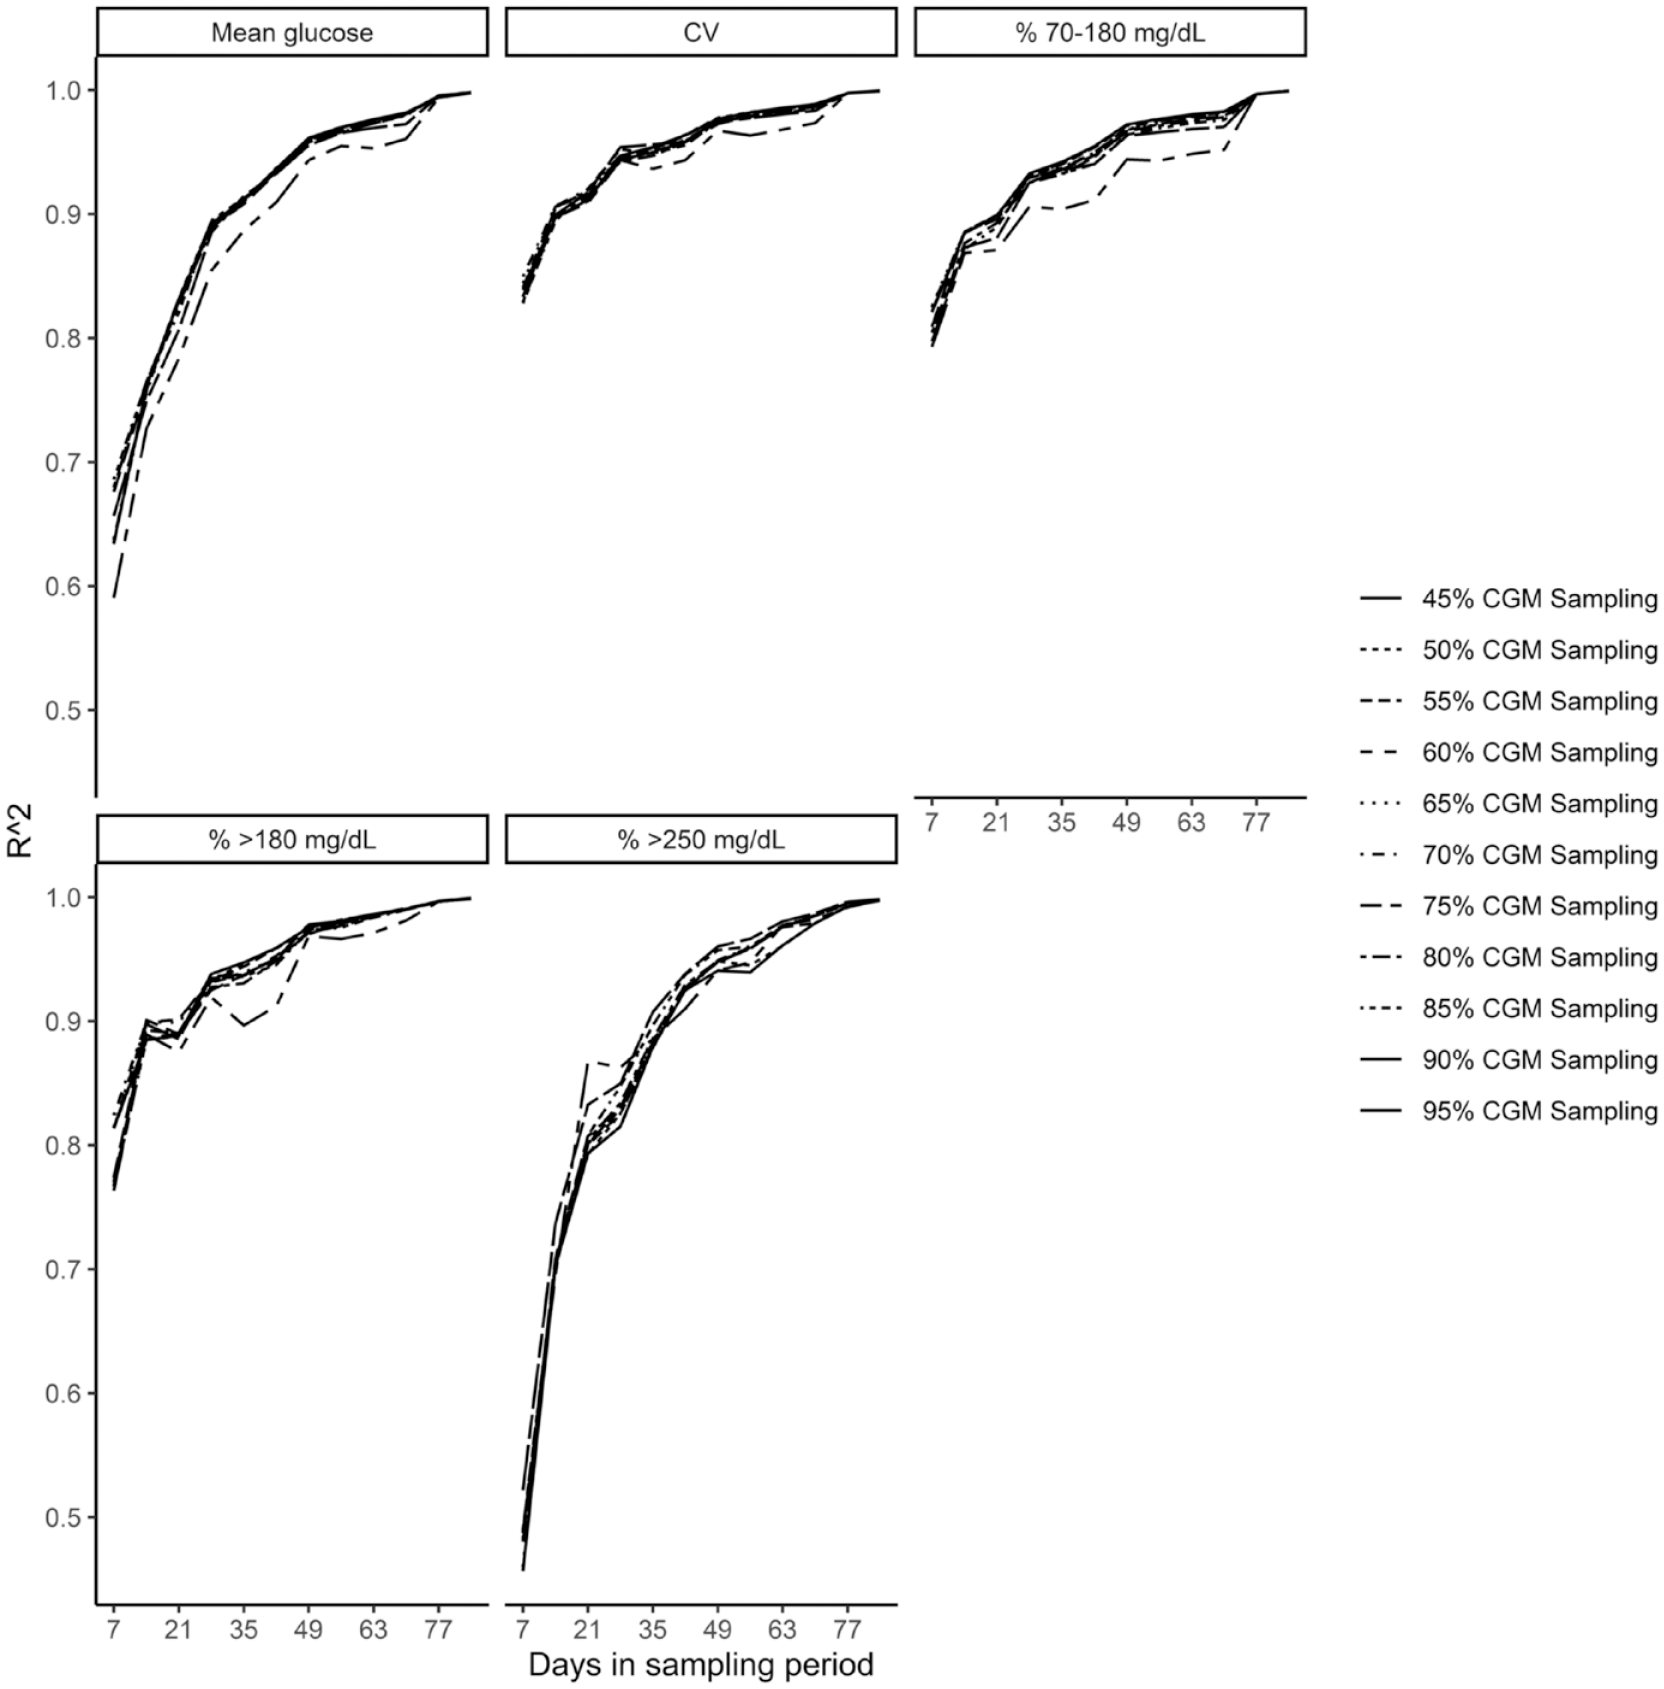
CGM sampling percentages faceted by CGM metrics.
For CGM use between 45% and 95% in the last 90 days, a plateau was reached around 14 days for mean glucose, time in range, time >180 mg/dL, time >250 mg/dL, at 28 days for CV and at 35 days for time <54 mg/dL. For time <70 mg/dL, from 45 to 80% CGM use in the last 90 days, a plateau was reached at 28 days, and for CGM use >80%, a plateau was reached at 21 days (Table 1). For those with >70% CGM use in the last 90 days, a plateau was reached around 14 days for mean glucose, time in range, time >180 mg/dL, time >250 mg/dL, at 28 days for CV and time <70 mg/dL, and at 35 days for time <54 mg/dL.
Minimum Sampling Duration (days) to Reflect 90-Day Data in Groups of % CGM Use in the Last 90 Days.
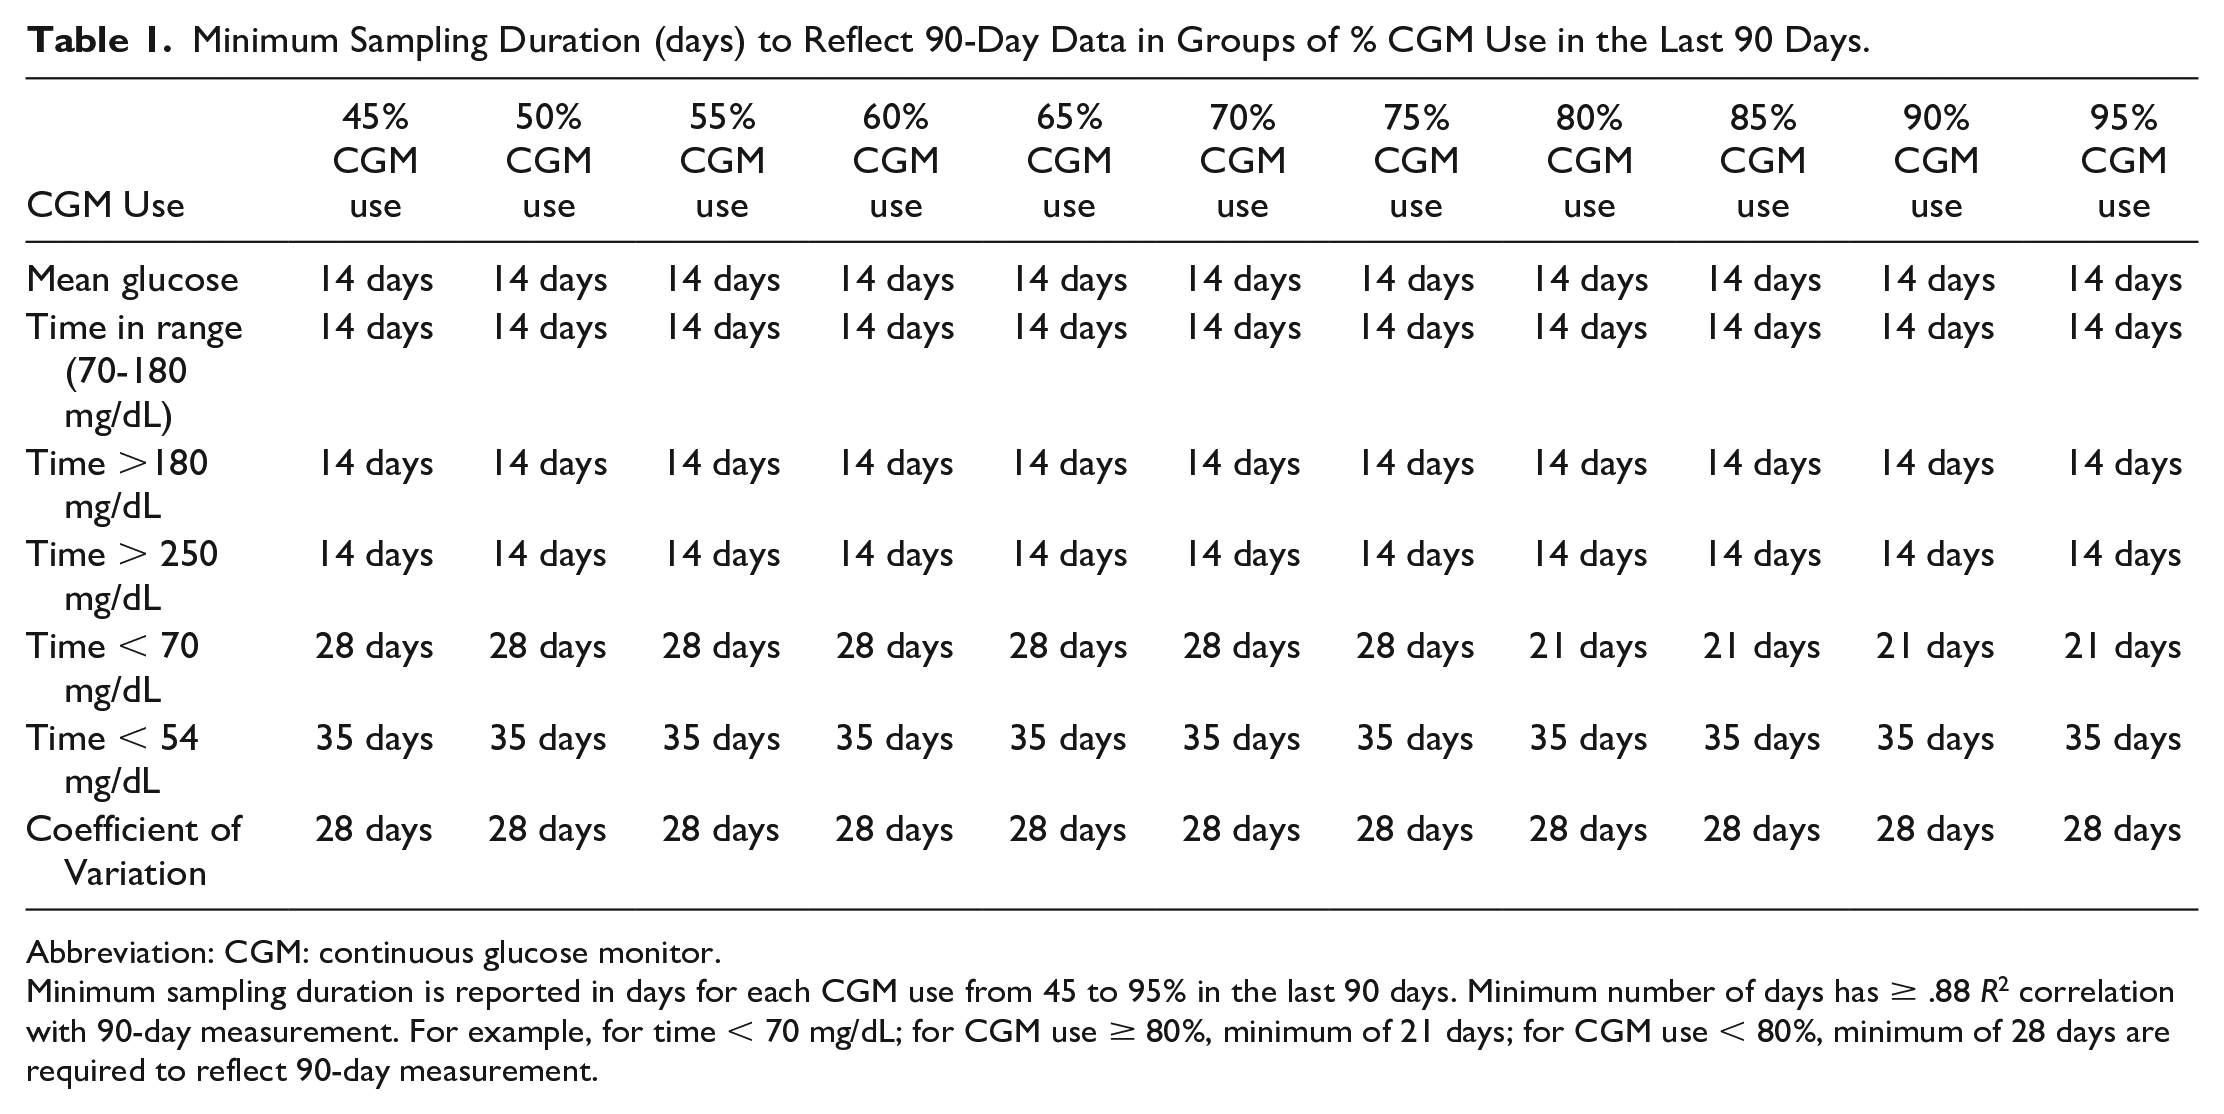
Abbreviation: CGM: continuous glucose monitor.
Minimum sampling duration is reported in days for each CGM use from 45 to 95% in the last 90 days. Minimum number of days has ≥ .88 R2 correlation with 90-day measurement. For example, for time < 70 mg/dL; for CGM use ≥ 80%, minimum of 21 days; for CGM use < 80%, minimum of 28 days are required to reflect 90-day measurement.
Discussion
The International Consensus on Time in Range recommends using 14 days of CGM sampling if CGM use is over 70%.1,12 However, it is common in clinical practice to have patients with <70% CGM use in the last 14 days. Currently, there is no recommendation regarding the number of sampling days that best reflects 90 days of data for these individuals. In our study, we investigated if a longer sampling duration can achieve the same level of accuracy in lower CGM use. Our results indicate that 14 days of CGM data for patients using CGM >45% in the last 90 days is enough to reflect 90 days of CGM data accurately for mean glucose, time in range, time >180 mg/dL, time >250 mg/dL; however, for hypoglycemia (time <70 mg/dL and <54 mg/dL) and glycemic variation metrics (CV), longer duration of sampling duration is required. Other than time <70 mg/dL, none of the CGM metrics optimal sampling duration changed with increasing use of CGM. Minimum sampling duration for time <54 mg/dL and CV were significantly longer than other CGM metrics, irrespective of the CGM use duration.
Our results confirmed the International Consensus’s statement, “Longer CGM data collection periods may be required for individuals with more variable glycemic control-like 4 weeks to investigate hypoglycemia.” for CGM users >70%. 1 We found that for time <70 mg/dL, 21 to 28 days, depending on CGM usage, and for time <54 mg/dL, 35 days are required to assess hypoglycemia metrics.
To our knowledge, this is the largest study evaluating the effect of CGM use on the sampling duration of CGM metrics in real-life settings, and this is the first study evaluating the minimum sampling duration of CGM metrics in CGM < 70% use. The International Consensus on Time in Range recommendations are based on previous studies.14,15 Previously reported studies compared 1 to 15 days and 1 to 30 days of CGM sampling correlation to 90 days of CGM metrics, respectively.14,15 Both studies included only patients who used more than 70% and 75% of CGM, respectively.14,15 In addition, further restrictions were added to the inclusion criteria such as at least 60 days of CGM data in 90 days, at least 14 days of CGM data in the prior 28 days, at least 8 days of CGM data in the prior 14 days and at least 75% CGM readings in the day prior. 14 Furthermore, in previous studies, patients used different brands of CGMs including CGMs requiring calibration.14 -16,19 Leelarathna et al 16 reported results using Freestyle Navigator II (Abbott Diabetes Care, Alameda, CA) and Guardian 3 (Medtronic, Northridge, CA). Riddlesworth et al 14 reported results using Freestyle Libre Pro (Abbott Diabetes Care, Alameda, CA) and Dexcom G4 Platinium (Dexcom Inc., San Diego, CA). Xing et al 15 reported results using Freestyle Navigator (Abbott Diabetes Care, Alameda, CA), MiniMed Paradigm (Medtronic, Northridge, CA), and Dexcom SEVEN (Dexcom Inc. San Diego, CA). In this study, we calculated the effect of CGM use to minimum sampling duration on CGM metrics in real-life CGM users with type 1 diabetes without any restriction using the squared value of the Spearman correlation coefficient (R2), .88 to plateau, and we only included users of the same type of CGM meeting iCGM standards, Dexcom G6 (Dexcom Inc., San Diego, CA). Table 2 compares the current study to previously published optimal sampling/data loss studies.
Comparison of This Current Study With the Previous Optimal Sampling Duration/Data Loss Studies in CGM.
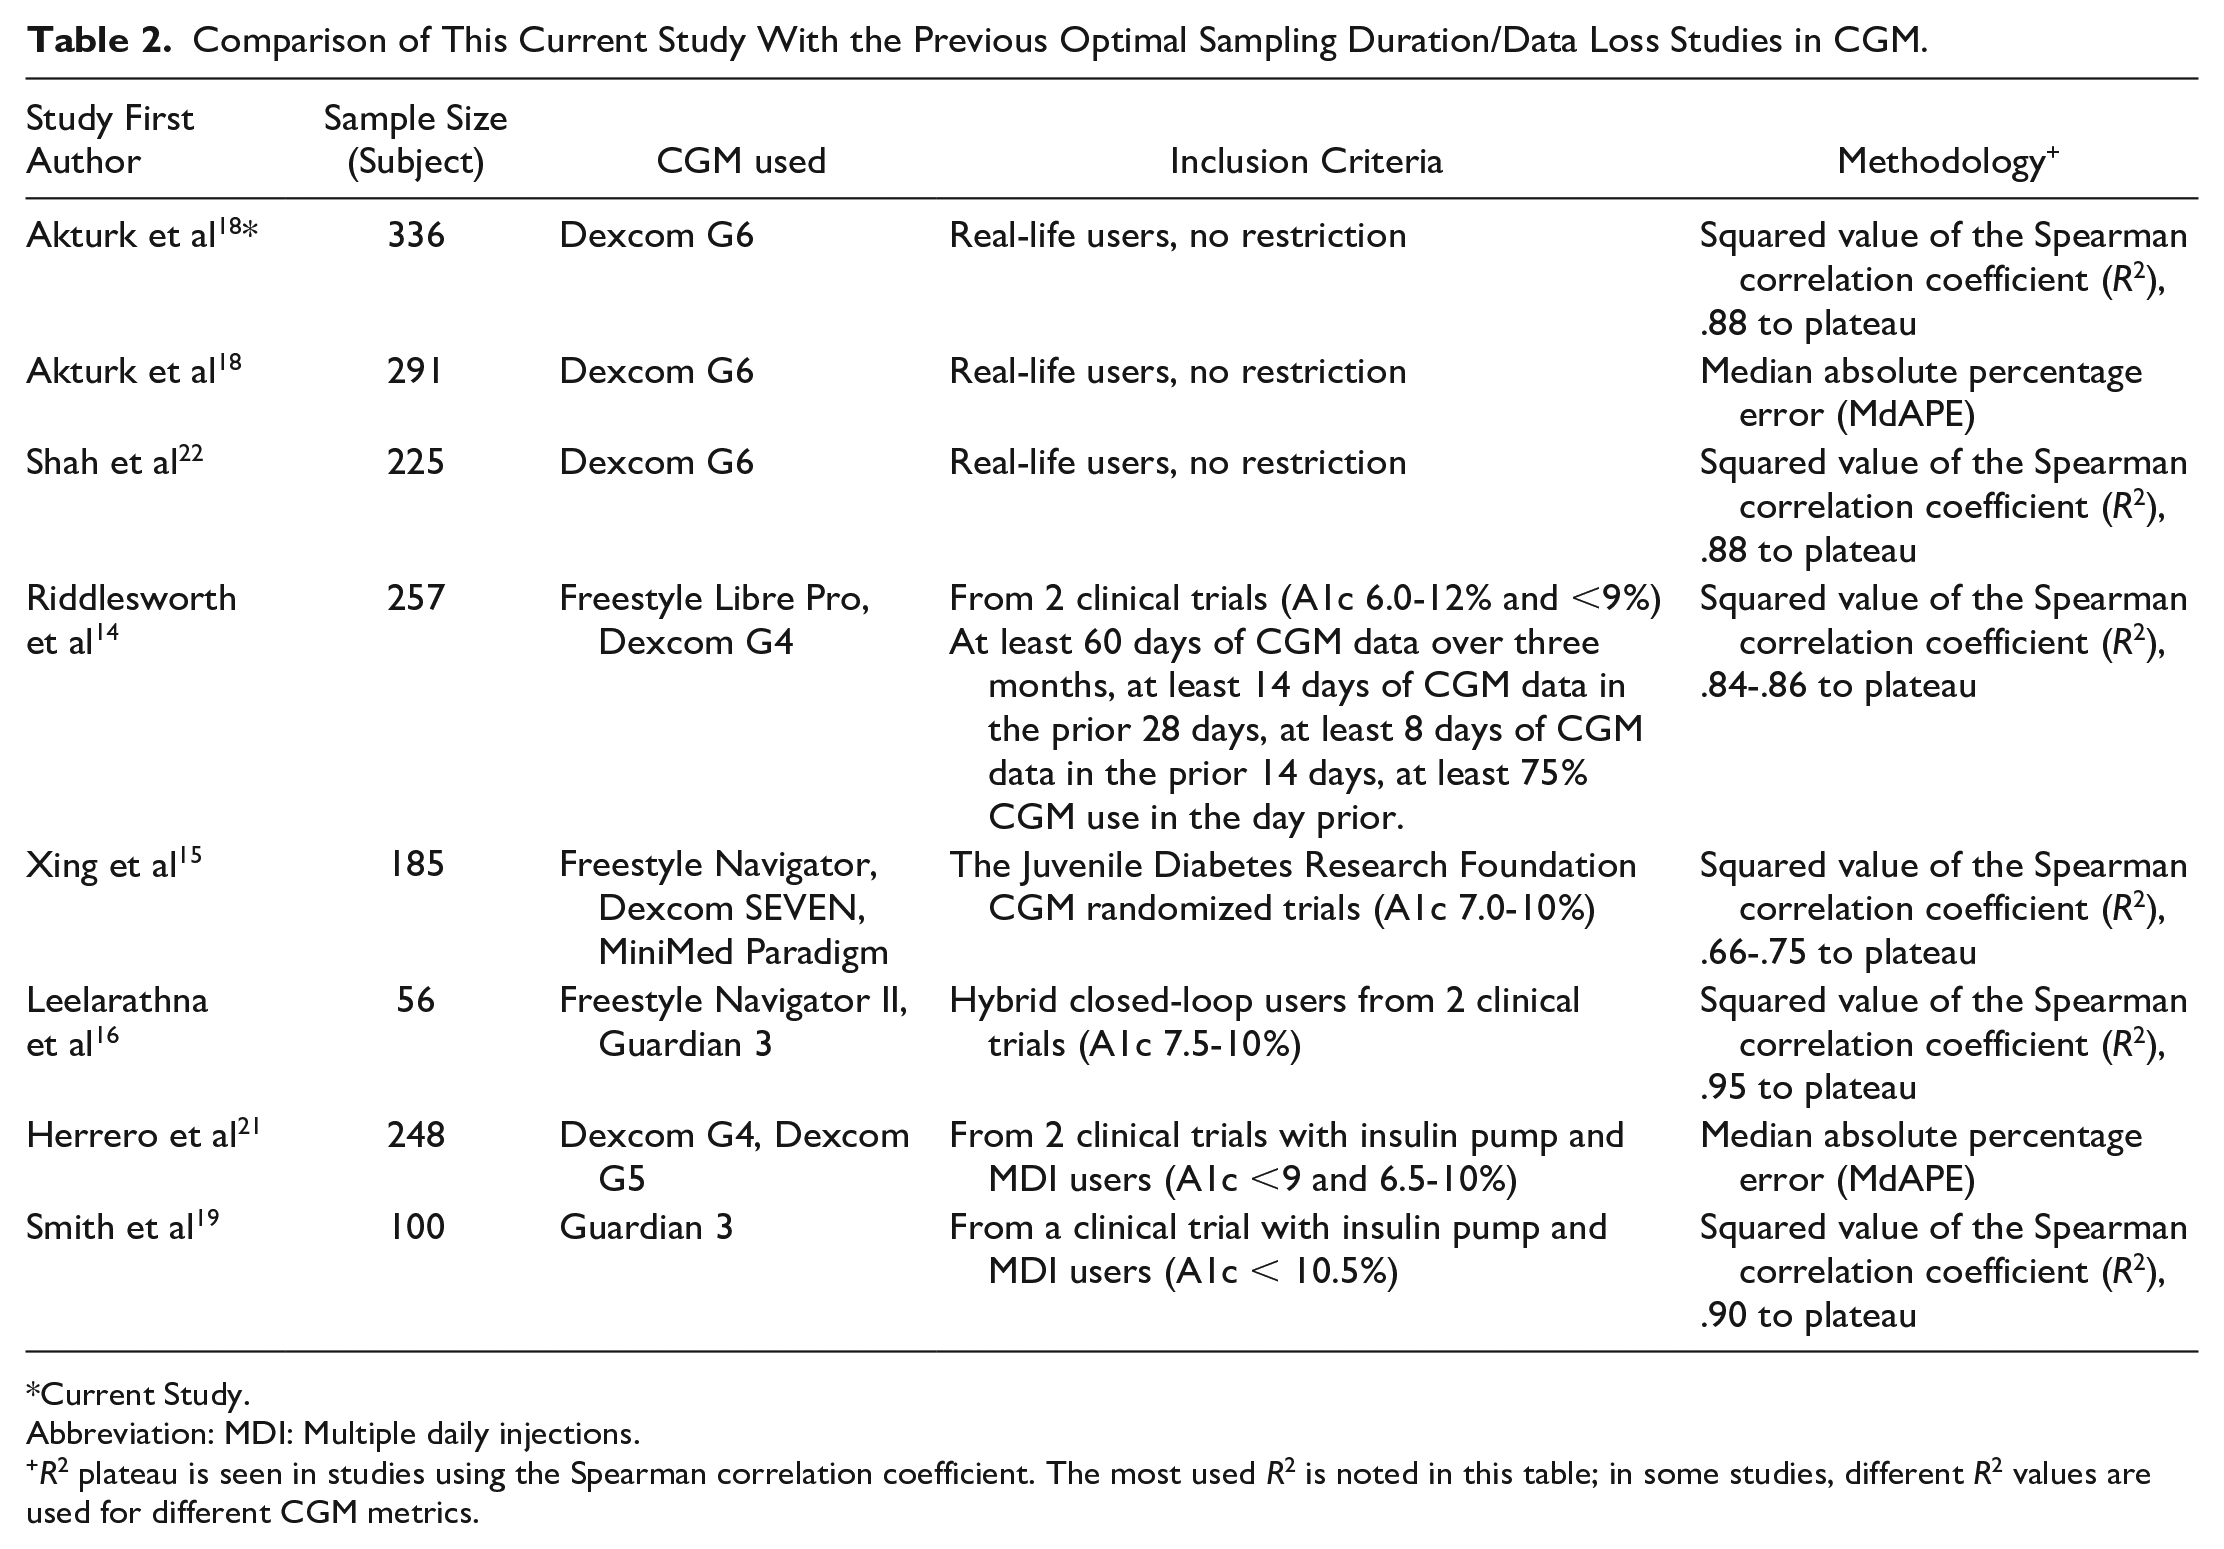
Current Study.
Abbreviation: MDI: Multiple daily injections.
R2 plateau is seen in studies using the Spearman correlation coefficient. The most used R2 is noted in this table; in some studies, different R2 values are used for different CGM metrics.
Strengths of our study includes using real-life CGM users’ data without any restriction, the use of the same type of CGM, and the largest sampling size in a CGM sampling study to date.
Limitations of our study include retrospective analysis, data from a single center, lack of information about diabetes management habits, and using a predefined R2 plateau since there is no consensus on what R2 should be used in CGM studies.
The results of our study should be interpreted with caution since previously, we showed that not only duration but also type of data loss affects the optimal sampling duration. 20 In that study, up to 50% of data loss in a random manner did not cause any significant change in optimal sampling duration; however, >30% of data loss in gaps up to five hours required longer optimal sampling duration. 20 Our study confirmed the previous findings of up to 50% random data loss can be tolerable with over 14 days of CGM metrics except for hypoglycemia metrics.20,21 A recent study also validated our previous study for random data loss. 19
Conclusion
For patients with CGM use >45% in the last 90 days, 14 days of sampling is sufficient for mean glucose, time in range, time >180 mg/dL, and >250 mg/dL; however, longer duration of CGM sampling is necessary to assess time <70 mg/dL and <54 mg/dL and CV. For time <70 mg/dL, increased CGM use percentage decreases the minimum sampling duration from 28 to 21 days; however, for all other CGM metrics, longer CGM use has minimal effect over 14 days of sampling. Based on our study, for >45% of CGM users over 90 days, we suggest at least 14 days of sampling for mean glucose, time in range (70-180 mg/dL), time >180 mg/dL, time >250 mg/dL, 28 days for CV and 35 days for time < 54 mg/dL. For time < 70 mg/dL, we suggest at least 28 days of sampling for 45% to 80% CGM use; for >80% CGM use, we suggest 21 days of sampling to achieve representative glycemic outcomes. Our results confirmed the statement of the International Consensus that a longer duration of CGM sampling may be required to assess hypoglycemia and variability metrics.
Supplemental Material
sj-docx-1-dst-10.1177_19322968231200901 – Supplemental material for Minimum Sampling Duration for Continuous Glucose Monitoring Metrics to Achieve Representative Glycemic Outcomes in Suboptimal Continuous Glucose Monitor Use
Supplemental material, sj-docx-1-dst-10.1177_19322968231200901 for Minimum Sampling Duration for Continuous Glucose Monitoring Metrics to Achieve Representative Glycemic Outcomes in Suboptimal Continuous Glucose Monitor Use by Halis K. Akturk, Casey Sakamoto, Tim Vigers, Viral N. Shah and Laura Pyle in Journal of Diabetes Science and Technology
Footnotes
Abbreviations
CGM, continuous glucose monitoring; MDI, multiple daily injections; CSII, continuous subcutaneous insulin infusion; TIR, time in range.
Author Contributions
HKA and VNS designed the study. HKA extracted the data. CS, TV, and LP conducted statistical analysis. HKA drafted the manuscript, and all authors edited and approved the manuscript. HKA is the guarantor of this work and, as such, has full access to all the data in the study and takes responsibility for the integrity of the data and accuracy of the data analysis.
Declaration of Conflicting Interests
The author(s) declared the following potential conflicts of interest with respect to the research, authorship, and/or publication of this article: HKA received research support through University of Colorado from Dexcom, Tandem Diabetes, Senseonics, Medtronic, Eli Lilly, REMD Biotherapeutics, IM Therapeutics, IAFMS, received honoraria through University of Colorado from Senseonics and Mannkind for advisory board attendance. VNS received research support through University of Colorado from NovoNordisk, Insulet, Tandem Diabetes Care, received honoraria through University of Colorado from Lifescan for advisory board attendance and from Dexcom, Embecta, and Insulet for speaking arrangements. CS, TV, and LP do not report any conflict of interest.
Funding
The author(s) received no financial support for the research, authorship, and/or publication of this article.
Supplemental Material
Supplemental material for this article is available online.
References
Supplementary Material
Please find the following supplemental material available below.
For Open Access articles published under a Creative Commons License, all supplemental material carries the same license as the article it is associated with.
For non-Open Access articles published, all supplemental material carries a non-exclusive license, and permission requests for re-use of supplemental material or any part of supplemental material shall be sent directly to the copyright owner as specified in the copyright notice associated with the article.