
Abstract
Background:
The insulin requirements of people with type 1 diabetes (T1D) can vary throughout the day due to factors such as biorhythm, exercise, and food intake. The MiniMed 780G system delivers micro boluses to adjust basal insulin and delivers auto-correction boluses to meet insulin needs when micro bolus increases are insufficient. Through analysis of MiniMed 780G data, this study investigates the variations in insulin requirements throughout the day.
Methods:
4193 days’ pump and continuous glucose monitoring (CGM) data of 34 children using MiniMed 780G were collected from Medtronic CareLink. Micro and auto-correction boluses were analyzed on an hourly basis for two age groups: below nine years old and above nine years old. Glycemic metrics were analyzed based on International CGM consensus.
Results:
The mean age was 12.3 years and mean duration of diabetes was 6.1 years. The mean time in range (TIR) and glucose management indicator (GMI) were 80.5% and 6.6%, respectively. The micro bolus (basal) ratio between 05.00 and 07.00 was significantly higher than the ratio between 10.00 and 03.00 (P < .01), whereas micro bolus was significantly lower between 19.00 and 21.00 than those between 00.00 and 10.00 (P < .001). The auto-correction ratio between 21.00 and 00.00 was significantly higher than those between 03.00-17.00 (P < .001) and 19.00-21.00 (P = .008), whereas auto-correction was significantly lower between 07.00 and 10.00 than those between 10.00 and 03.00 (P < .001). The micro bolus ratio was significantly higher in children below nine years old than in children above nine years old between 21.00-00.00 (P = .026) and 00.00-03.00 (P = .003).
Conclusion:
The basal insulin need follows a diurnal pattern with two significantly different periods—high between 00.00 and 10.00 and low between 10.00 and 00.00. The auto-correction rates are low between 05.00 and 10.00 and show an increasing pattern peaking between 21.00 and 00.00. These findings are compatible with the dawn and reverse dawn phenomena.
Introduction
The management of type 1 diabetes (T1D) management has seen significant improvements, especially so with the acceleration of technological progress in the last decade. Continuous subcutaneous insulin infusion (CSII)—especially with the use of sensor-augmented insulin pumps—provides lower HbA1c levels while lowering complication rates.1,2 Improvements in pump technology and algorithms have increased the impact and success of this line of treatment. Two such improvements are the low-glucose suspend function that was subsequently followed by the suspend before-low-glucose feature. 3 However, these open-loop systems do not respond to hyperglycemia; furthermore, hypoglycemia predictions may in fact cause rebound hyperglycemia. 4 With the development of hyperglycemia-responsive algorithms, closed-loop systems have further improved glycemia by increasing time in range (TIR) and by reducing time below range (TBR) and time above range (TAR). 5
The MiniMed 780G advanced hybrid closed-loop system’s (AHCL) auto-mode has three insulin components: micro boluses, which are algorithm-driven basal doses; auto-correction boluses, which are algorithm-driven correction boluses; and wizard boluses, which require a carbohydrate amount for meal boluses. In cases of increased need of basal insulin, the algorithm increases the micro boluses. If the need exceeds the scope of the micro bolus increase, the algorithm administers auto-correction boluses. Over time, the algorithm adjusts the insulin sensitivity factor according to previous data.
Clinicians have traditionally provided basal insulin rates for pump users in line with their insulin needs. However, AHCL algorithm calculates and delivers a micro bolus every five minutes according to the current glucose value and the target glucose value. Investigating the algorithm’s contribution to the insulin delivery may provide a better understanding of the insulin needs of people with T1D.
Physiological insulin need shows diurnal variations throughout the day. These repeated and prominent fluctuations in insulin need can be explained by phenomena. The increased insulin needs between 01.00-07.00 and 17.00-19.00 have been attributed to the mechanisms of the dawn phenomenon and dusk phenomenon, respectively.6 -8 Increases in cortisol and growth hormone, and decreased glucose utilization are thought to cause the dawn phenomenon in the early morning. Scheiner and Boyer 9 showed different basal needs and peaks in adults and juvenile populations due to different growth hormone and cortisol levels and timings. Nauck et al studied basal insulin need during periods of 24-hour fasting with open-loop pumps and regular blood glucose measurements in adults with T1D. They found that there are varying degrees of the dawn phenomenon between 01.00 and 07.00, peaking between 06.00 and 07.00, alongside a less prominent dusk phenomenon between 15.00 and 19.00, peaking between 17.00 and 18.00. 6 Another study found that the dawn phenomenon begins at 03.00 and causes a 60% increase in basal insulin need. 10 Interestingly, Nicolajsen et al 11 defined the reversed dawn phenomenon in young children as being characterized by an increased insulin need during the late evening (22.00-00.00) in children aged three to nine years. The dusk phenomenon during the predinner time period has not been covered comprehensively in the literature and studies have shown a smaller increase in insulin need compared with the dawn period.8,12 Responding to these fluctuations in insulin need is crucial for better glycemic control and achieving glycemic goals. Although closed-loop systems are able to respond to glycemic fluctuations, understanding those fluctuations as part of daily insulin need and building a clinical insight in this regard may improve understanding of glucose metabolism and T1D management.
This study was designed to investigate the alterations in insulin requirement and the presence of phenomena in young children and adolescents throughout the day by analyzing the response and optimizations of the AHCL algorithms.
Methods
Participants
This exploratory retrospective study was conducted to investigate the insulin needs of young children and adolescents with T1D who have been treated with AHCL system. The algorithm glucose target value was set to 100 mg/dL for all children, the auto-correction was activated, and the duration of active insulin was programmed as two hours as the highest TIR and better glycemic control were achieved with these settings. 13 The auto-mode was activated after 48-hour warm-up period. The inclusion criteria were being less than 18 years old, having a T1D diagnosis for more than six months, having more than two weeks of pump and continuous glucose monitoring (CGM) data, and having total daily insulin dose higher than 0.5 U/kg/d. The pump data of 45 children followed up in Koç University Hospital Pediatric Endocrinology & Diabetes Department as of September 2021 were accessed through the Medtronic CareLink system with the permission of their families. Of the 34 children who met the inclusion criteria, all the available pump and CGM data between February 2021 and September 2021 were downloaded from the cloud system.
The study protocol was conducted according to the Declaration of Helsinki principles and it was approved by the Institutional Research Ethics Committee (2021.400.IRB1.115).
Procedures
The closed loop’s auto-mode raw data were extracted from all raw data collected. Any periods when the auto-mode was deactivated were excluded from the study. The auto-mode data were analyzed according to three main data categories: (1) micro bolus (each basal delivery is displayed as a micro bolus), (2) auto-correction bolus (automatically delivered correction bolus), and (3) wizard bolus (bolus for carbs which was delivered through Bolus Wizard). The auto-correction bolus and micro bolus values were broken down into one-hour periods with 24 values being obtained for a 24-hour period for each user. Percentages of each value were subsequently generated. The average (mean) insulin dose/hour (insulin rate) was calculated for predefined time intervals (00.00-03.00 for the first half of the night, 03.00-05.00 for the second half of the night, 05.00-07.00 for the early morning, 07.00-10.00 for late morning and breakfast, 10-17.00 for daytime [including lunch and postprandial periods], 17.00-19.00 for early evening, 19.00-21.00 for late evening, and 21.00-00.00 for periods before sleep). Each interval’s percentages were also generated. Total insulin doses were calculated by summation of dose subtypes (micro bolus, auto-correction bolus, and wizard bolus). The ratios of each subtype dose to total insulin dose, the total insulin dose/day/kilogram, and dose subtypes/day/kilogram were calculated. The value of total carbohydrates that entered the Bolus Wizard was obtained from the raw data and a carbs/day value was generated. The data were processed using Microsoft Excel. The children’s date of birth and in-hospital measured weight data were obtained during follow-up visits corresponding to the same time intervals as the analyzed data.
Glycemic metrics were analyzed based on International CGM consensus. Time in range 70 to 180 mg/dL, time below range level 1 (TBR1) < 70 mg/dL, time below range level 2 (TBR2) < 54 mg/dL, time above range level 1 (TAR1) > 180 mg/dL, time above range level 2 (TAR2) > 250 mg/dL, glycemic variation coefficient (CV), and glucose management indicator (GMI) were evaluated.
The 24-hour-slotted micro and auto-correction bolus percentages were examined for two age groups (above nine years old and below nine years old) because the reverse dawn phenomenon is noted in children below nine years of age. 11
The age- and sex-adjusted recommended daily intake (RDI) of carbohydrates was determined as the amount of carbohydrates that would meet 45%14,15 of the age- and sex-adjusted recommended daily calorie intake, according to the European Food Safety Authority (EFSA). 16 The entered daily carbohydrate amount/RDI carbohydrate amount was used for the evaluation of daily carbohydrate intake of the children.
Statistical Analysis
For interval analysis of nonparametric-related samples, Friedman two-way analysis test was used to compare inter-interval differences of micro boluses and auto-correction boluses. Significance values have been adjusted by the Bonferroni correction for inter-interval comparison. The Mann-Whitney U test was used to compare two age groups and the night-day comparison. For all statistical analysis and users’ descriptives, SPSS statistics 28.0.0 software was used.
Results
The raw data of 4193 patient-days of 34 children using the AHCL system were analyzed. These data were obtained via the CareLink system between January 2021 and September 2021. Of the 34 children, 16 were female, the mean age was 12.3 ± 3.51, and the mean duration of diabetes was 6.1± 2.8 years. According to the AHCL data, the mean of entered carbs/day was 203.7 ± 57.4 g and the mean of entered carbs/age- and sex-adjusted RDI ratio was 1.0 ± 0.3. The total insulin dose/day was 44.7 ± 21.8 and total insulin dose/day/kg was 0.9 ± 0.3. The mean micro bolus/day, auto-correction dose/day, and wizard bolus/day were 14.1 ± 6.7, 6.5 ± 4, and 24.1 ± 13.4, respectively. The ratios of the wizard bolus, auto-correction, and micro dose to total insulin dose were 53.3%, 14.5%, and 32.1%, respectively. The mean of the carb/wizard bolus (C:I) was 10.4 ± 4.7 g/U. The means of CGM glucose, TIR, TAR1 and TAR2, and TBR1 and TBR2 were 136.7 ± 11.6, 80.5% ± 7.8%, 14.5% ± 6.2%, 2.5% ± 2.2, 2% ± 1.5%, and 0.5% ± 0.8%, respectively. The mean standard deviation, CV, and GMI were 45.5 mg/dL, 33.1%, and 6.6%, respectively. There was no significant difference in the mean glucose, TIR, standard deviation (SD), CV, TAR, TBR, and GMI between the two age groups (independent samples, Mann-Whitney U test). There were no differences in terms of percentages of micro, auto-correction, wizard boluses, and total insulin/kg between age groups (Table 1).
Descriptive Analysis of 34 Children and Their Comparison Between Two Age Groups (Below Nine Years Old and Above Nine Years Old).
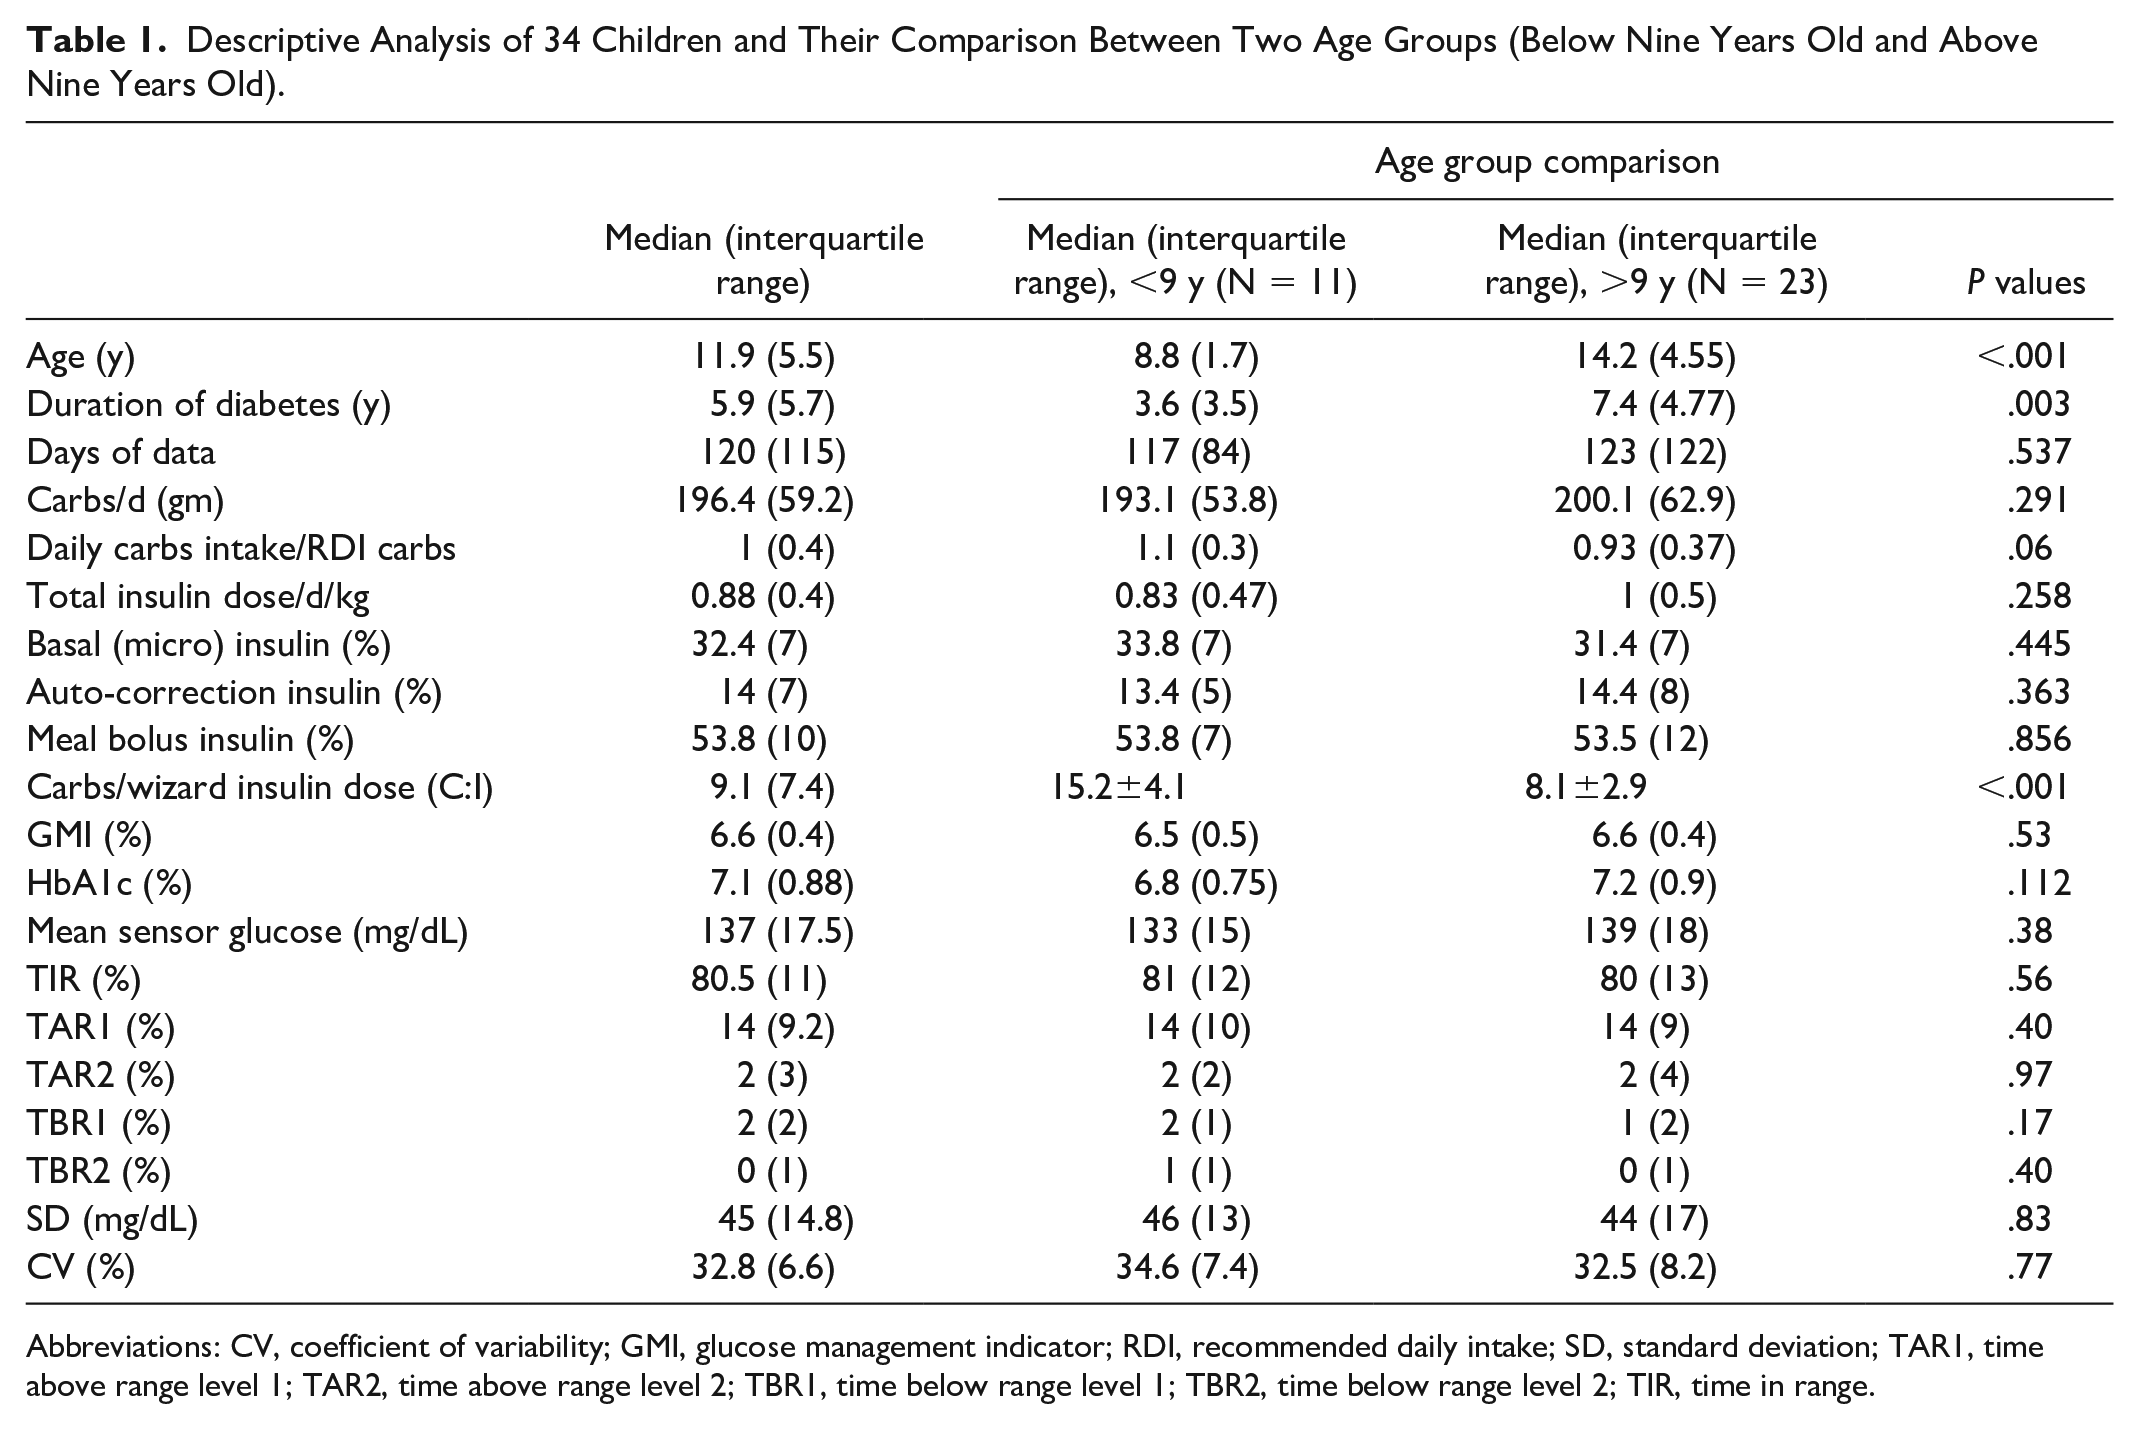
Abbreviations: CV, coefficient of variability; GMI, glucose management indicator; RDI, recommended daily intake; SD, standard deviation; TAR1, time above range level 1; TAR2, time above range level 2; TBR1, time below range level 1; TBR2, time below range level 2; TIR, time in range.
Micro and auto-correction boluses were broken down into one-hour timeslots for each 24 hours. Each time slot’s ratio to the total 24-hour dose was calculated for both micro and auto-correction boluses as percentages. The 24-hour-slotted micro and auto-correction bolus percentages for two age groups (above nine years old and below nine years old) are shown separately in Figure 1.
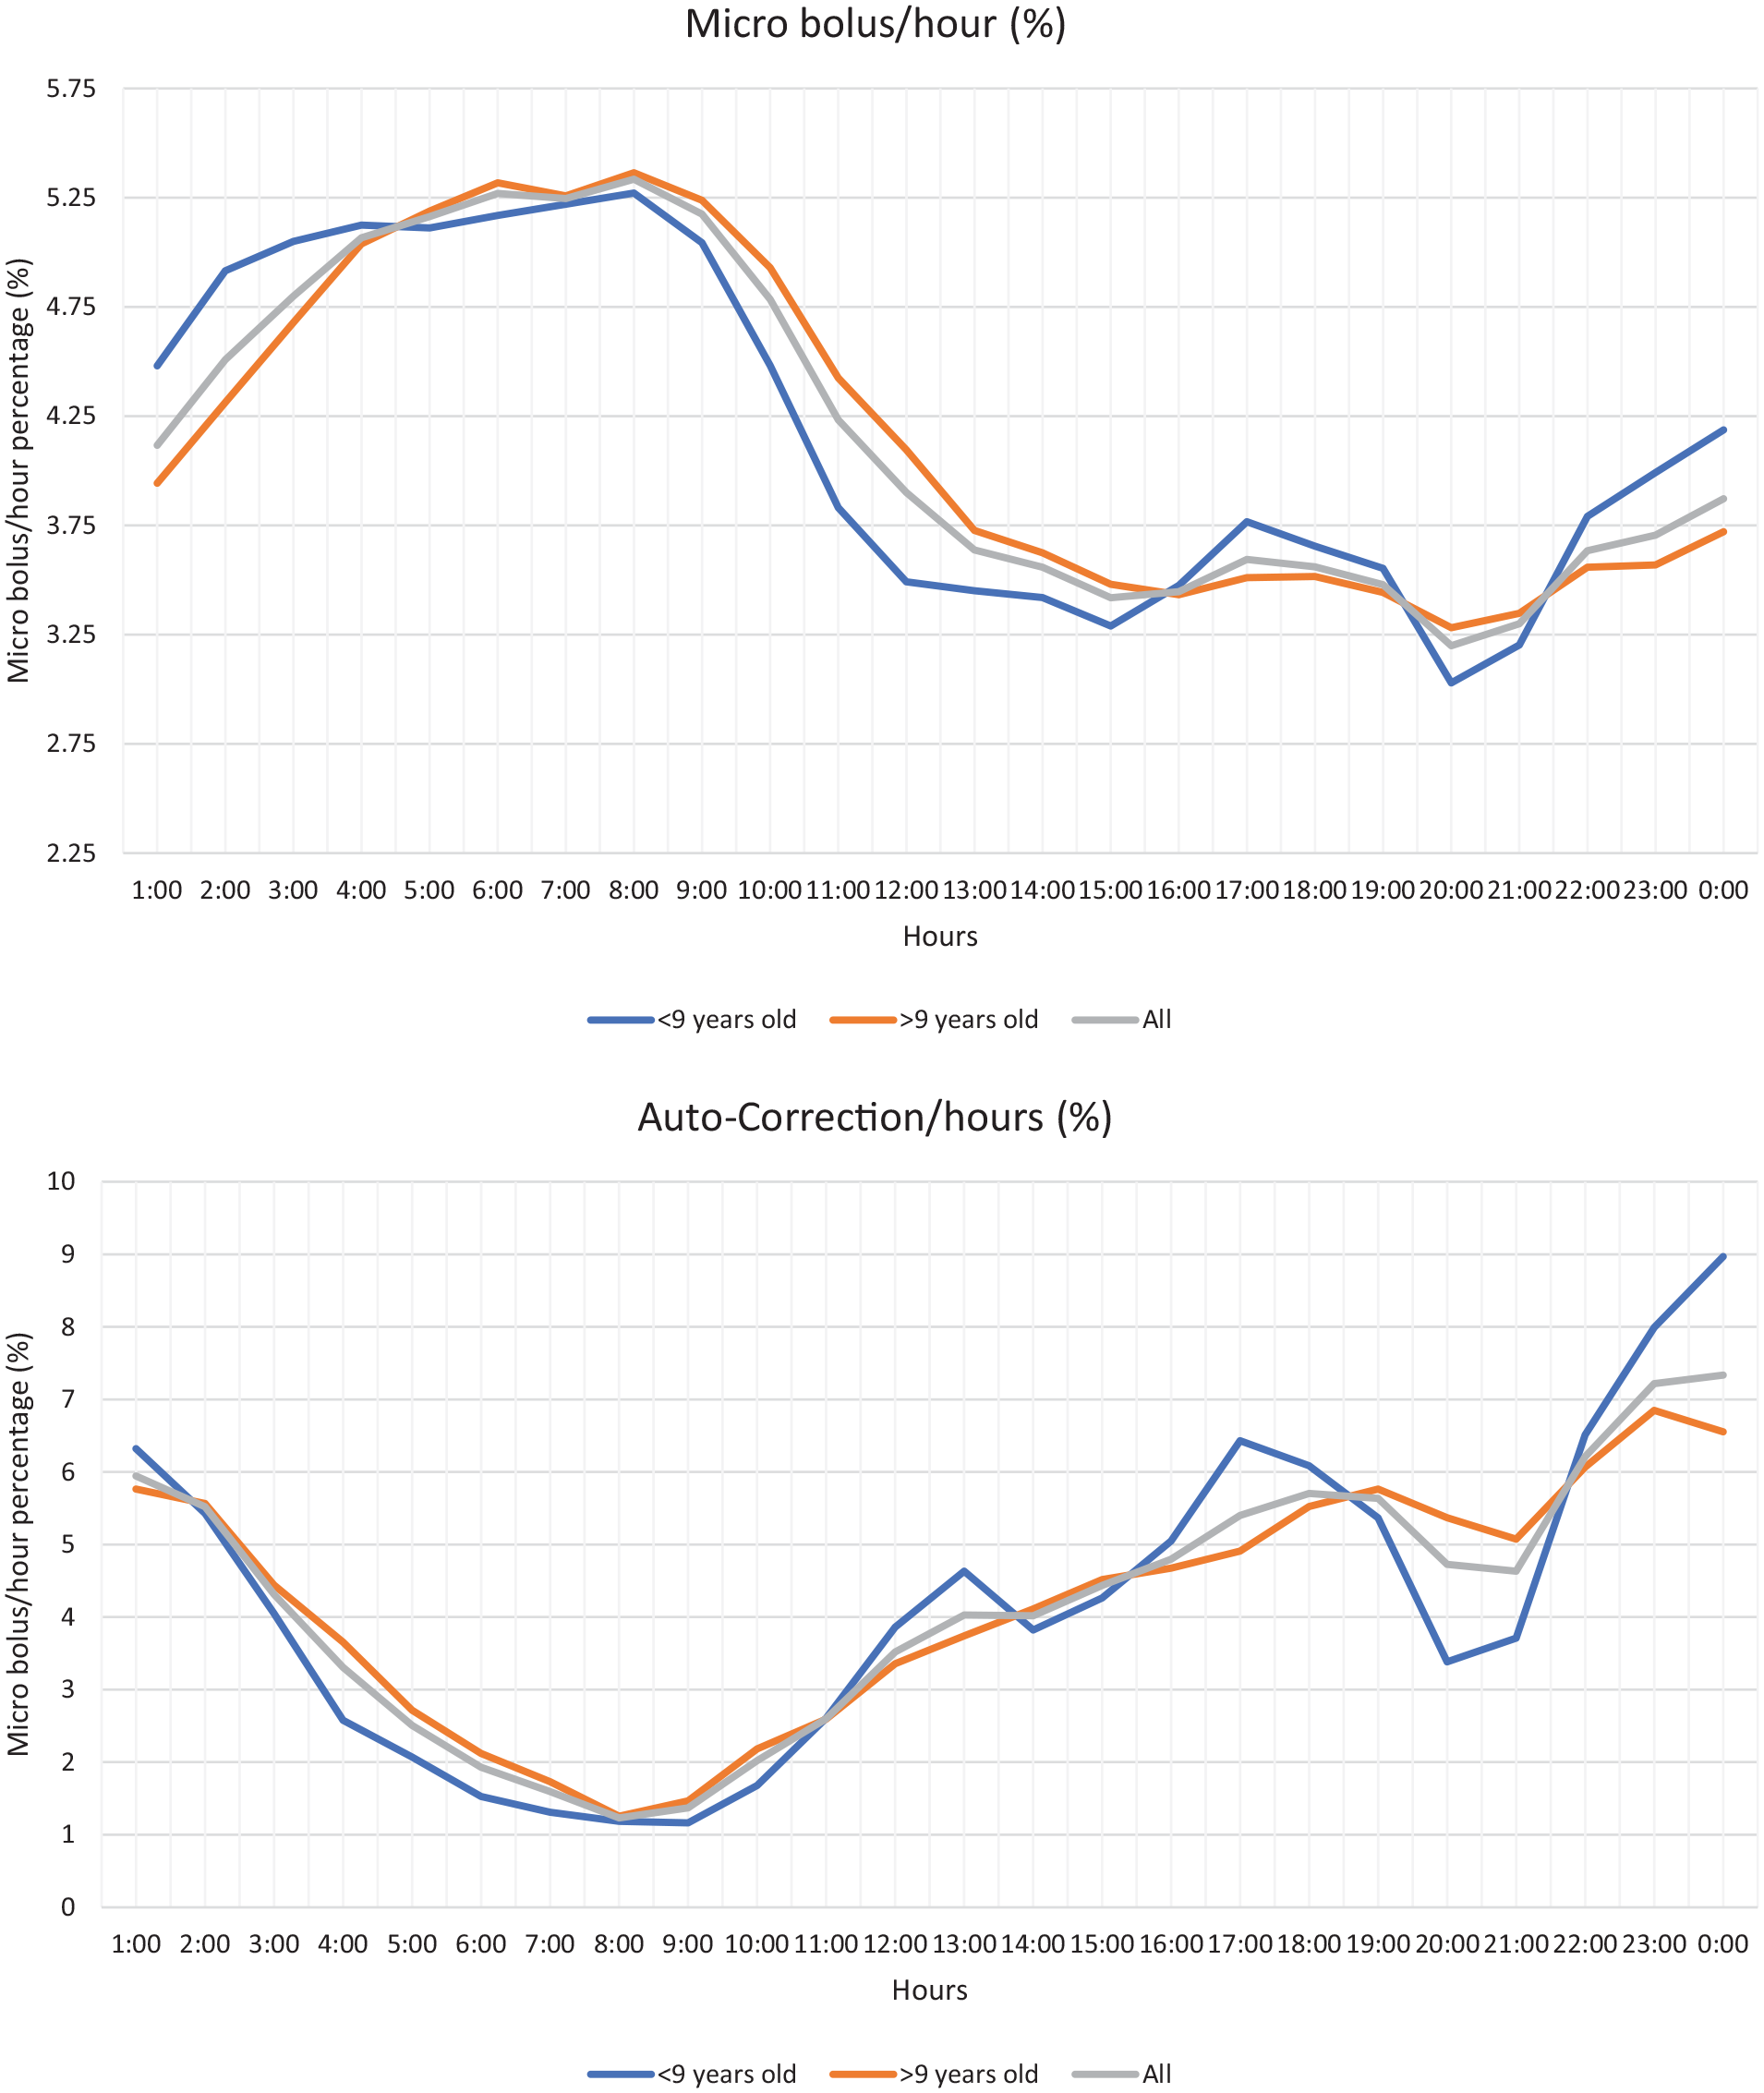
Percentages of micro bolus rates (Upper) and auto-correction bolus rates (Lower) of 2 age groups for 24 hours.
To investigate the micro bolus and auto-correction needs throughout the day, each 24-hour period was divided into eight segments. As noted in Table 2, the highest micro bolus dose was in the 05.00 to 07.00 period, whereas the lowest dose was in the 19.00 to 21.00 period. The micro bolus dose between 03.00 and 10.00 was significantly higher than in the period between 10.00 and 00.00 (P < .001). The micro bolus amount between 00.00 and 03.00 was significantly higher than in the 17.00 to 21.00 interval (P < .002), and the 05.00 to 07.00 interval was significantly higher than the 00.00 to 03.00 interval (P = .008).
Pairwise Comparison of Eight Different Time Intervals of (a) Micro Bolus and (b) Auto-Correction Bolus.
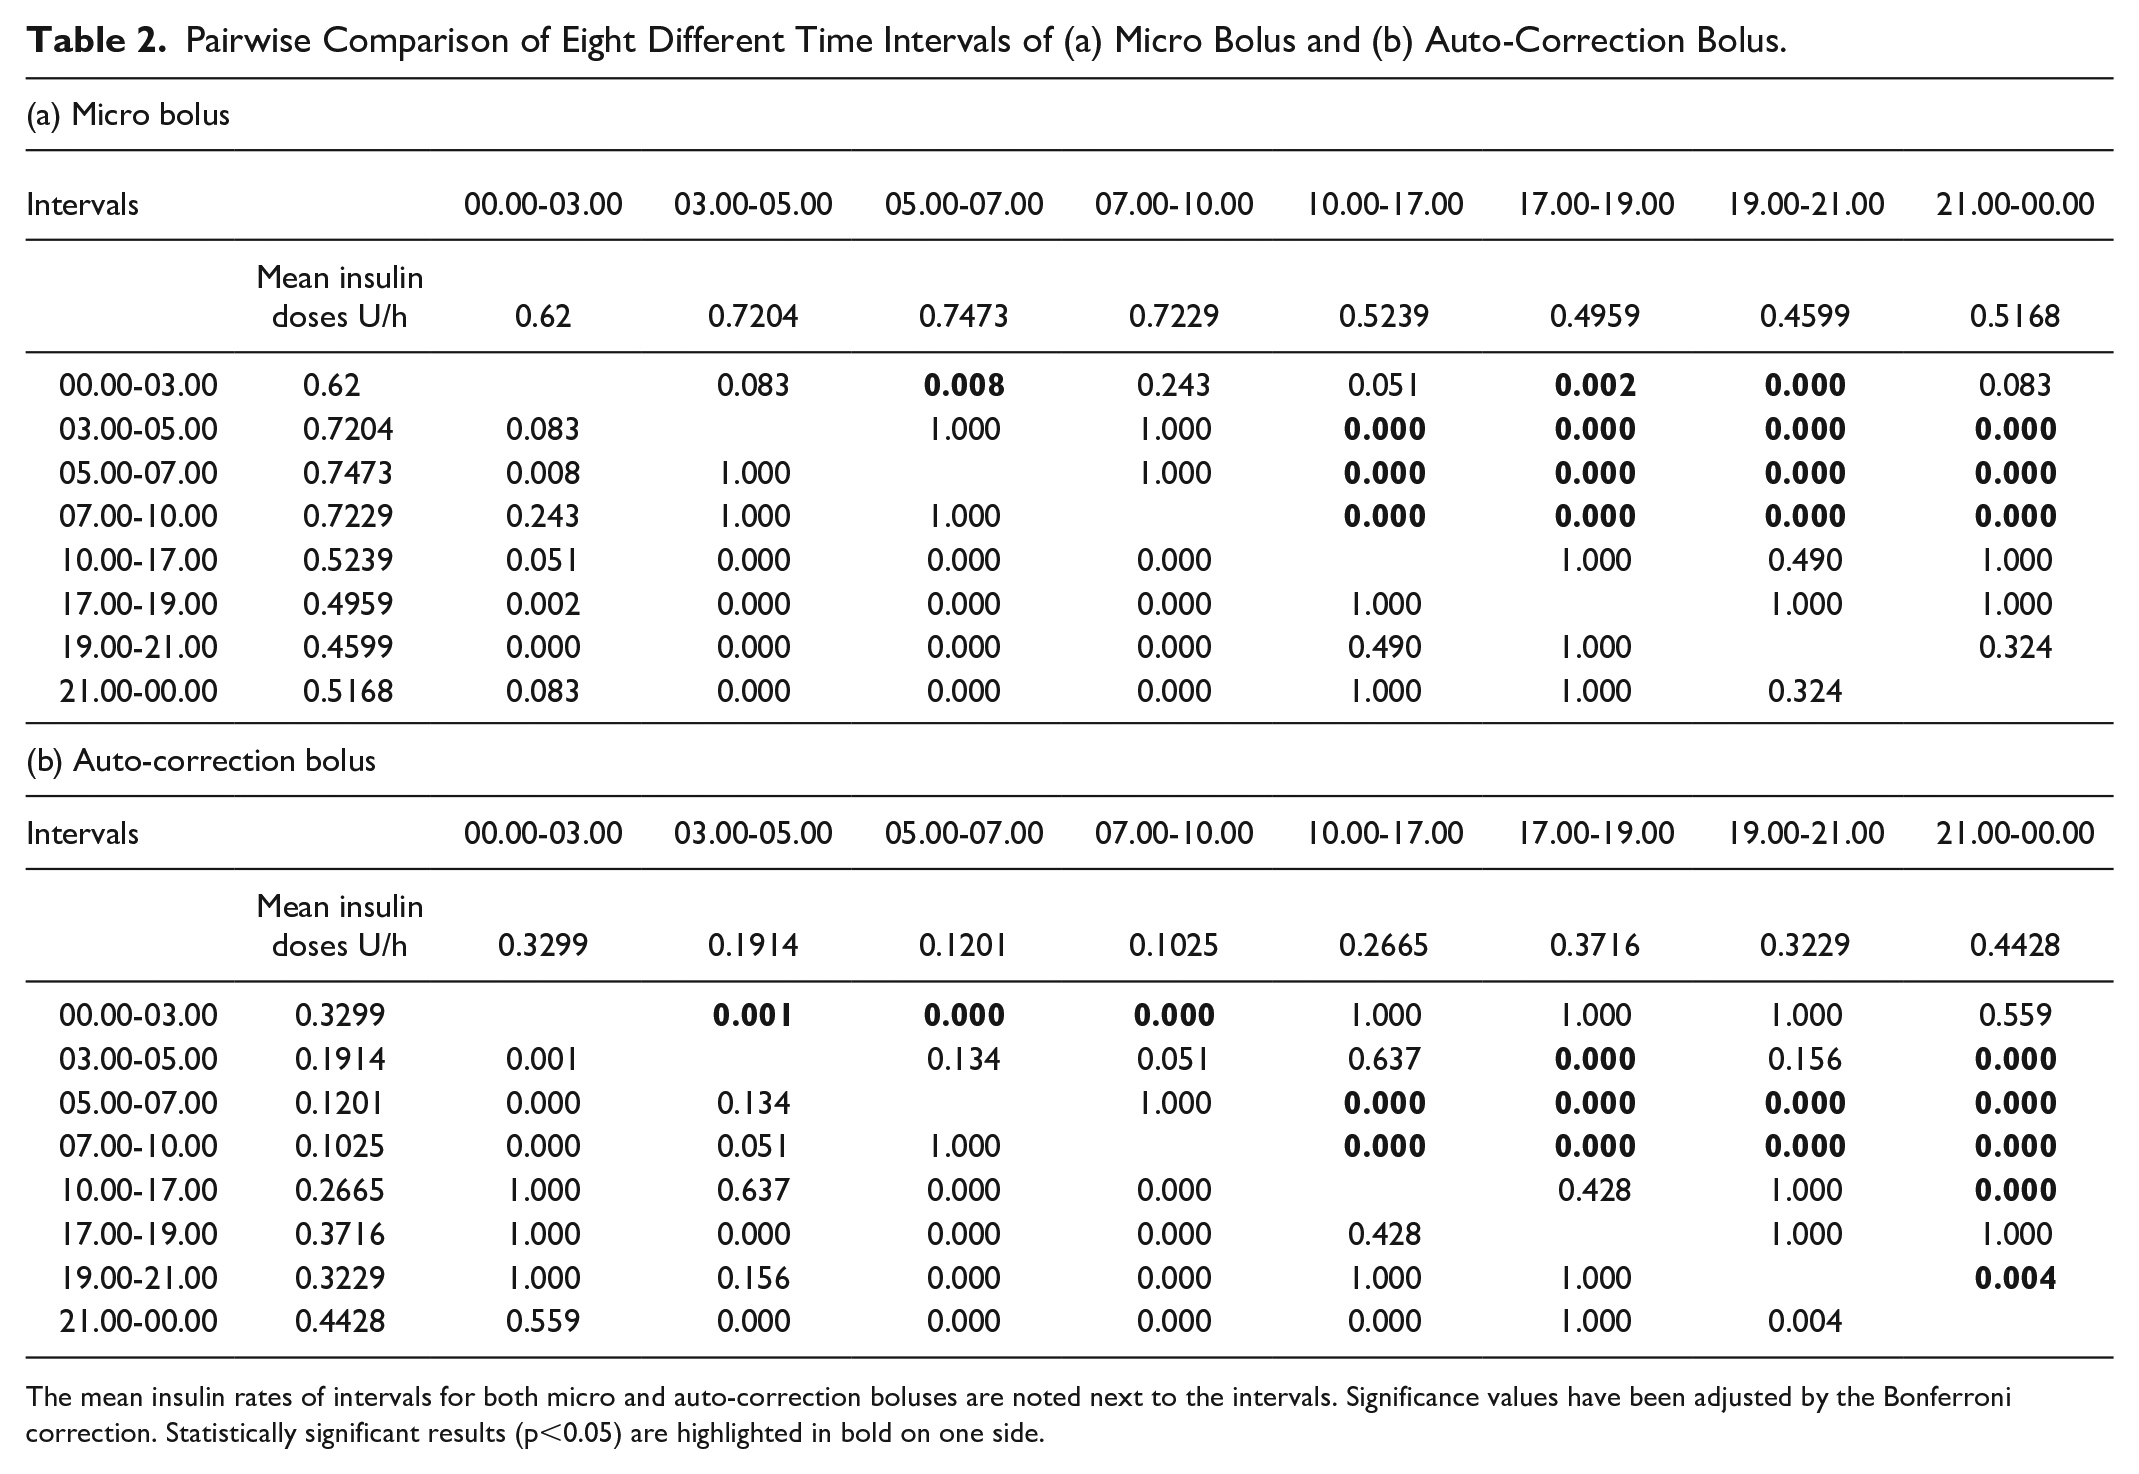
The mean insulin rates of intervals for both micro and auto-correction boluses are noted next to the intervals. Significance values have been adjusted by the Bonferroni correction. Statistically significant results (p<0.05) are highlighted in bold on one side.
The rate of auto-correction insulin dose was the highest in the 21.00 to 00.00 interval, whereas it was the lowest between 07.00 and 10.00. The auto-correction insulin rate between 21.00 and 00.00 was significantly higher than the rates between 03.00-17.00 (P < .001) and 19.00-21.00 (P = .004). In contrast, this rate was significantly lower in the period between 5.00 and 10.00 than the rates between 10.00 and 00.00 (P < .001). The auto-correction dose was significantly higher between 00.00 and 03.00 than between 03.00 and 10.00 (P < .001).
There were differences in the percentages of insulin rates in the eight intervals between the two age groups. As noted in Table 3 and Figure 2, the micro bolus ratio was significantly higher in children below nine years old than in children above nine years old between 21.00 and 00.00 (11.64% vs 10.63%, P = .026) and between 00.00 and 03.00 (14.04% vs 12.65%, P = .003). The auto-correction insulin ratio was significantly higher in children above nine years old between 19.00 and 21.00 (15.62% vs 11.09%, P = .003) and significantly higher in children below nine years old between 21.00 and 00.00 (24.74% vs 19.57%, P = .017).
The Interval Percentages of Mean Micro Bolus and Auto-Correction Rates in Eight Time Intervals and Their Comparison in Between.
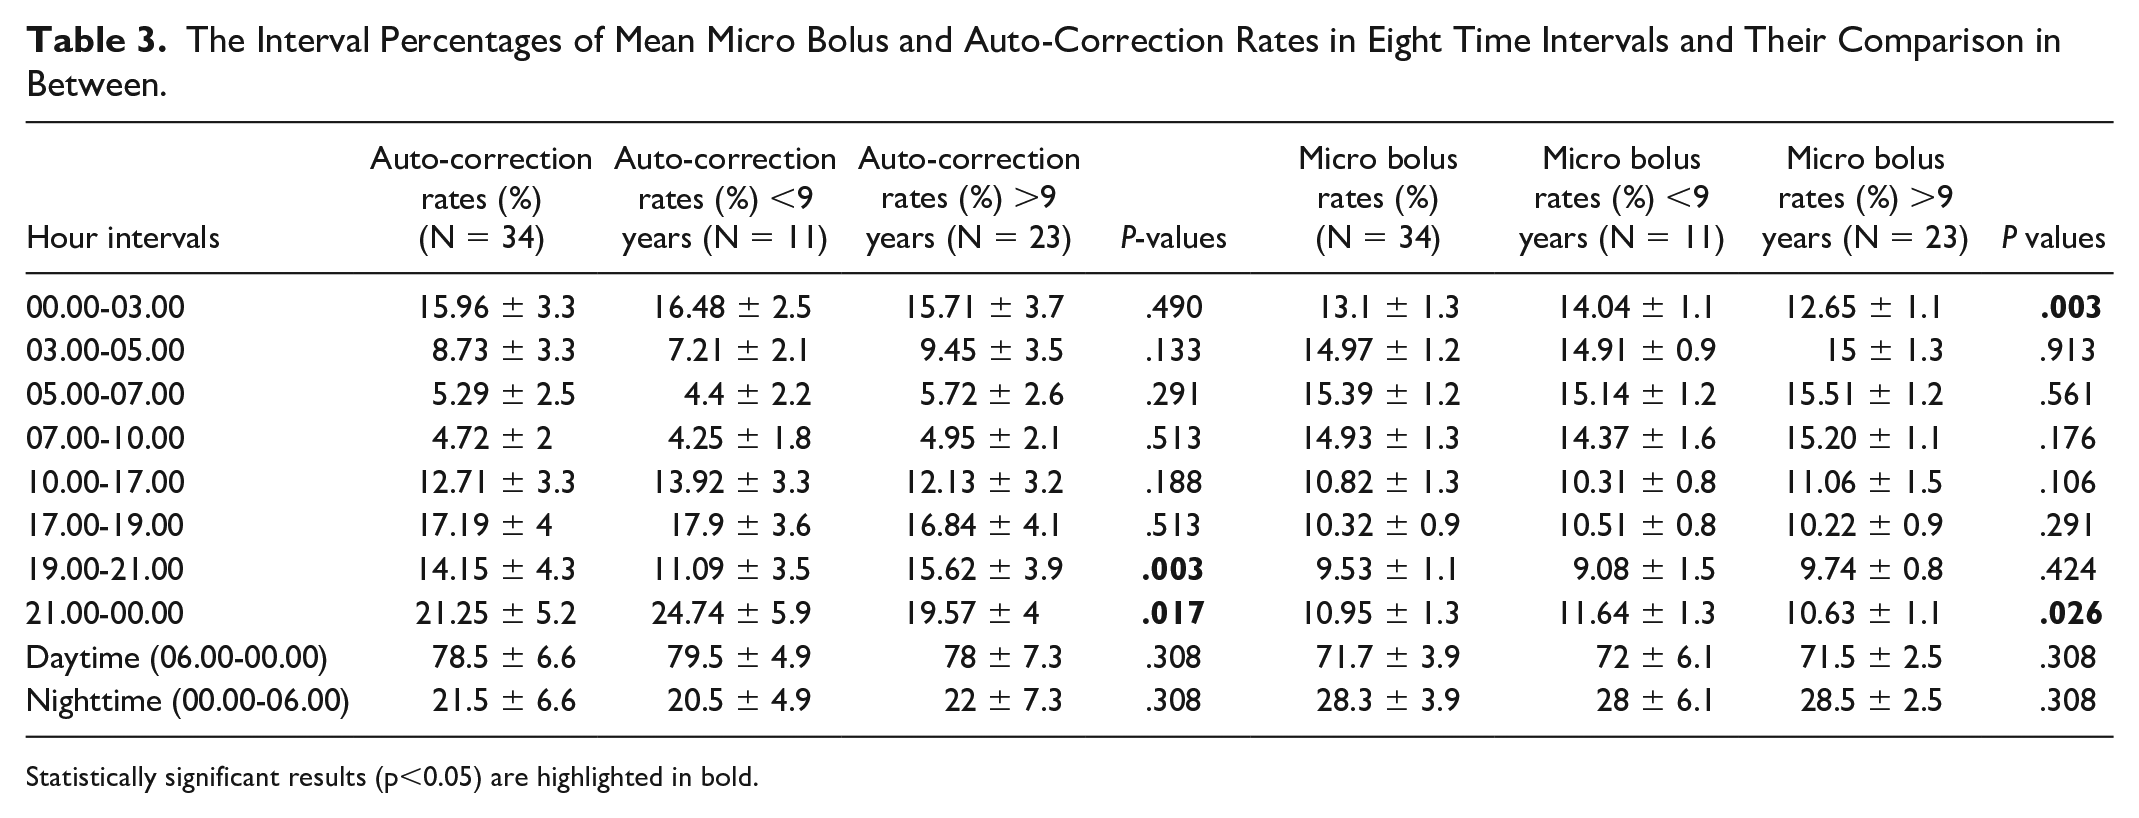
Statistically significant results (p<0.05) are highlighted in bold.
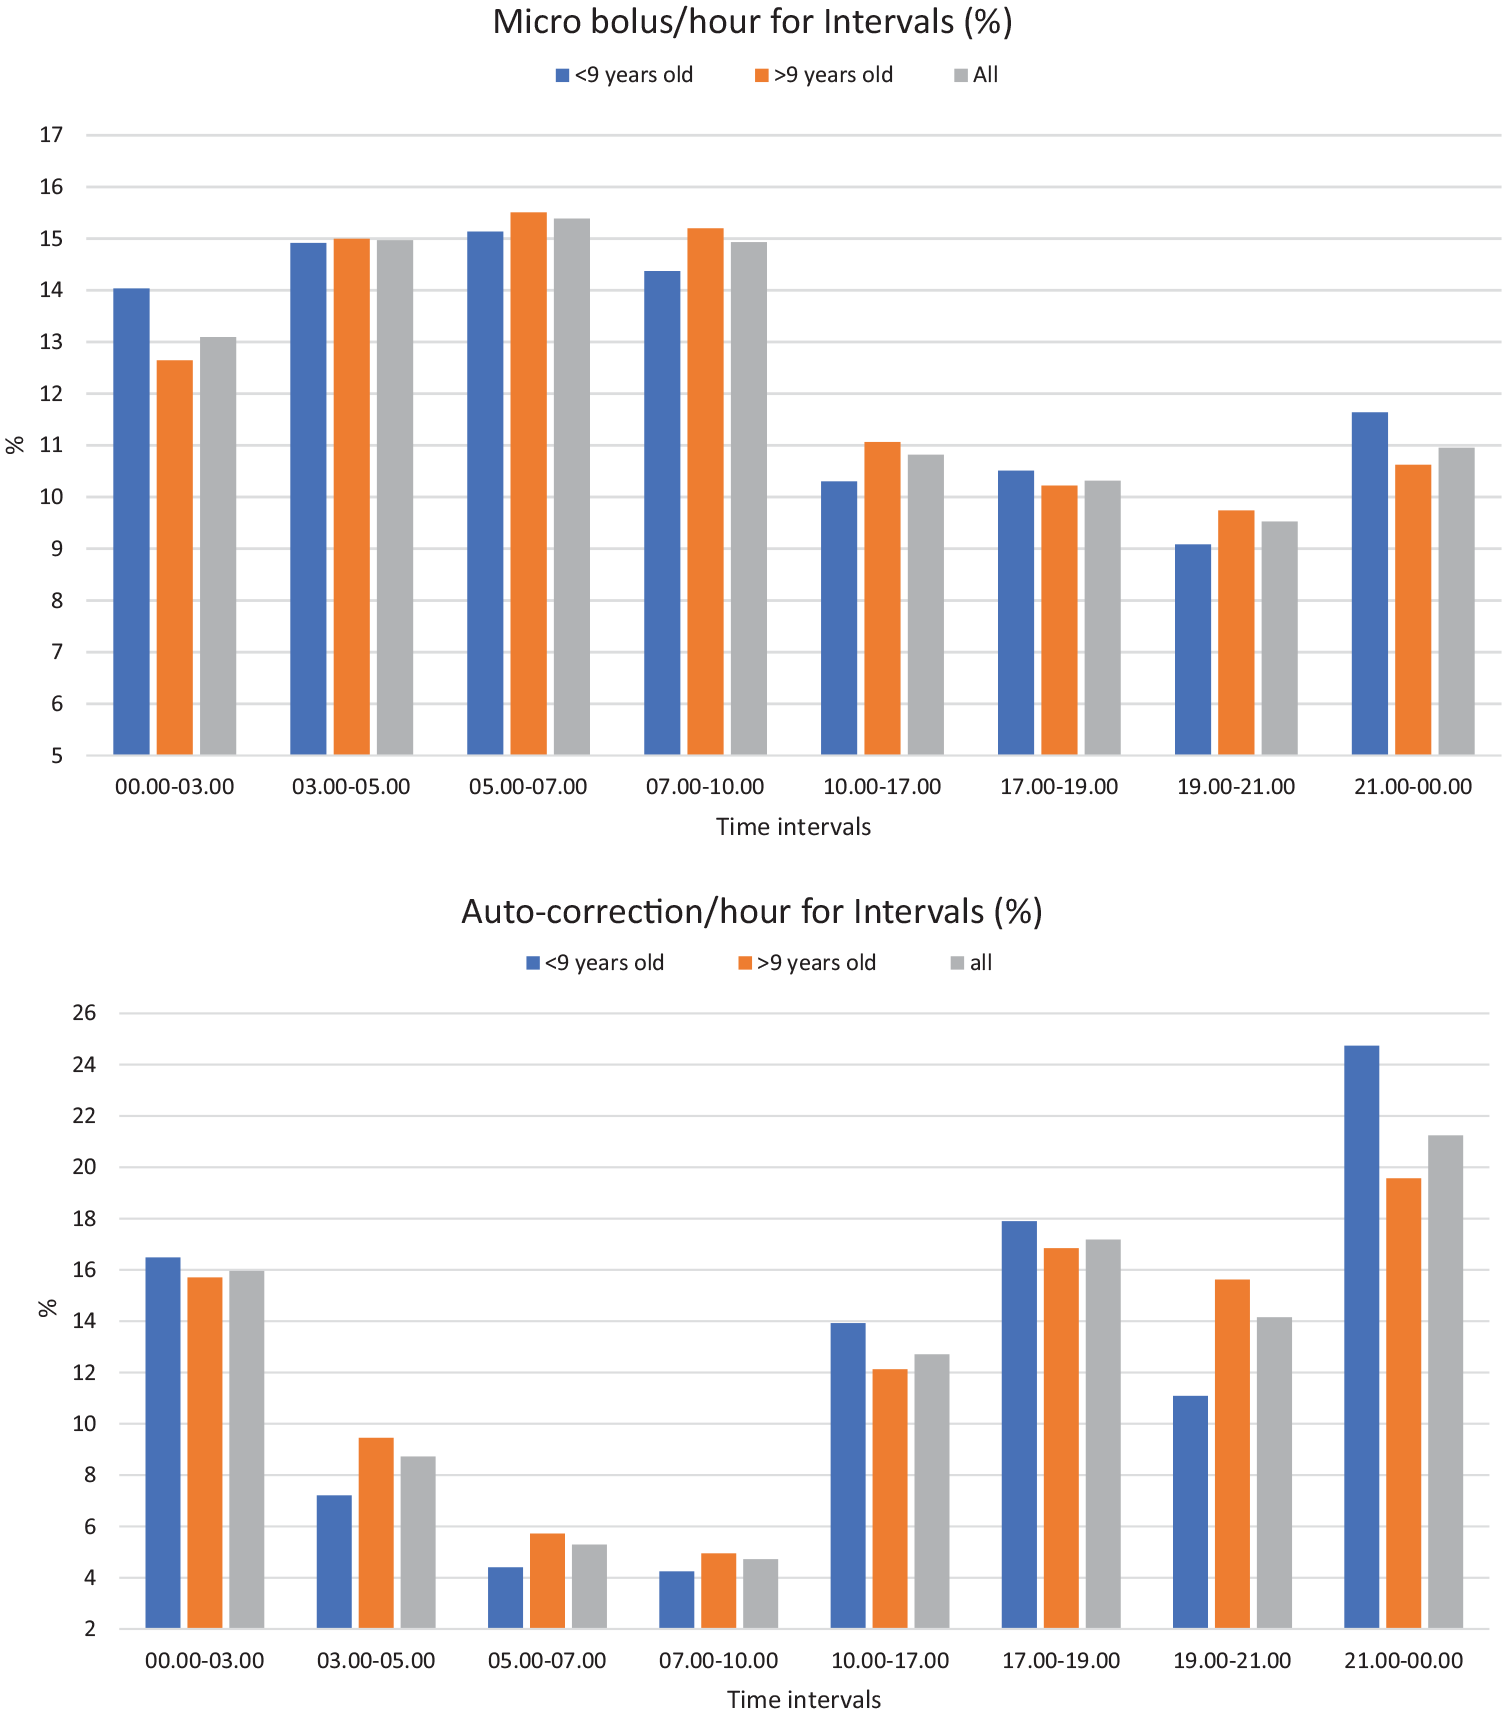
Percentages of micro bolus rates (Upper) and auto-correction bolus rates (Lower) of 2 age groups for 8 time intervals.
The glycemic parameters during the day (06.00-00.00) and night (00.00-06.00) were compared in Table 4. At night, TIR was significantly higher while mean glucose, CV, and TAR1 were significantly lower than in the daytime (P = .001). The mean auto-correction rate/total-day-dose and micro bolus rate/total-day-dose were used to compare age groups for daytime (06.00-00.00) and nighttime (00.00-06.00) using the Mann-Whitney U test. There was no difference between the two age groups for daytime and nighttime micro boluses/total-day-dose (P = .08) and for daytime and nighttime auto-correction boluses/total-day-dose (P = .2).
Comparison of Glycemic Metrics, Micro Bolus Rate, and Auto-Correction Rate Between Daytime and Nighttime.
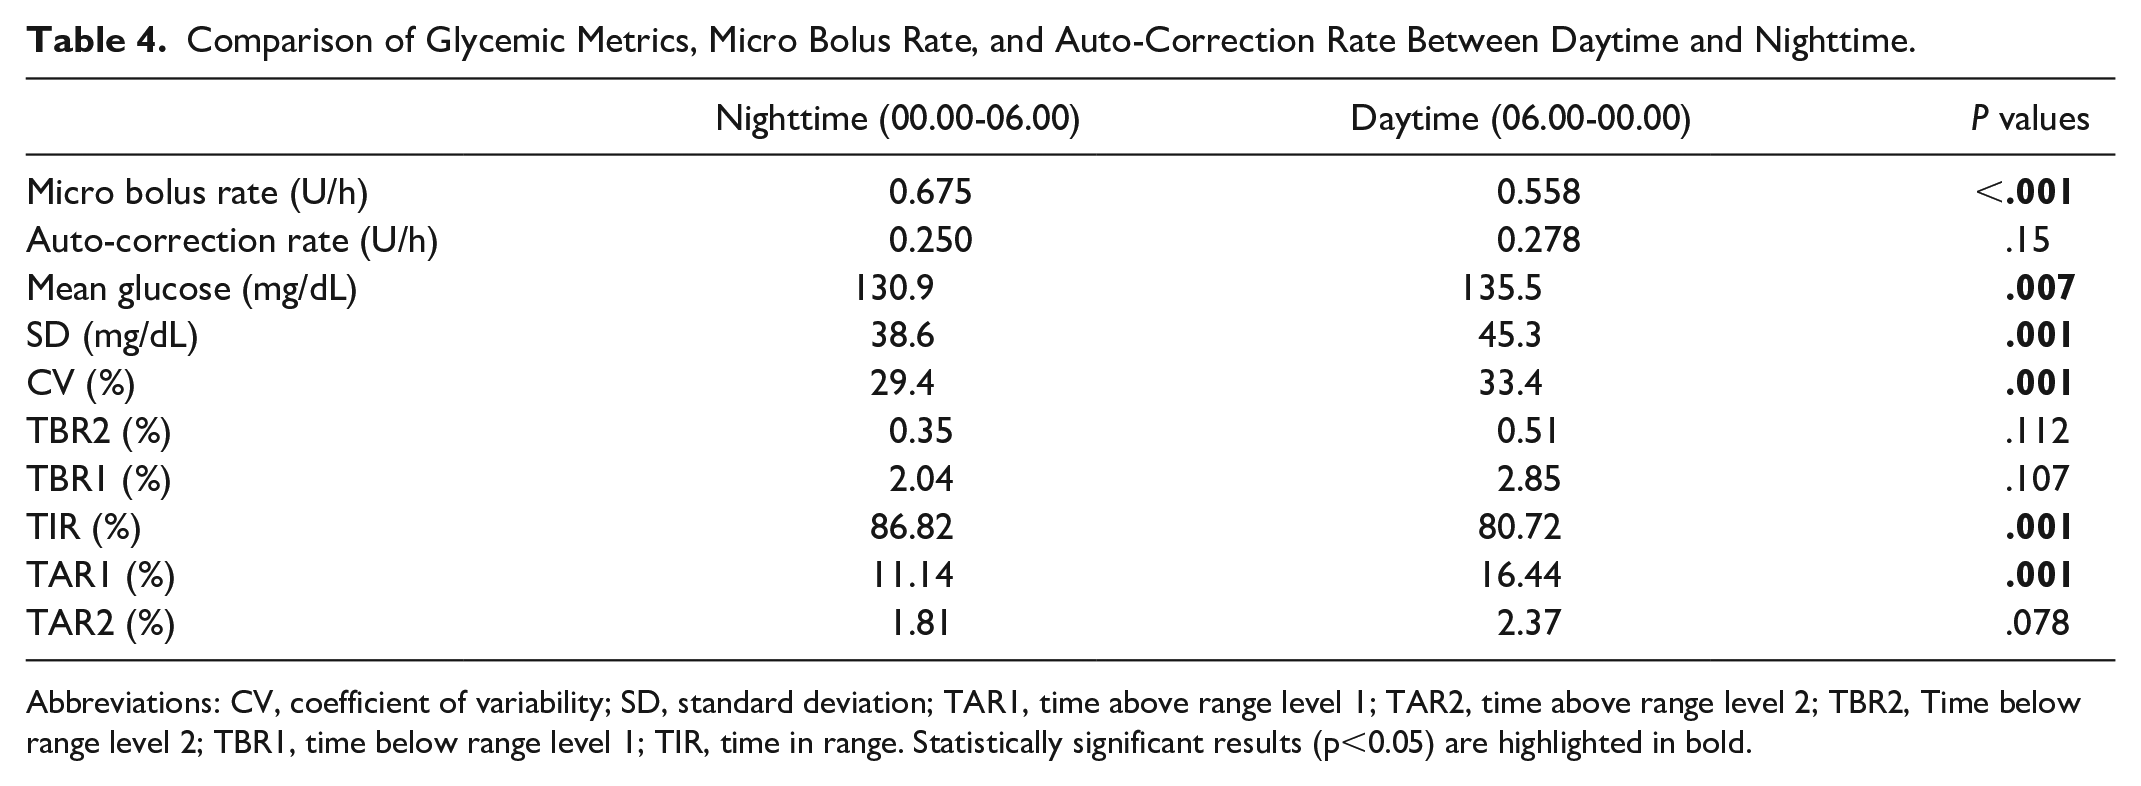
Abbreviations: CV, coefficient of variability; SD, standard deviation; TAR1, time above range level 1; TAR2, time above range level 2; TBR2, Time below range level 2; TBR1, time below range level 1; TIR, time in range. Statistically significant results (p<0.05) are highlighted in bold.
Discussion
This study shows that changing insulin requirements differ according to the diurnal rhythm and these differences occur at different intensities at different time periods across the two age groups. In our study, both age groups had good glycemic control and satisfied all glycemic metrics (TIR = 80%, CV = 33%, GMI = 6.6%, TBR1 = 2%, TBR2 = 0.5%, TAR1 = 14.5%, TAR2 = 2.5%) without significant differences between the age groups. The children had a mean of 1 ± 0.3 carb/RDI carb which shows that they achieved their glycemic targets with recommended carb intake. Nighttime (00.00-06.00) and daytime (06.00-00.00) analysis of CGM data showed a significant increase in TIR and a significant decrease in CV and TAR1 at night compared with daytime, a result that indicates better glycemic control at night, in line with a recent European study. 13 In this respect, the T1D management of both groups was relatively close to optimum treatment that makes our group suitable for this study regarding analysis of insulin subtypes and daily course of basal and correction needs.
An inter-interval comparison of micro bolus showed that the basal insulin requirement changed significantly during the day and night, with an increase in insulin requirement starting at midnight (00.00), peaking at 07.00, and lasting until 10.00. These results are in agreement with the dawn phenomenon and previous studies6,9 in terms of the course and the peak point of the basal rate. Micro bolus rates were significantly low from 10.00 to 00.00 compared with nighttime rates. When the inter-interval comparison of the auto-correction bolus was examined, it was noted that the need for a corrective dose was minimized between 05.00 and 10.00, whereas auto-correction rates increased during the day and reached its peak between 21.00 and 00.00. It is necessary to increase the basal rate during sleep. However, the need for correction is minimal at night as there is no food intake, stress, or physical activity that might cause glucose fluctuation. The better TIR, TAR1, and CV values at night in Table 4 are indicative of successful treatment, especially at night.
The peak point of the auto-correction between 21.00 and 03.00, especially around 00.00, seems to be in line with the reversed dawn phenomenon previously suggested by Nicolajsen et al. 11 The auto-correction rate increase between 21.00 and 03.00 can be explained by the fact that the increase in insulin requirement in the reversed dawn period could not be met by the increase in micro bolus rates; thus, the auto-correction bolus was needed. The fact that both micro bolus and auto-correction rates were significantly higher in children below nine years old than in children above nine years old around midnight shows that the reversed dawn phenomenon is more prominent in preschool children and can still be present even later in adolescence.
The AHCL system achieves better glycemic control with auto-correction alongside the basal insulin algorithm. The strength of adaptive basal insulin infusion is that insulin is delivered as needed based on measured glucose values. It is possible to say that the auto-correction algorithm makes a difference in the functioning of automatic insulin delivery systems and it is also needed at relatively stable times such as at night. As seen in Figures 1 and 2, there is a close pattern between age groups for 24 hours when micro bolus and auto-correction intervals are compared. Meanwhile, the micro bolus rate increased significantly more in the below-nine age group than in the above-nine age group between 21.00 and 03.00 and this supports that the effects of the abovementioned reversed dawn phenomenon are more severe in younger ages. In addition, the auto-correction bolus showed significant elevations at different times across the two groups, unlike the micro boluses. An age-selective increase in auto-correction rates was observed between 21.00 and 00.00 in children below nine years and between 19.00 and 21.00 in children above nine years. The fluctuating course of the <9 years old line in Figure 1 was examined to see whether it was caused by outlier(s) in 11 children and possible outliers were removed; however, no difference was found with minimal change in the graph.
Our study does not provide strong evidence for the existence of the dusk phenomenon. While the auto-correction bolus was high between 17.00 and 19.00 in our study, it cannot be explained with certainty whether this is the dusk phenomenon or the postprandial correction of dinner. This leads us to consider that the tendency toward hyperglycemia in the evening hours, referred to as the Dusk phenomenon, is a tendency in people following multiple daily injection (MDI) therapy, especially due to the termination of the effect of basal insulin administered in the evening.
The lack of TIR values in intervals is the main limitation of this study. If TIR values within intervals were available, micro bolus and auto-correction rates could be evaluated further to assess treatment success across intervals. Data for bedtime and wake-up times could also be useful because sleep is crucial for the diurnal rhythm. Breakfast, lunch, and dinner times and their postprandial analysis regarding wizard and correction doses could provide more information regarding meal management. The timing and the content of fat and protein of dinner may have differed between children; therefore, the high amount of auto-correction in 17.00-19.00 and 19.00-21.00 periods, even in 21.00-00.00 period after high-fat meals may be related to postprandial corrections. Also, while the examined patient-day number was high, a higher number of children could provide stronger evidence.
Postprandial elevations depend on many factors, such as the composition of the meals, snacking after meals, stress, diurnal rhythm, and the effect of fats. These elevations need to be intercepted early. High glucose levels decrease insulin sensitivity, paving the way for a higher elevation later, and sometimes cause a “high glucose cycle.” Although the AHCL algorithm is a good option in terms of reducing postprandial highs, alongside insulin therapy, nutritional structuring (three balanced meals, limiting snacks, avoiding frequent eating, especially after 21.00) should be emphasized more in T1D management. 17 When irregular and unbalanced diet combined with insufficient carbohydrate entry, missed meal boluses, or late delivery of meal boluses, auto-correction bolus amounts would increase in the postprandial period.
Conclusions
This study investigated the basal and correction insulin needs of young children and adolescents throughout the day using AHCL raw data. It is the first study using a closed-loop algorithm to examine insulin need on an hourly basis. The most prominent findings are that basal insulin need follows a diurnal pattern that can be separated into two periods—a high period between 00.00 and 10.00 and a low one between 10.00 and 00.00. The auto-correction rates are low between 05.00 and 10.00 and increase throughout the day peaking between 21.00 and 00.00. These findings are compatible with the dawn and reverse dawn phenomena. Our results can shed light on the diabetes management of people with T1D using MDI or open loop and could be decisive for making modifications to routine practices such as the basal insulin rates for CSII users and timing of basal insulin injection for MDI users.
Footnotes
Acknowledgements
The authors would like to thank Alan J. Newson for English language editing (Alan J. Newson is an Academic proofreader in İstanbul University) and all the families involved in this study for their great efforts in the management of T1D.
Abbreviations
AHCL, advanced hybrid closed loop; CGM, continuous glucose monitoring; CSII, continuous subcutaneous insulin infusion; CV, coefficient variation; EFSA, European Food Safety Authority; GMI, glucose management indicator; RDI, recommended daily intake; TAR, time above range; TBR, time below range; TIR, time in range; T1D, type 1 diabetes.
Declaration of Conflicting Interests
The author(s) declared no potential conflicts of interest with respect to the research, authorship, and/or publication of this article.
Funding
The author(s) received no financial support for the research, authorship, and/or publication of this article.