
Abstract
Background:
Basal rate profiles in patients with type 1 diabetes on insulin pump therapy are subject to enormous inter-individual heterogeneity. Tools to predict basal rates based on clinical characteristics may facilitate insulin pump therapy.
Methods:
Data from 339 consecutive in-patients with adult type 1 diabetes on insulin pump therapy were collected. Basal rate tests were performed over 24 hours. A mathematical algorithm to predict individual basal rate profiles was generated by relating the individual insulin demand to selected clinical characteristics in an exploratory cohort of 170 patients. The predicted insulin pump profiles were validated in a confirmatory cohort of 169 patients.
Findings:
Basal rates (0.27 ± 0.01 IU.d−1.kg−1) showed circadian variations with peaks corresponding to the “dawn” and “dusk” phenomena. Age, gender, duration of pump treatment, body-mass-index, HbA1c, and triacylglycerol concentrations largely predicted the individual basal insulin demand per day (IU/d; exploratory vs prospective cohorts: r2 = 0.518, P < .0001). Model-predicted and actual basal insulin rates were not different (exploratory cohort: Δ 0.1 (95% CI −0.9; 1.0 U/d; P = .95; prospective cohort: Δ −0.5 (95% CI −1.5; 0.6 IU/d; P = .46). Similarly, precise predictions were possible for each hour of the day. Actual and predicted “dawn” index correlated significantly in the exploratory but not in the confirmatory cohort.
Interpretation:
Clinical characteristics predict 52% of the variation in individual basal rate profiles, including their diurnal fluctuations. The multivariate regression model can be used to initiate or optimize insulin pump treatment in patients with type 1 diabetes.
Keywords
Introduction
Severe insulin deficiency in patients with type 1 diabetes necessitates insulin replacement therapy, which can be delivered with the help of insulin pumps.1,2 Insulin pump treatment has the advantage of tailoring basal insulin infusion rates (BIIRs) to individual needs.1,2 Previous work from our group has indicated prominent inter-individual heterogeneity in this respect, 3 with some patients achieving appropriate glycemic control under fasting conditions with almost constant hourly basal insulin infusion rates, and other patients needing a basal insulin infusion profile with prominent diurnal changes, for example, representing the “dawn” phenomenon (progressively increasing insulin needs between midnight and early morning hours). 4 Current recommendations for the initiation of insulin pump treatment do not differentiate with respect to individual needs regarding diurnal variability.5,6 The question arises, whether clinical characteristics of patients with type 1 diabetes (eg, age, obesity, duration of diabetes or pump treatment, quality of glycemic control [glycated hemoglobin (HbA1c)], or laboratory parameters related to insulin resistance or liver steatosis) may influence 24-hour basal insulin needs and/or diurnal variability of basal insulin infusion profiles. If this were the case, this could offer an opportunity to predict individual BIIRs.
To address the potential impact of patient characteristics on individual basal insulin infusion profiles, we re-analyzed a cohort of 339 patients with type 1 diabetes using insulin pumps. Previous analyses regarding this cohort have been published.3,4 We now divided this cohort randomly into an exploratory cohort (170 patients) and a confirmatory cohort (169 patients) in order to model individual BIIRs using a multivariate regression analysis (exploratory cohort), and applying this model for the prediction of basal insulin infusion profiles in the confirmatory cohort. Our results indicate that this model-based prediction offers a promising approach to individualizing recommendations of basal insulin infusion profiles for adult patients with type 1 diabetes using insulin pumps.
Patients and Methods
Study Design
Data for the present analysis were retrospectively collected at the diabetes center Bad Lauterberg as previously described in detail.3,4 All patients had given permission to analyze their clinical data for scientific purposes, and the present study was performed fully complying with pertinent ethical and data protection regulations.
Selection of Study Patients
Patients were included in the present analysis, if they had type 1 diabetes and were treated with continuous subcutaneous insulin infusion (CSII; using any approved model of insulin pump) and were between 16 years and 80 years. Patients were excluded if their diabetes type was different from type 1 diabetes, if they were pregnant at the time of inpatient treatment, or if no basal rate test (BRT) had been performed as a 24-hour fasting period. A flowchart describing the patients retrieved from the original database and reasons for excluding data from the analysis can be found in the supplement of a previous publication using the identical cohort. 3
Data Extraction
Patient characteristics (summarized in Table 1), details of the treatment (supplemental [S1] Table 1) and laboratory values were extracted from medical records. A representative plasma glucose profile after treatment optimization (ie, immediately before discharge) was also obtained.
Subject Characteristics of Patients With Type 1 Diabetes Treated With CSII (Insulin Pumps) Analyzed in the Present Study, by Study Cohorts.
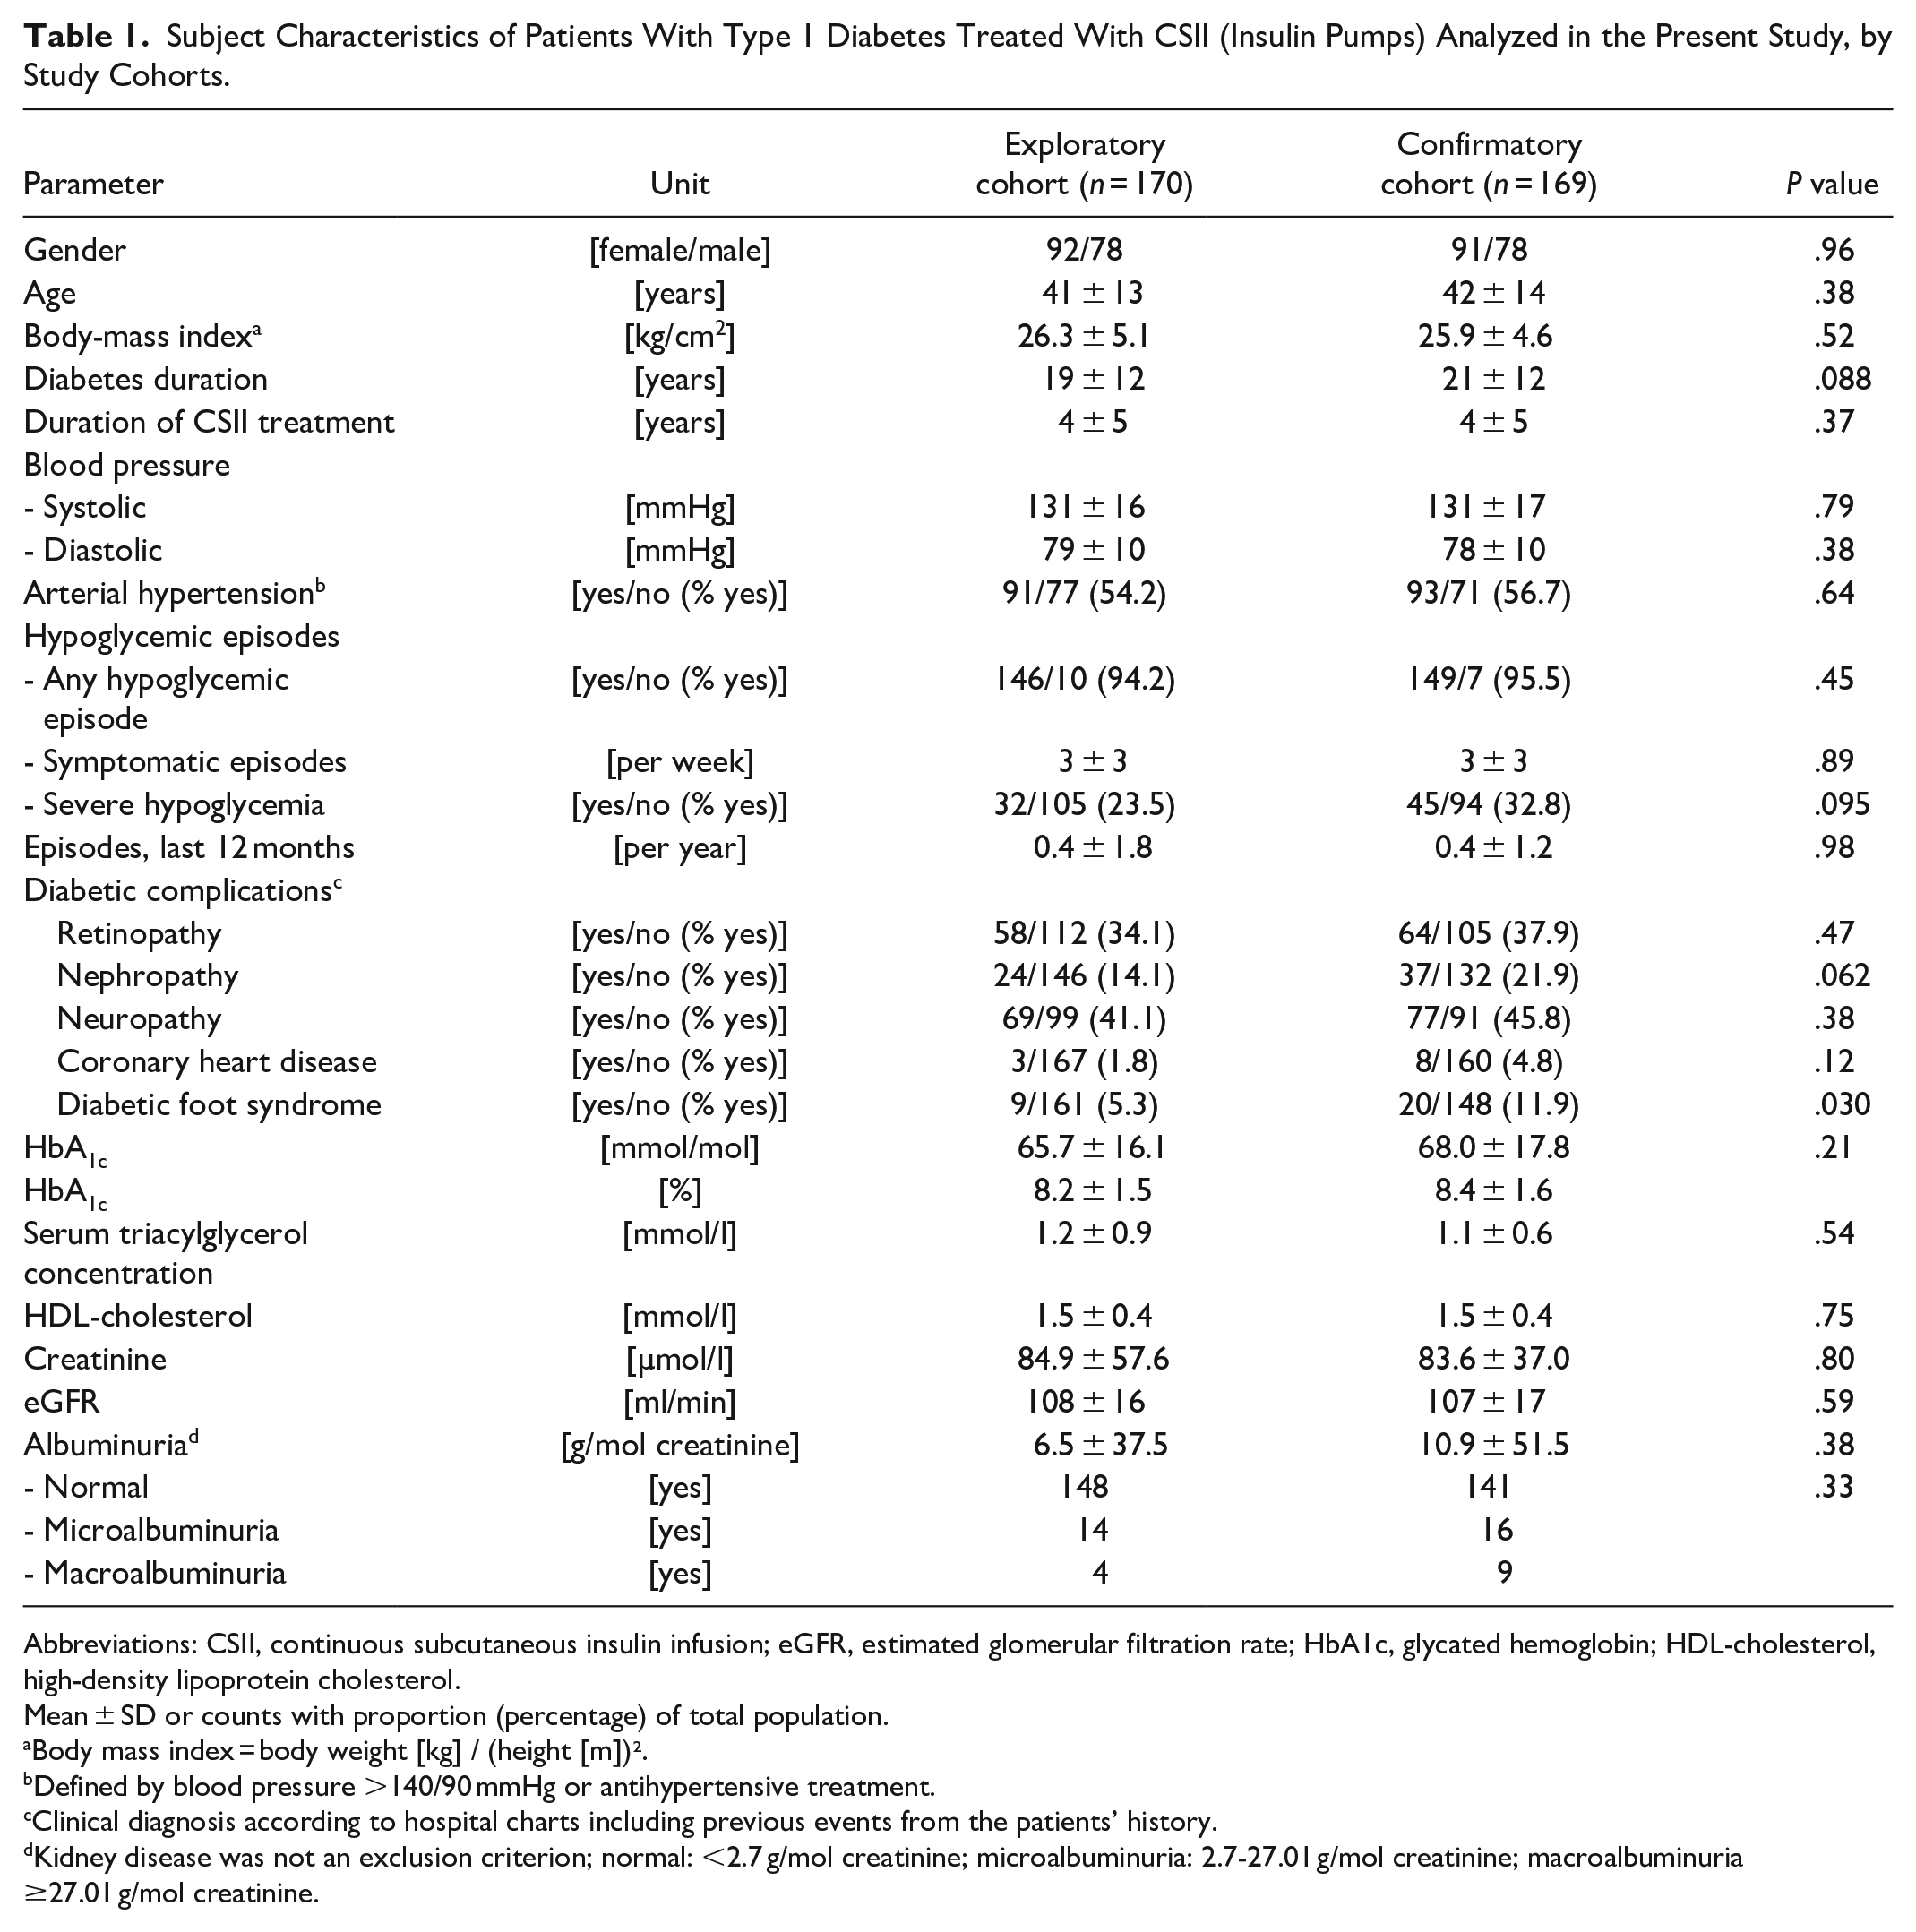
Abbreviations: CSII, continuous subcutaneous insulin infusion; eGFR, estimated glomerular filtration rate; HbA1c, glycated hemoglobin; HDL-cholesterol, high-density lipoprotein cholesterol.
Mean ± SD or counts with proportion (percentage) of total population.
Body mass index = body weight [kg] / (height [m])².
Defined by blood pressure >140/90 mmHg or antihypertensive treatment.
Clinical diagnosis according to hospital charts including previous events from the patients’ history.
Kidney disease was not an exclusion criterion; normal: <2.7 g/mol creatinine; microalbuminuria: 2.7-27.01 g/mol creatinine; macroalbuminuria ≥27.01 g/mol creatinine.
24 Fasting Tests Used for Optimizing Basal Insulin Infusion Profiles
BRTs were performed in a standardized manner over 24 hours, starting at 6 PM, omitting dinner, breakfast, and lunch, or any snacks in between, unless carbohydrate intake was necessary to compensate for low plasma glucose values or hypoglycemia (plasma glucose < 3.9 mmol/L). Fasting was discontinued at 6 PM of the next day. Information gained during these 24-hour fasts was used to optimize BIIR profiles as previously described.3,4
Design of the Analysis
Patients were randomly assigned to one of two cohorts. One hundred and seventy patients formed the “exploratory” cohort, in which a multivariate regression analysis was performed to identify patient characteristics that significantly predict BIIR per day (representing the total BIIR per 24-hour period). In addition, similar analyses were performed for each hour of the day. The remaining 169 patients (“confirmatory cohort”) were used to test whether the predictions of the multivariate regression analysis could be confirmed in an independent population that had not been used to generate the multivariate regression model. Confirmation was achieved, if in this confirmatory cohort the predicted BIIRs were not significantly different from the actual ones, all of which had been validated by BRTs. Further, predicted and actual BIIRs were related to each other by a linear regression analysis. In addition, for each patient, a prediction interval was calculated (Statistica Version 12.0, Statsoft Europe, Hamburg, Germany). Furthermore, the individual differences between the actual and the predicted basal rates and their mean values and 95% confidence intervals were calculated.
For illustration of the individual impact of predictors identified for BIIR profiles, both the exploratory and the confirmatory cohorts were divided into tertiles of clinical characteristics identified as significant predictors of BIIRs by the multivariate regression analysis. BIIRs were compared across these tertiles and between the exploratory and confirmatory cohorts. A special emphasis was given to the inter-individual variation in diurnal changes in BIIRs, the so-called dawn7,8 and dusk phenomena, periods of increased insulin requirements typically coinciding with peaks in BIIR profiles in the early morning and late afternoon hours. The dawn index was calculated by dividing mean basal rates representative of the “dawn” period (1 to 7 AM) by mean BIIRs during a reference period (8 PM to 1 AM and 10 AM to 2 PM) as previously described3,4 The dawn index in the exploratory and confirmatory cohorts were related to each other by the linear regression analysis, as were the dawn and dusk indices for both cohorts.
Statistical Analysis
Patient characteristics are reported as means ± standard deviation (SD) or counts; results are reported as means ± standard error of the mean (SEM). Results of linear regression analysis are presented by the regression equation, the correlation coefficient squared (r2, indicating the proportion of the variance explained by the factors analyzed), and the related P value. Significances of differences between two categories (eg, patient cohorts) were tested by a one-way analysis of variance (ANOVA; continuous variables) or contingency table analysis (Fisher’s exact test for 2 × 2 contingency tables and χ2 test for larger tables [categorical variables]). Significances of differences of values serially determined over time were tested by a repeated-measures ANOVA. The category (eg, exploratory vs confirmatory cohort, or the tertile regarding specific patient characteristics) was used as a fixed independent variable. Results are reported as P values (A) by category, (B) over time, and (AB) by interaction of category and time. If a significant difference according to the category or a significant interaction of category and time was documented (P < .05), one-way ANOVA was used to detect significant differences at specific time points; in case of a significant difference (P < .05), Duncan’s post-hoc test was used to identify differences between any more than two categories (eg, tertiles). P values < .05 were taken to indicate significant differences.
Results
Patient Characteristics
The division of the total cohort into an “exploratory” and “confirmatory” subgroup resulted in two cohorts with balanced characteristics (Table 1). There were only slight differences regarding the presence of diabetic nephropathy (while categories of albuminuria and estimated glomerular filtration rate were not different) and a diabetic foot syndrome (11.9% in the confirmatory cohort vs 5.3% in the exploratory cohort). Diabetic complications were present in a substantial proportion of patients. Overall, the middle-aged study population had had type 1 diabetes for a substantial period of time and had been treated with CSII for several years on average, although new pump users were included in the analysis as well (77% or 45.3% in the exploratory cohort and 66% or 39.1% in the confirmatory cohort, P = .27). Details of insulin replacement are shown in supplemental (S1) Table 2.
Basal Rate Tests (24-Hour Fasts) and Plasma Glucose Profiles on a Representative Day With Regular Meal Rhythm
Plasma glucose concentrations during the 24-hour fasting periods have been presented and analyzed in our two previous manuscripts that studied the relationship of basal insulin infusion profiles and resulting plasma glucose concentrations during 24-hour fasting periods. Mean plasma glucose concentrations were in an acceptable range throughout the 24-hour period (3; 4). Plasma glucose concentrations during BRTs were stable around 6.6 ± 0.1 mmol/L in both the exploratory and confirmatory cohorts. There were diurnal variations with relatively higher concentrations between midnight and 2 AM in both cohorts, as previously described for the whole cohort.3,4
Multivariate Regression Analysis
Patient age, gender, body mass index, duration of insulin pump treatment, glycated hemoglobin, and serum triacylglycerol (TAG) concentrations were identified as significant predictors of the total daily BIIR expressed in IU per day (overall model: r2 = 0.518; P < .0001; supplemental [S1] Table 1), indicating that 52% of the variation in BIIR could be predicted by the model. The same factors were able to predict BIIR for each hour of the day with similar precision. Supplemental (S1) Table 3 lists the coefficients used to predict BIIR (total per day and broken down into hours of the day) from the multivariate regression models based on BIIRs expressed as IU per hour or per day.
It should be noted that there were significant correlations of the duration of pump treatment with age (y = 0.80 x + 38.5; r2 = 0.093, P < .0001) and diabetes duration (y = 0.66 x + 18.6; r2 = 0.094; P < .0001).
BIIRs predicted by the multiple regression model were not significantly different from the actual ones in the exploratory and confirmatory cohorts (Figures 1 and 2). Predictions (eg, confirmatory cohort, 21.8 ± 0.7 IU/d) differed from actual BIIRs (21.8 ± 0.5 IU/d) by 0.1 (95% CI −0.9 to 1.0) IU/d, with 75.8% of the predictions deviating by <6 IU/d (ie, by <27.5%; Figure 2[c]), 55.9% of the predictions deviated by <4 IU/d (ie, by <18.3%), and 34.8% of the predictions deviated by <2 IU/d (ie, by <9.2%).
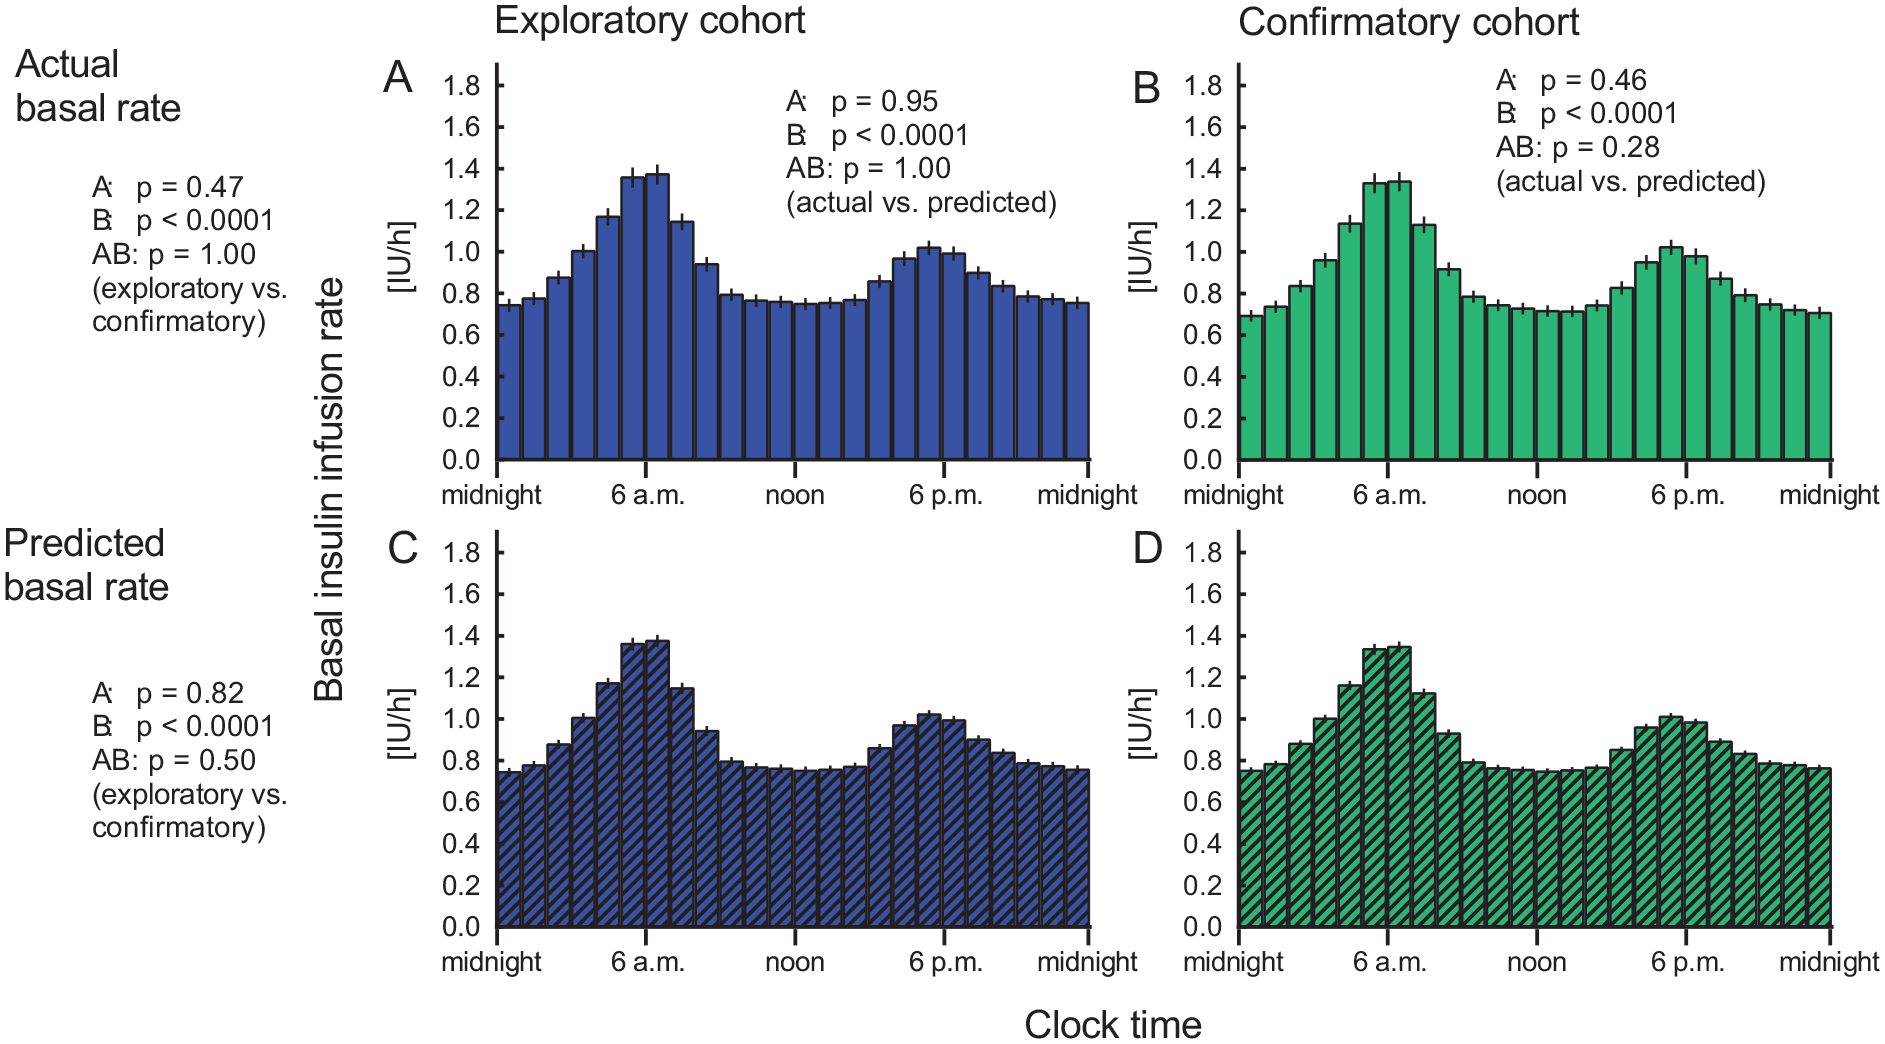
BIIR profiles after optimization of glycemic control. Actual (a, b) and predicted (c, d) BIIR (multivariate regression analysis) expressed as IU per hour are shown for the exploratory cohort (patients whose data were used to generate the multiple regression model; left panels, a, c) and for the conformation cohort (patients used to independently verify the predicted basal rates; right panels, b, d). Mean ± SEM. Statistical analysis: P values report results of the repeated-measures ANOVA (A: By cohort; B: By time; AB: By interaction of cohort and time) comparing actual and predicted basal rates (depicted in the top row of panels) and between the exploratory and the confirmatory cohort (depicted to the left of panels a and c).
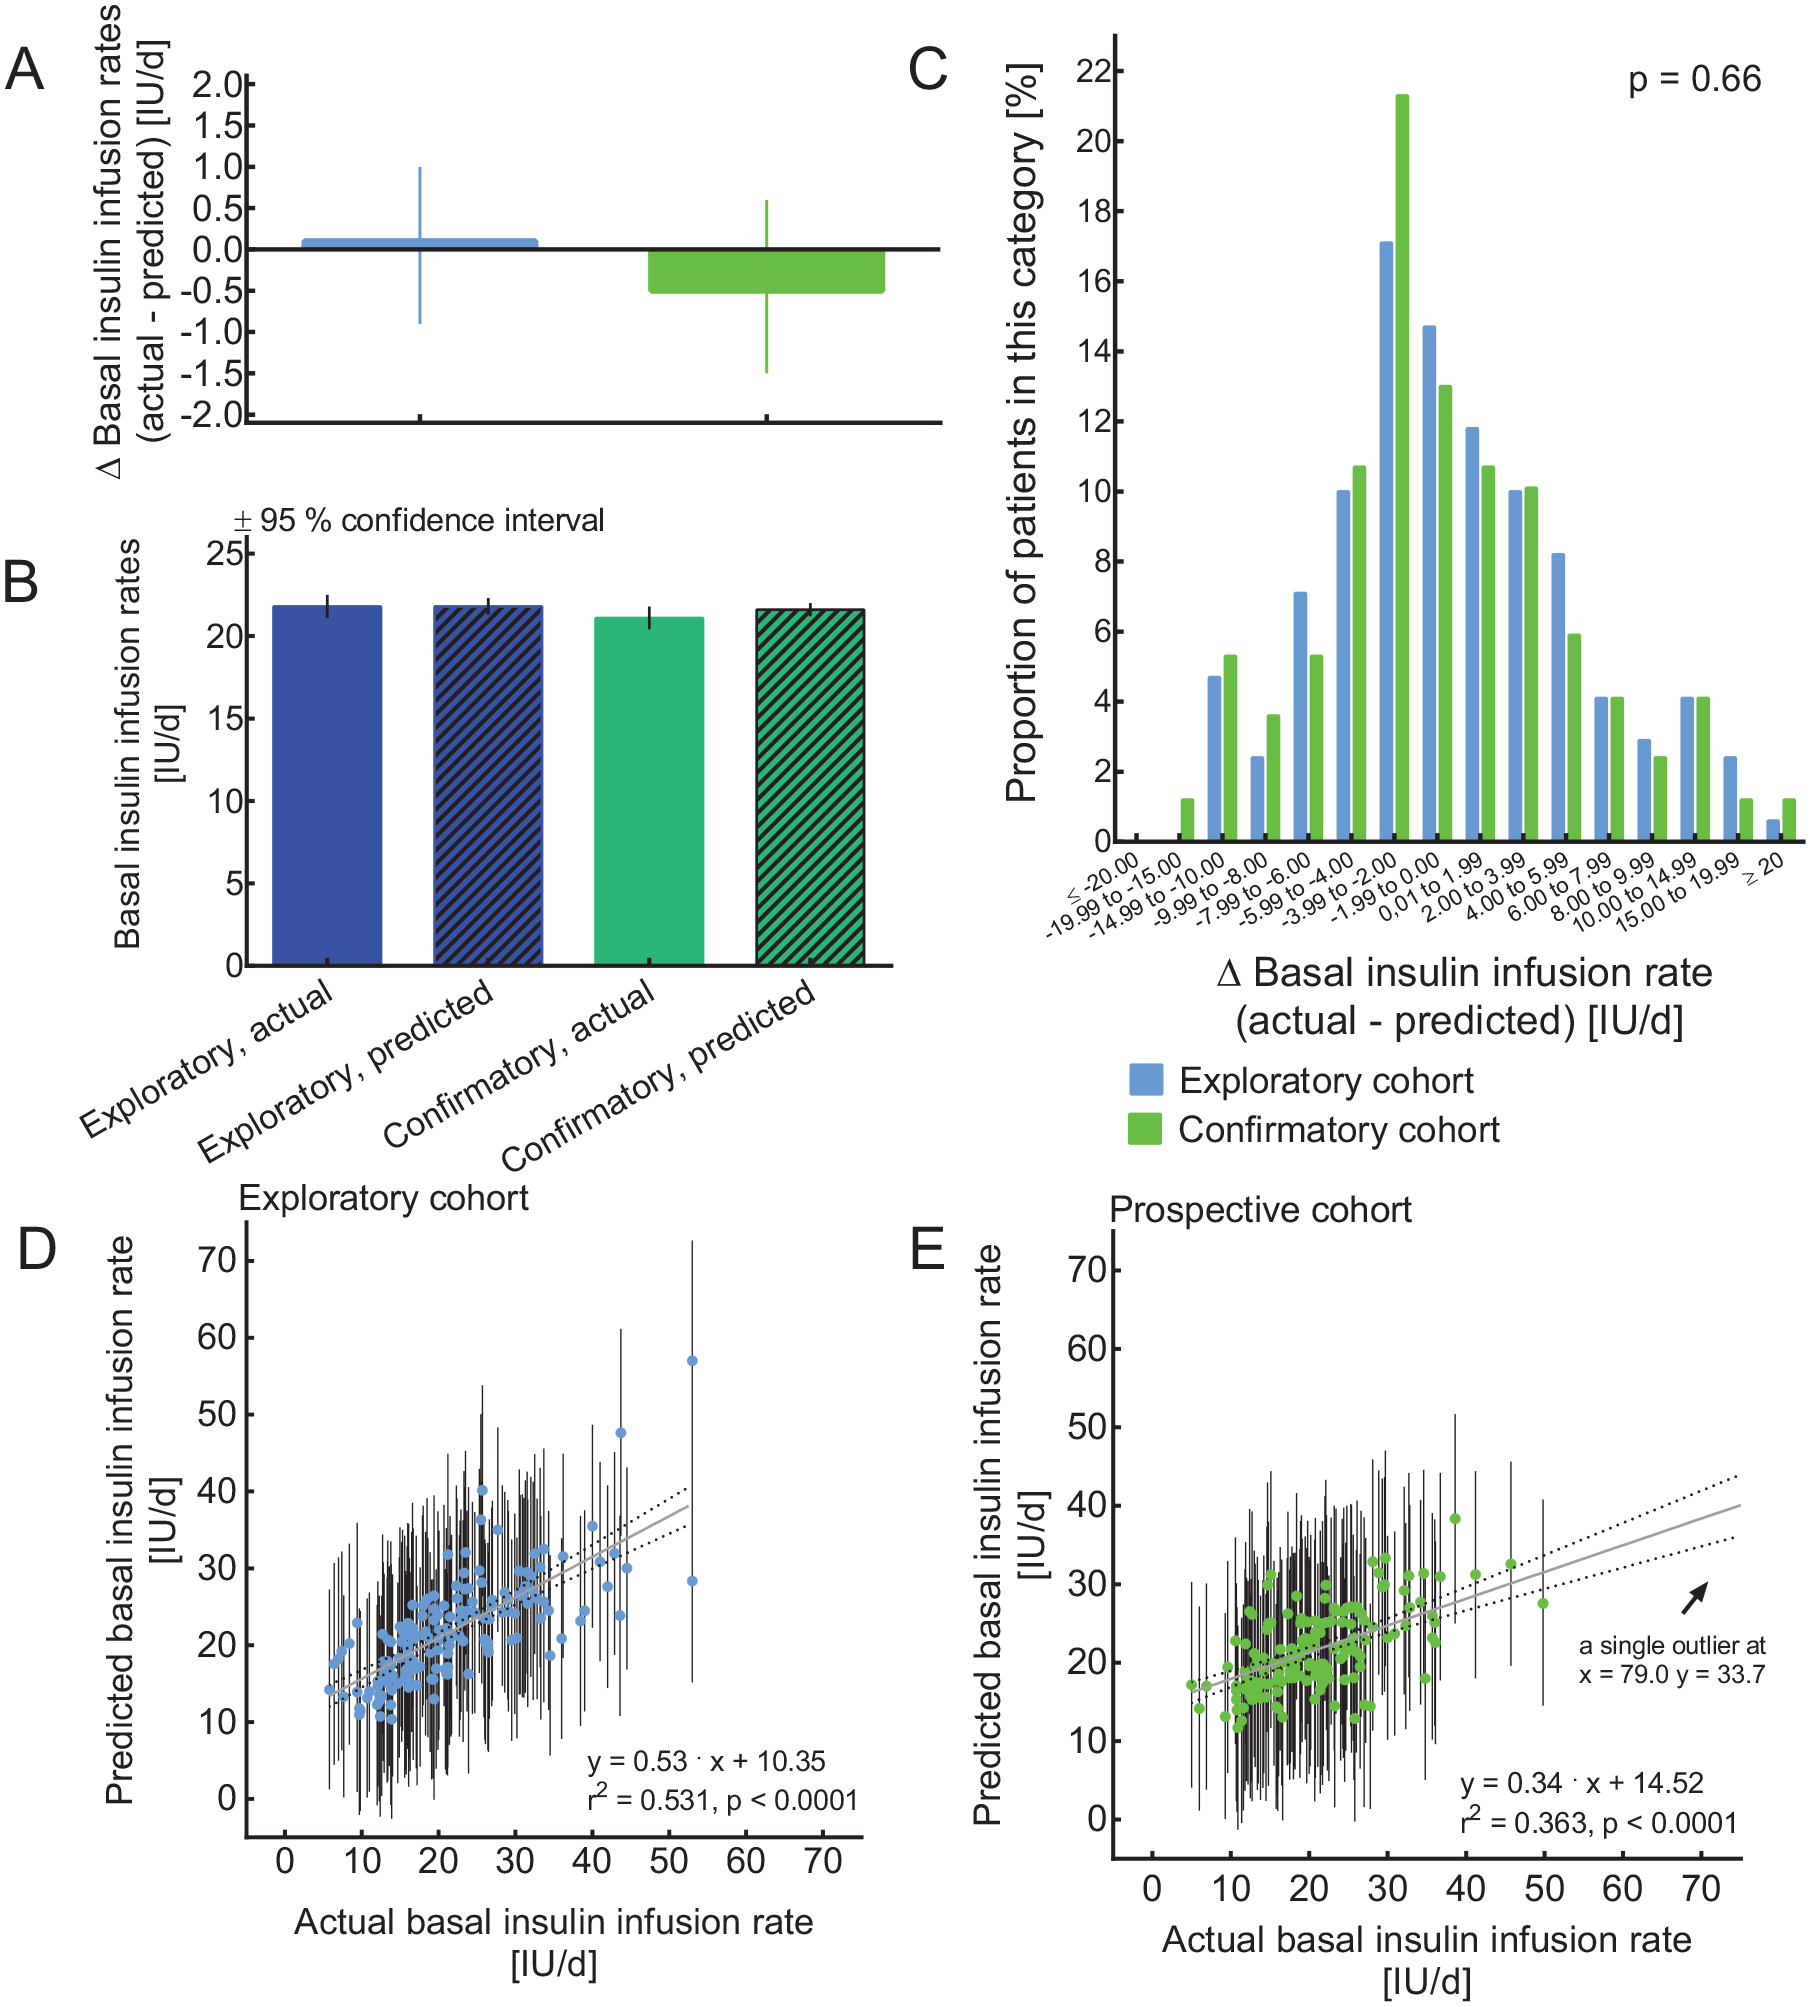
Correspondence of predicted with actual (validated) BIIRs per day (IU/d) in the exploratory and confirmatory cohorts of insulin pump-treated subjects with type 1 diabetes. (a) BIIRs (±SEM); (b) difference between actual and predicted BIIRs (±95% confidence interval); (c) histogram depicting the distribution of differences (Δ) between actual and predicted BIIRs. Regression analysis of actual versus predicted total daily BIIR (expressed per day, ie, disregarding body weight) to validate the multivariate regression analysis in the exploratory cohort (d) and the confirmation cohort (e). Bars depict individual prognosis intervals calculated using the multiple regression model. The regression equations, the correlation coefficient squared (r2), and the P value indicating the significance of the association are shown. For each patient, the relevant characteristics (age, gender, body mass index, duration of insulin pump treatment, HbA1c, and serum triacylglycerol concentrations; see supplemental [S1] Table 1) were imputed to generate the individual predictions and their prognosis interval.
There was a significant correlation between individual actual BIIRs and those predicted by the multiple regression model in both the exploratory (Figure 2[d]) and confirmatory (Figure 2[e]) cohorts. The association was weaker in the confirmatory cohort, and the regression equations for both cohorts were significantly different from each other (P = .0026). Individually calculated prognosis intervals indicate the 95% confidence range of individual predictions (Figure 2[d] and [e]).
Diurnal Variation in BIIRs
There was wide inter-individual variation regarding the magnitude of the transient increments in insulin needs corresponding to the “dawn” and “dusk” phenomena, as previously described3,4. Overall, similar diurnal variations in BIIRs were predicted by the multivariate regression model as were found for actual BIIRs (Figure 1). A mean “dawn” index of around 1.5 was found for actual and predicted BIIRs, both for the exploratory and the confirmatory cohorts (details not shown). However, actual and predicted “dawn” index only significantly correlated in the exploratory cohort, not in the confirmatory cohort, in which just a trend was documented (supplemental [S1] Figure 1).
Nature of the Influence of Relevant Patient Characteristics on BIIR
To illustrate the influence of those variables that in the multiple regression analysis had a significant influence on BIIR, BIIRs in the confirmatory cohort have been analyzed by tertiles of age, body mass index, duration of insulin pump treatment, HbA1c, and serum TAG concentrations as well as by gender (female vs male patients; Figure 3; supplemental [S1] Table 3). Older age attenuated the dusk phenomenon. Male patients were characterized by higher BIIR all day and, in particular, a more prominent dawn phenomenon. A higher body mass index increased BIIR throughout the 24-hour period. A longer duration of insulin pump treatment was associated with an attenuated dawn and dusk phenomenon and an overall flatter BIIR profile. A higher HbA1c predicted higher BIIR throughout the 24-hour period. Higher serum TAG concentrations increased BIIR, especially during the dawn and dusk phenomenon periods (Figure 3).
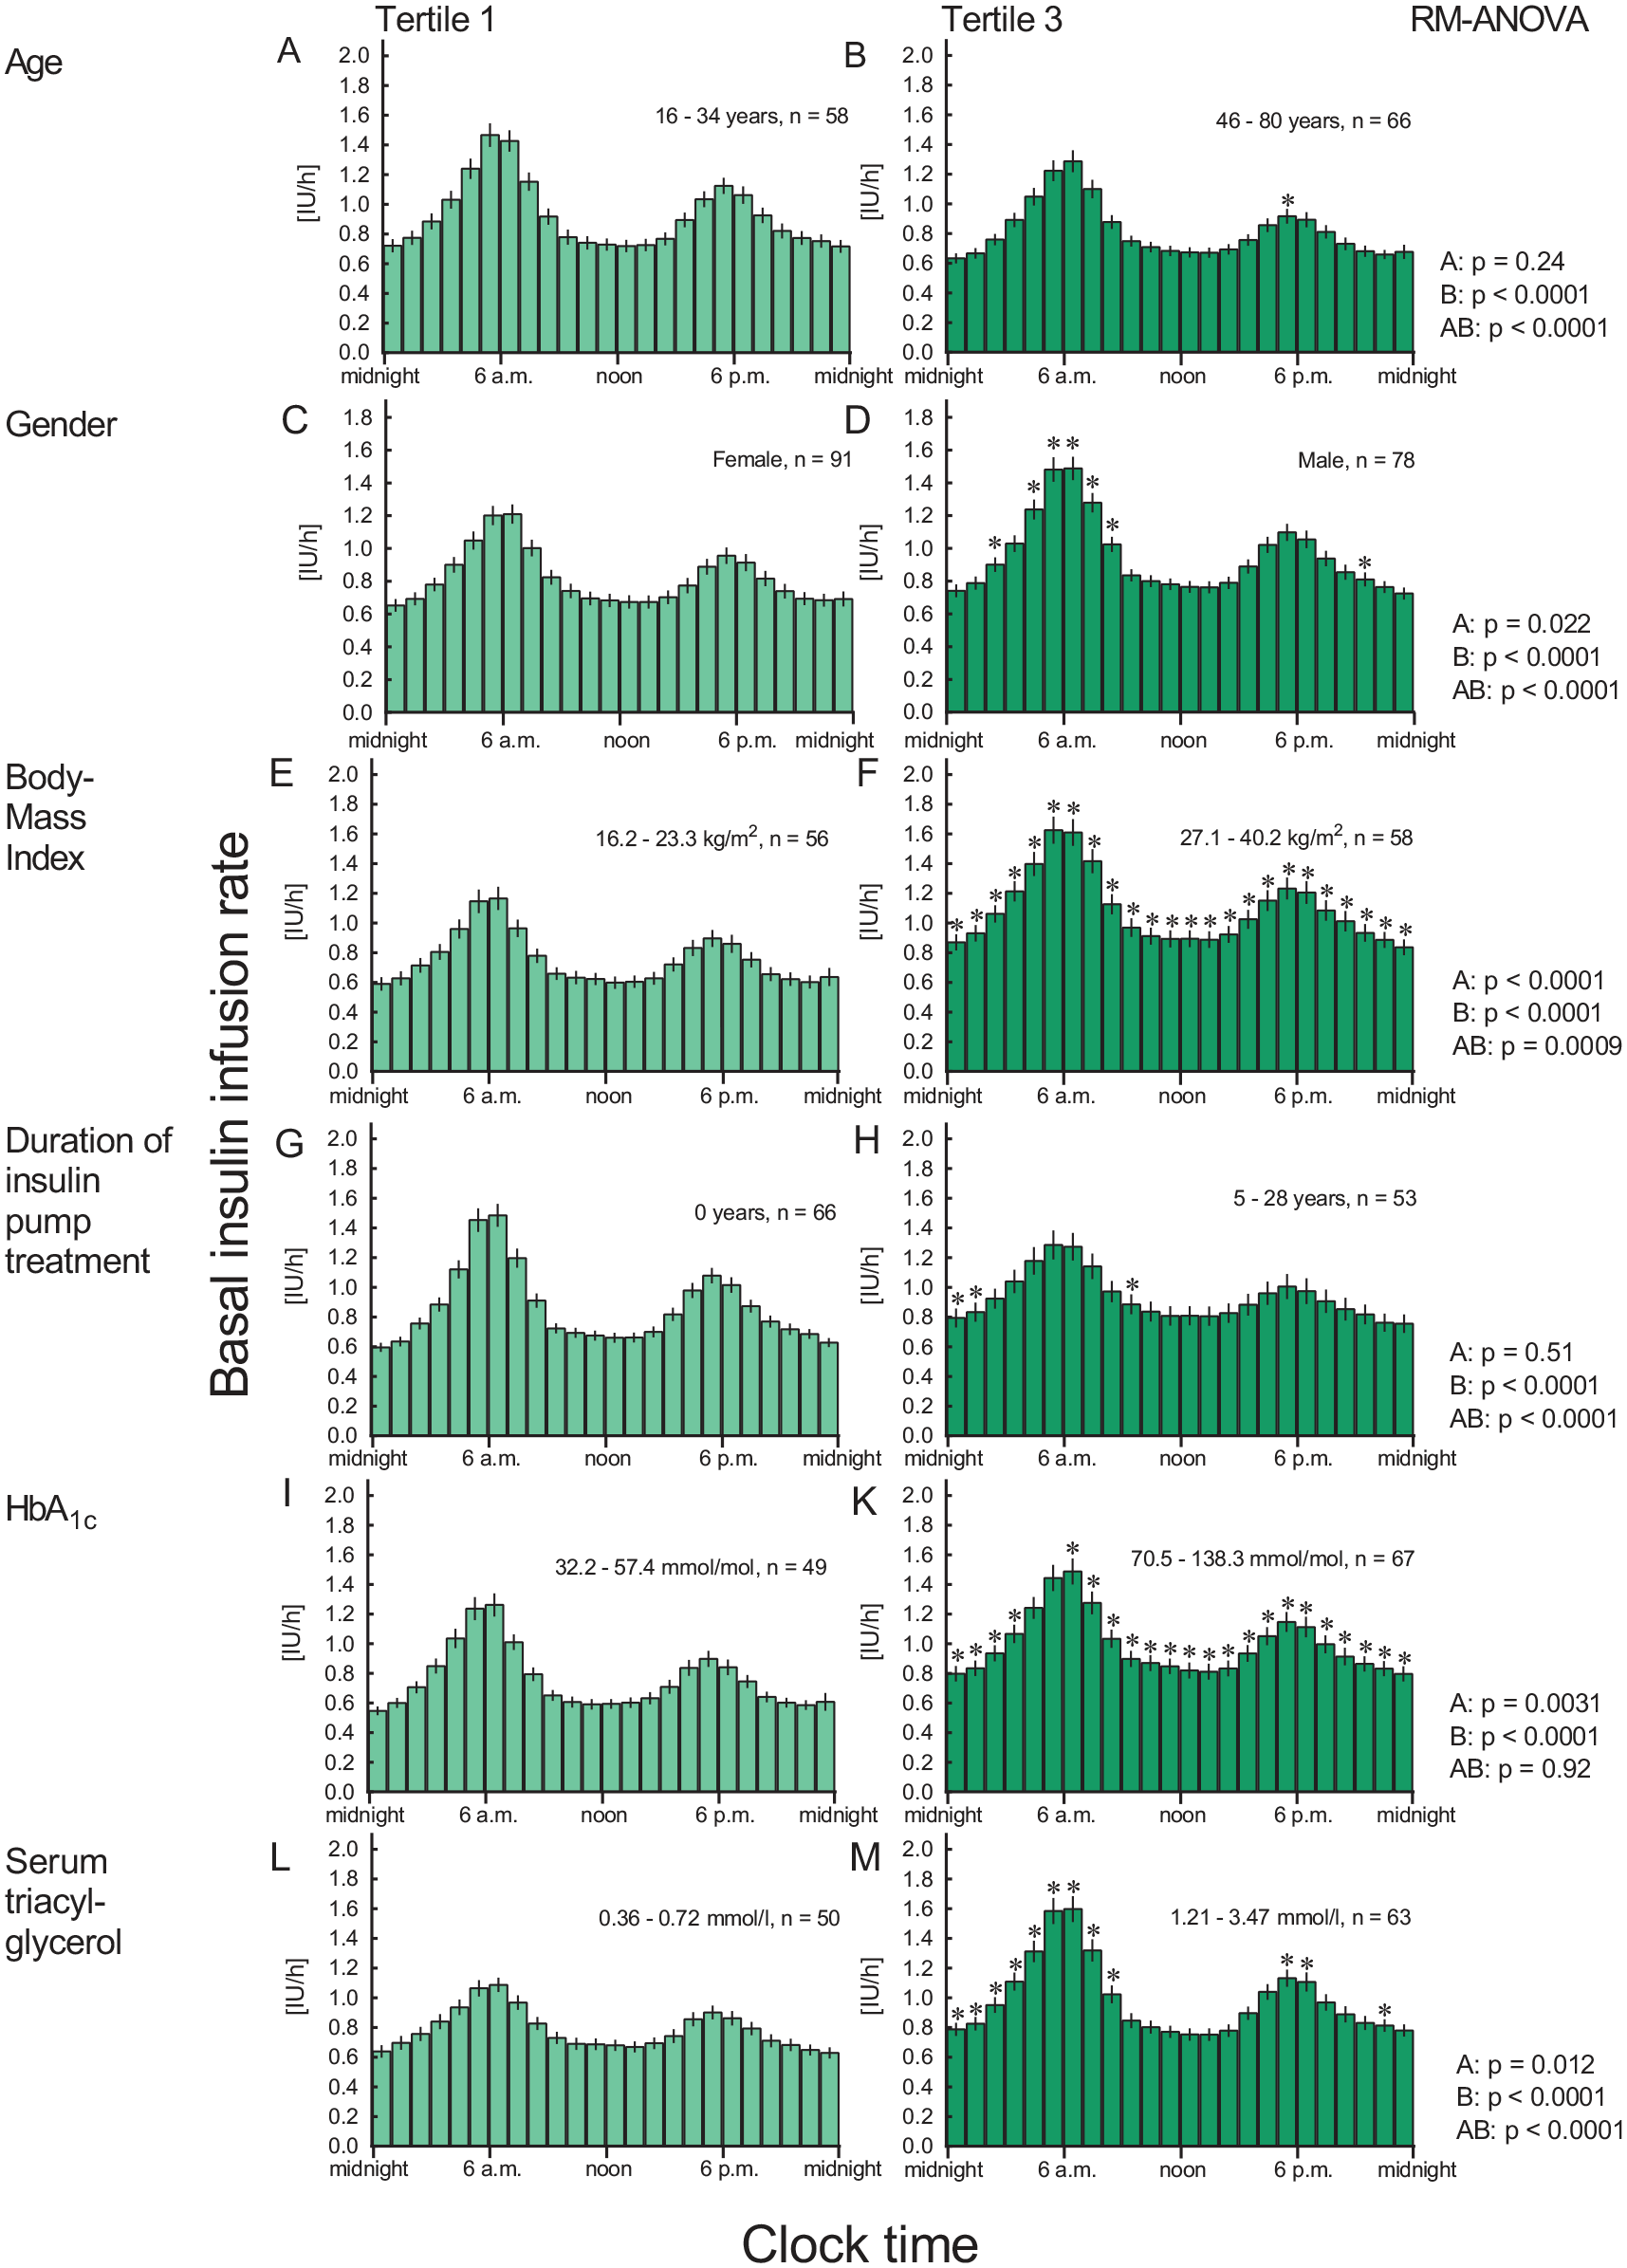
Basal rates expressed per hour over 24 hours from the confirmatory cohorts, by tertiles of age (a, b), gender (c, d), body mass index (e, f), duration of insulin pump treatment (g, h), glycated hemoglobin (HbA1c; i, k), and serum triacyl glycerol concentrations (l, m) are depicted. Only tertile 1 (lowest values of the variable in question) and tertile 3 (highest values of the variable in question) are shown. Mean ± SEM. Statistics: P values were calculated by repeated-measures ANOVA (RM-ANOVA: A: by tertiles; B: by time; AB: by interaction of tertiles and time). Asterisks indicate a significant difference (P < .05, Duncan’s post hoc test) to tertile 1 at individual time points.
Additional Analysis Utilizing Insulin Infusion Dosage per kg Body Weight
A similar analysis has been performed based on BIIRs expressed per kg body weight. This analysis is presented as a separate Supplement No. 2 (supplemental Tables [S2] 4-6; supplemental [S2] Figures 2 and 3). It indicates that gender and body mass index are no longer significant predictors of BIIRs after taking in the influence of body weight on basal insulin dosage into account.
Discussion
In clinical practice, successful insulin pump therapy is often hampered by the lack of reliable tools to determine the individual basal insulin demand in each patient. In the present study, a mathematical algorithm based on set of six readily available clinical characteristics (patient age and gender, body mass index, duration of insulin pump treatment, glycated hemoglobin, and serum TAG concentrations) was established. Based on this equation, individual BIIRs in pump-treated patients with type 1 diabetes were predicted with reasonable accuracy.
The clinical characteristics identified herein to predict individual basal insulin demand appear plausible. Thus, increasing age (first factor identified) most likely changes physical activity levels, body composition and energy intake/expenditure9,10 and the secretion of counter-regulatory hormones. 11 There are also characteristic changes in the secretion of glucagon and adrenaline in response to hypoglycemic episodes with increasing diabetes duration (second factor). 12 Regarding the influence of the duration of insulin pump treatment (third factor), this may in part be due to correlations with age and diabetes duration. Patients with a long duration of insulin pump treatment had flatter profiles (Figure 3). This may in part be explained by the fact that initially, BIIRs often were programmed according to a scheme that has been widely used across Germany in the past.5,6 This recommendation that was based on the analysis of data from a limited number of patients using regular human insulin had suggested a more pronounced diurnal variation than found in our patient cohort. 5 The influence of HbA1c (fourth factor) may be bimodal: if HbA1c is low, one potential reason may be over-insulinization, potentially leading to hypoglycemic episodes. If HbA1c is high, higher insulin doses (including higher BIIR) may be needed. High serum TAG concentrations (fifth factor) are often associated with obesity,13,14 insulin resistance, 14 and hepatic steatosis. 15 The fact that serum TAG concentrations retain their significant impact on BIIR although bodyweight/body mass index have already been accounted for, is in line with the hypothesis that there are different types of obesity with more or less health-related impact. 16 Finally, it is well established that insulin demands are higher in male than in female patients (sixth factor).
While mean plasma glucose concentrations were in an acceptable range throughout the 24-hour period of fasting, in some individual cases there were time points characterized by hypo- or hyperglycemia in a substantial proportion of the patients. We interpret mean plasma glucose concentrations in or near the target range to indicate—broadly speaking—the appropriateness of BIIR profiles at the level of the whole study cohort.
One should be aware that the present manuscript only displays mean values for BIIRs. Therefore, it is important to point to the fact that there is substantial inter-individual heterogeneity regarding basal insulin delivery with flat or variable 24-hour profiles. 4 Our algorithm seems to be able to predict which type of profile is appropriate for a given patient, not only regarding the total basal insulin dosage, but also regarding diurnal variability.
The insulins used in our patients (Supplemental [S1] Table 2) are characterized by different durations of their action. We believe that differences in the duration of insulin action should be taken into account while optimizing BIIRs, and should (otherwise) be reflected in plasma glucose concentrations during fasting and should have been a determinant of programming or adjusting BIIRs.
Regarding a “dawn” phenomenon prompting overnight rises in BIIRs, a study published by Porcellati et al 17 needs to be discussed. Porcellati et al 17 describe a progressive rise in plasma glucose between 2 and 8 AM, and a lack of pre-programmed progressive increase in insulin delivery during this same period in their pump-treated subjects with type 1 diabetes. While the change in insulin requirements during the night may seem to be less prominent than represented by our BIIRs, it remains uncertain how much insulin delivery needs to be increased to compensate for this rise in plasma glucose. This may be related to a prominent inter-individual heterogeneity regarding the quantitative expression of a “dawn” phenomenon, as demonstrated in a previous publication analyzing data from the present cohort of insulin-pump-treated subjects with type 1 diabetes. 4
The present study has limitations. It is based on a database analyzed in a retrospective manner, with some incomplete datasets. We cannot rule out that analyzing a larger patient number would reveal additional factors predicting BIIRs. Our patient selection does not allow to extrapolate toward BIIRs for children and adolescents with type 1 diabetes. Such information, however, is available from various sources, indicating rather rapid and characteristic changes in BIIRs with changing ages through childhood and adolescence.18,19
The model-based prediction of individual insulin pump profiles established herein may largely facilitate insulin pump therapy. Thus, so far, no general guidance has been available to estimate individual basal insulin demand in patients with type 1 diabetes. Therefore, initiation or adjustment of basal rate profiles has either relied on individual experience or published recommendations based on less well characterized cohorts5,6 or expert opinions. There is also no general consensus as to the need for adjusting BIIRs hour by hour or less frequently throughout the day. The present data suggest that the individual demand for basal insulin replacement is not only subject to extensive inter-individual variations but may also largely vary from hour to hour.3,4 Therefore, precise adjustment of hourly basal rate profiles may be warranted to achieve optimal glycemic control in patients with type 1 diabetes on insulin pump therapy, and 24-hour fasting periods (“BRTs”) as performed in the present cohort may be helpful in this respect.
It may be argued that an individually appropriate BIIR may be less important when insulin pumps are used in conjunction with continuous glucose monitoring devices, for example, with a pump suspension function (in the case of low and/or declining plasma glucose concentrations)20,21 or with closed-loop algorithms adapting BIIR to current metabolic needs.22-24 Nevertheless, our prediction is that an individually appropriate programming of BIIR would most likely even improve the chances for appropriate basal insulin replacement under these circumstances.
We are currently using the algorithm described in the present manuscript to test its usefulness in an independent cohort of subjects with type 1 diabetes treated with insulin pumps.
In conclusion, the present study has established an algorithm based on readily available clinical characteristics that has proved to reliably predict individual basal rate profiles. This algorithm may largely facilitate the initiation or adjustment of insulin pump therapy in patients with type 1 diabetes.
Supplemental Material
sj-pdf-1-dst-10.1177_1932296820972691 – Supplemental material for Prediction of Individual Basal Rate Profiles From Patient Characteristics in Type 1 Diabetes on Insulin Pump Therapy
Supplemental material, sj-pdf-1-dst-10.1177_1932296820972691 for Prediction of Individual Basal Rate Profiles From Patient Characteristics in Type 1 Diabetes on Insulin Pump Therapy by Michael A. Nauck, Melanie Kahle-Stephan, Anna M. Lindmeyer, Sina Wenzel and Juris J. Meier in Journal of Diabetes Science and Technology
Supplemental Material
sj-pdf-2-dst-10.1177_1932296820972691 – Supplemental material for Prediction of Individual Basal Rate Profiles From Patient Characteristics in Type 1 Diabetes on Insulin Pump Therapy
Supplemental material, sj-pdf-2-dst-10.1177_1932296820972691 for Prediction of Individual Basal Rate Profiles From Patient Characteristics in Type 1 Diabetes on Insulin Pump Therapy by Michael A. Nauck, Melanie Kahle-Stephan, Anna M. Lindmeyer, Sina Wenzel and Juris J. Meier in Journal of Diabetes Science and Technology
Footnotes
Acknowledgements
We acknowledge the contribution of Sandra Tepelmann, Heike Schulze, Annette Varnhorn, and Martin Janert (all Diabeteszentrum Bad Lauterberg, Bad Lauterberg im Harz, Germany) to documenting all insulin pump treatments at this institution, and for helping retrieve patient data from hospital charts.
Author Contributions
MAN and MK-S designed the study, SW retrieved and analyzed clinical data from hospital charts, MAN, MK-S, AML, SW, and JJM analyzed data, performed the statistical analysis, and wrote the manuscript. All authors have seen an approved the final draft of this manuscript and have decided to submit it for publication. MAN is the guarantor who takes full responsibility for the work as a whole, including study design, access to data, and the decision to submit and publish the manuscript.
Declaration of Conflicting Interests
The author(s) declared the following potential conflicts of interest with respect to the research, authorship, and/or publication of this article: MAN has been member on advisory boards or has consulted with AstraZeneca, Boehringer Ingelheim, Eli Lilly & Co., Menarini/Berlin Chemie, Merck, Sharp & Dohme, and NovoNordisk. He has received grant support from AstraZeneca, Eli Lilly & Co., Menarini/Berlin-Chemie, Merck, Sharp & Dohme, and NovoNordisk. He has also served on the speakers’ bureau of AstraZeneca, Boehringer Ingelheim, Eli Lilly & Co., Menarini/Berlin Chemie, Merck, Sharp & Dohme, and NovoNordisk. JJM has received consulting and speaker honoraria from AstraZeneca, BristolMyersSquibb, Eli Lilly, Merck, Sharp & Dohme, Novo Nordisk, and Sanofi. He has received research support from Eli Lilly, Boehringer-Ingelheim, Merck, Sharp & Dohme, Novo Nordisk, Novartis, and Sanofi. MK-S, AML, and SW have nothing to declare.
Funding
The author(s) received no financial support for the research, authorship, and/or publication of this article.
Supplemental Material
Supplemental material for this article is available online.
References
Supplementary Material
Please find the following supplemental material available below.
For Open Access articles published under a Creative Commons License, all supplemental material carries the same license as the article it is associated with.
For non-Open Access articles published, all supplemental material carries a non-exclusive license, and permission requests for re-use of supplemental material or any part of supplemental material shall be sent directly to the copyright owner as specified in the copyright notice associated with the article.