
Abstract
Background:
Twenty-four hour fasting periods are being used to scrutinize basal insulin infusion rates for pump-treated patients with type 1 diabetes.
Methods:
Data from 339 consecutive in-patients with adult type 1 diabetes on insulin pump therapy undergoing a 24-hour fast as a basal rate test were retrospectively analyzed. Hourly programmed basal insulin infusion rates and plasma glucose concentrations within, below, or above arbitrarily defined target ranges were assessed for periods of the day of special interest (eg, 01:00-07:00
Results:
Basal rates (mean: 0.90 ± 0.02 IU/h) showed circadian variations with peaks corresponding to “dawn” (1.07 ± 0.02 IU/h from 01:00 to 07:00
Interpretation:
Twenty-four hour fasting periods as basal rate tests frequently unravel periods with inappropriate basal insulin infusion rates potentially responsible for fasting hyper- or hypoglycemia. Notably, the higher basal insulin infusion rate found during the “dawn” period seems to be justified and may need to be accentuated.
Keywords
Introduction
The severe insulin deficiency in patients with type 1 diabetes necessitates full insulin replacement therapy. Intensified insulin therapy has been established as the standard treatment. This regimen typically involves division of the overall insulin requirement into a basal insulin component, covering the insulin demand under fasting conditions, and a prandial/bolus insulin component, aiming to cover postprandial glucose excursions or to lower plasma glucose in the case of hyperglycemia (correction algorithms). 1
One major advantage of insulin pump therapy is the opportunity to precisely program basal insulin infusion requirements at hourly (or even shorter) intervals to address diurnal variations in the individual insulin needs.2,3
Basal insulin infusion rates usually are programmed according to published recommendations initially.4,5 Later, they should be optimized empirically, eg, in response to overnight plasma glucose concentrations (the longest fasting period during a normal day),6-8 according to glucose concentrations determined after omission of individual meals (short fasting periods), 8 or depending on the glucose profiles obtained during a full 24-hour fasting period (basal rate tests).9,10 Such basal rate tests appear necessary, because on a day with regular meal rhythm, rapid-acting insulin may compensate for deficits in basal insulin and vice versa.
Despite the fact that many patients nowadays are using sensor-augmented pumps,11-13 which can address low plasma glucose concentrations by temporarily stopping basal insulin infusion, the question is whether this obviates the need for an individually optimized basal insulin infusion rate, which may be too low at times as well. Most likely, a custom-tailored basal insulin infusion rate plus technical solutions to account for variations in physical activity will provide the best results.
In specialized German diabetes centers with inpatient service, it has become customary to perform 24-hour fasting periods in pump-treated patients with type 1 diabetes, if there appears to be a chance to optimize the diurnal profile of insulin administration, and if there is a suspicion that basal insulin infusion rates are principally or temporarily too high or too low and thus contribute to a risk for fasting hypo- or hyperglycemia. To gain more insight into the relationship between hourly basal insulin infusion profiles used in insulin pumps and the resulting 24-hour fasting plasma glucose profiles, we analyzed data from a large cohort of patients attending the Diabetes Center Bad Lauterberg between 2008 and 2014, with a special emphasis on diurnal changes in insulin administration and plasma glucose concentrations. Our hypothesis was that valuable insights can be gained from analyzing the relationship of hourly basal insulin infusion rates and the resulting plasma glucose profiles during a 24-hour fast in patients with type 1 diabetes on insulin pump treatment.
Patients and Methods
Study Design
This retrospective analysis was conducted based on patients who had been inpatients at the diabetes center Bad Lauterberg, aiming at an optimization of their glycemic control using insulin pumps. Pump-treated patients with type 1 diabetes were retrieved from a dedicated database (collected between 2008 and 2014). These patients’ data were extracted from their hospital charts, using a case report form specifying the parameters of interest. All patients had given permission for the analysis of their clinical data for scientific purposes, and the present study was performed fully complying with pertinent ethical and data protection regulations. Each patient was studied applying his/her basal insulin infusion rate as it had developed empirically. When starting insulin pump therapy, recommendations for basal insulin infusion rates issued by Renner and coworkers4,14 were, as a rule, used as guidance for programming hourly insulin infusion rates. They correspond to the Roche Basal Rate Calculator widely distributed across Europe. Later, individual basal insulin infusion rates were optimized in clinical practice (guided by plasma glucose measurements) and, in the cohort of patients described in the present analysis, by performing 24-hour fasting basal rate tests. Meal-related insulin needs were optimized empirically, based on carbohydrate counting and individual dosing algorithms developed for each major meal, taking into account diurnal variations in insulin sensitivity. 15
Selection of Study Patients
Patients were included in the present retrospective analysis, if they had type 1 diabetes and were treated with continuous subcutaneous insulin infusion (using any approved model of insulin pump: Disetronic H-tron, n = 39 [11.5%]; Disetronic D-tron, n = 19 [5.3%]; Roche Accu Chek, n = 153 [5.1%]; Medtronic Paradigm, n = 97 [28.6%]; Cozmo, n = 19 [5.6%]; and OmniPod, n = 11 [3.2%]) and had an age of 16 to 80 years. Patients were excluded, if their diabetes type was different from type 1 diabetes, if they were pregnant at the time of inpatient treatment, or if no basal rate test (fasting period 24 hours) had been performed. Patients with an age of less than 16 years were excluded, because insulin requirements in children and adolescents are usually different.2,3 If a patient had been admitted to the hospital for the performance of a 24-hour fast (basal rate test) more than once, only the most recent dataset was used to most likely represent the individual optimum. A flow chart describing the patients retrieved from the original database and the reasons for excluding data from the present analysis are shown as supplemental Figure S1.
Data Extraction
Patient characteristics (summarized in Table 1), details of the treatment (supplemental Table S1), and laboratory values were extracted from medical records. Hourly basal insulin infusion rates (insulin pump) used and plasma glucose profiles measured during a 24-hour fasting period were recorded. A representative plasma glucose profile after treatment optimization (ie, determined immediately before hospital discharge) was also obtained.
Subject Characteristics of Patients With Type 1 Diabetes Treated With Continuous Subcutaneous Insulin Infusion (Insulin Pumps) Who Performed a 24-hour Fasting Test During Inpatient Service for Optimization of Plasma Glucose Control.
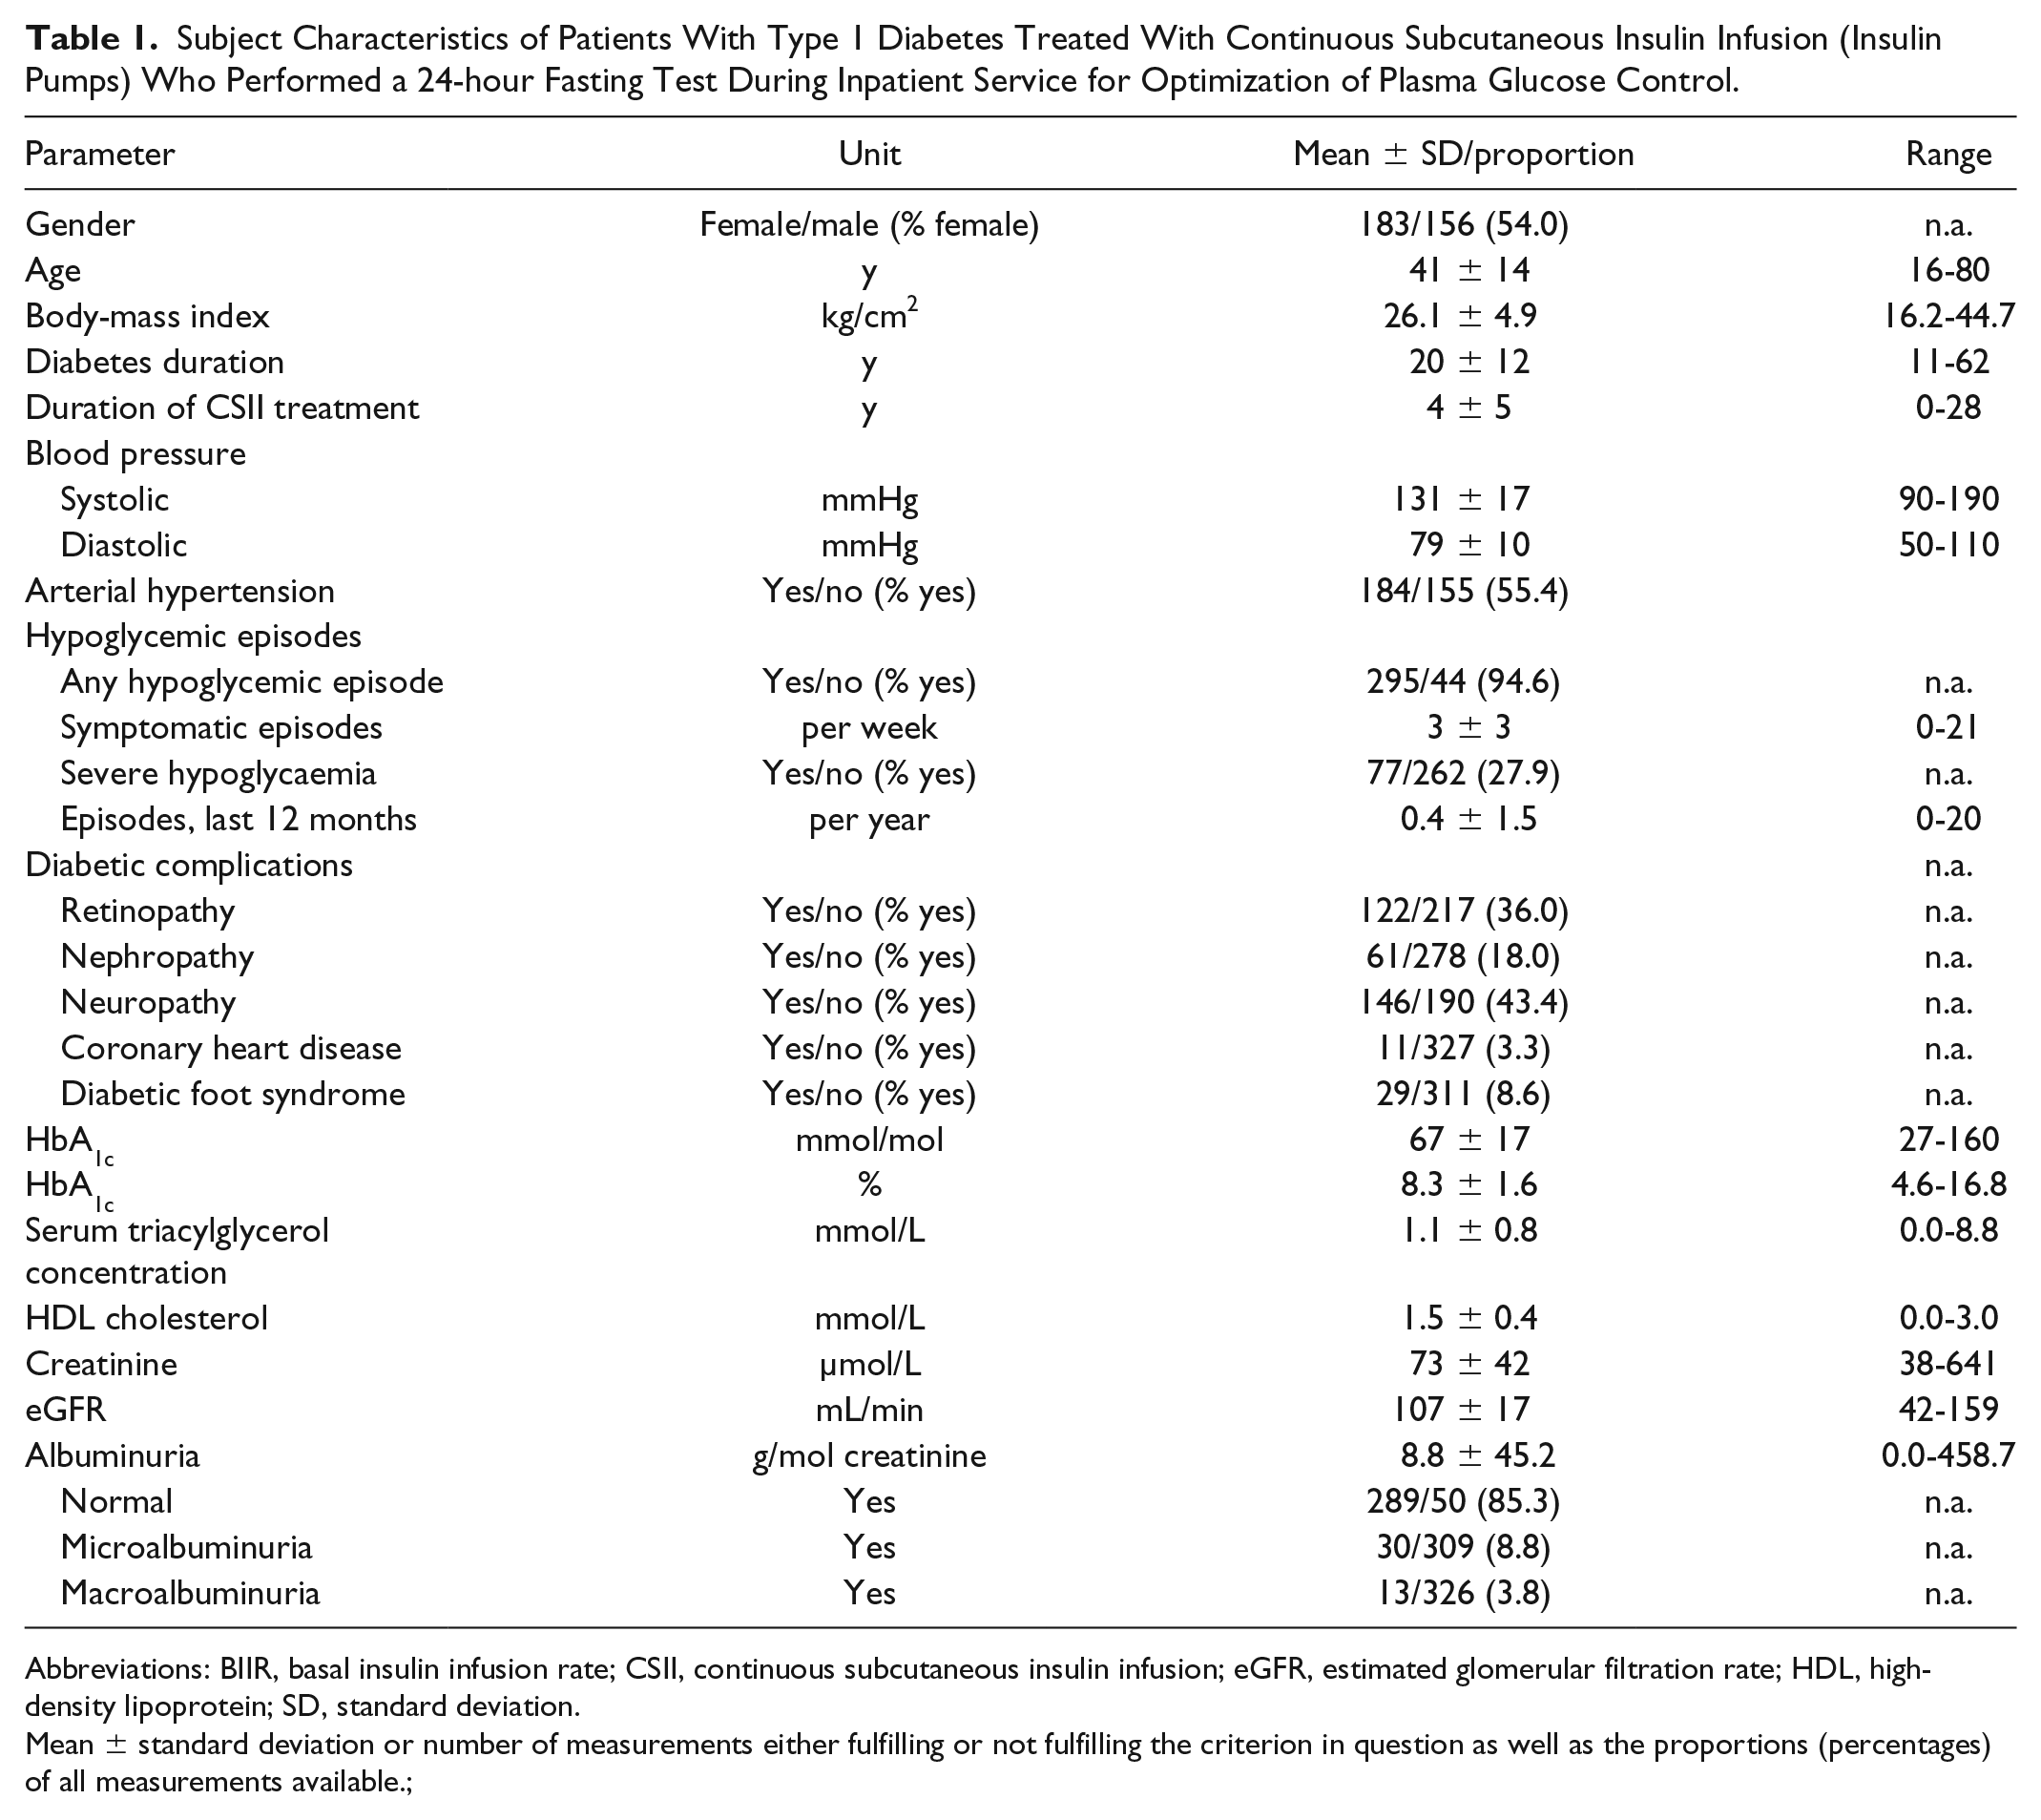
Abbreviations: BIIR, basal insulin infusion rate; CSII, continuous subcutaneous insulin infusion; eGFR, estimated glomerular filtration rate; HDL, high-density lipoprotein; SD, standard deviation.
Mean ± standard deviation or number of measurements either fulfilling or not fulfilling the criterion in question as well as the proportions (percentages) of all measurements available.;
Optimization of Hourly Basal Insulin Infusion Rates
Basal rate tests were performed in a standardized manner after avoiding strenuous exercise and alcoholic drinks during the prior 24 hours. They were performed over 24 hours, starting at 06:00
Design of the Analysis
The present analysis focuses on the questions: (a) whether empirically derived basal insulin infusion rates lead to (mean) plasma glucose concentrations in the target range for the fasting situation, (b) how plasma glucose concentration during 24-hour fasting tests differs from those obtained during daily profiles when the same patients eat meals (with an emphasis on fasting plasma glucose in the morning and premeal plasma glucose concentrations), and (c) whether typical peaks in the diurnal basal insulin infusion rate profiles representing the early morning (“dawn” phenomenon) or late afternoon (“dusk” phenomenon) rise in insulin resistance are appropriately addressed by transient increments in insulin delivery rates during these periods.
Achievement of Fasting Plasma Glucose Targets During 24-hour Fast (Basal Rate Tests)
Two definitions for the target range of plasma glucose during fasting have been analyzed: First, our more stringent definition of this target range was 4.4 to 7.2 mmol/L (80-130 mg/dL) according to the definition of the fasting target range recently published by the American Diabetes Association. 16 This, in our clinical practice, is the range that is aimed for without suggesting or inducing changes in the insulin infusion rates when reached. Second, as a more relaxed definition, we used 3.9-9.0 mmol/L (70-162 mg/dL), because <3.9 mmol/L (<70 mg/dL) is equivalent to hypoglycemia, 16 and since for a target HbA1c of 7.5% (58 mmol/mol), this is the upper limit of the fasting plasma glucose range that would be equivalent. 16 This latter range appears generally acceptable, however, would lead to attempts of optimizing basal insulin infusion rates, if single or more values lie outside the narrow target range as defined above.
The achievement of plasma glucose in the fasting target range was tested for each measurement taken at any time during the 24-hour fasting period (to fully represent the distribution of individual values) and at the patient level, ie, by calculating mean values for each individual subject in our cohort.
Potential Differences in Plasma Glucose Profiles Obtained During 24-hour Fasting and During Days With a Normal Meal Rhythm
To identify differences in plasma glucose concentrations between profiles obtained during 24-hour fasting periods and days with a normal meal rhythm, mean values for all time points were compared as well as average (mean) glucose concentrations during profiles taken under both conditions. Since fasting plasma glucose in the morning (before breakfast) and premeal plasma glucose concentrations measured before lunch and dinner, respectively, are determined under conditions that resemble those during fasting more than those measured at postmeal time points, a mean of fasting/preprandial (06:45
The distribution of individual and mean plasma glucose concentrations was analyzed by generating histograms, with categories including glucose concentration ranges 1.0 mmol/L wide, spanning from 0-1.0 to 19.0-20.0 and >20.0 mmol/L, which was also compared between 24-hour fasting periods and fasting/preprandial time points during profiles with regular meal rhythm.
Appropriateness of Diurnal Variations in Hourly Insulin Infusion Rates With Emphasis on the “Dawn” and “Dusk” Phenomenon
Based on the diurnal profiles of basal insulin infusion rates (Figure 1), there were two periods (09:00
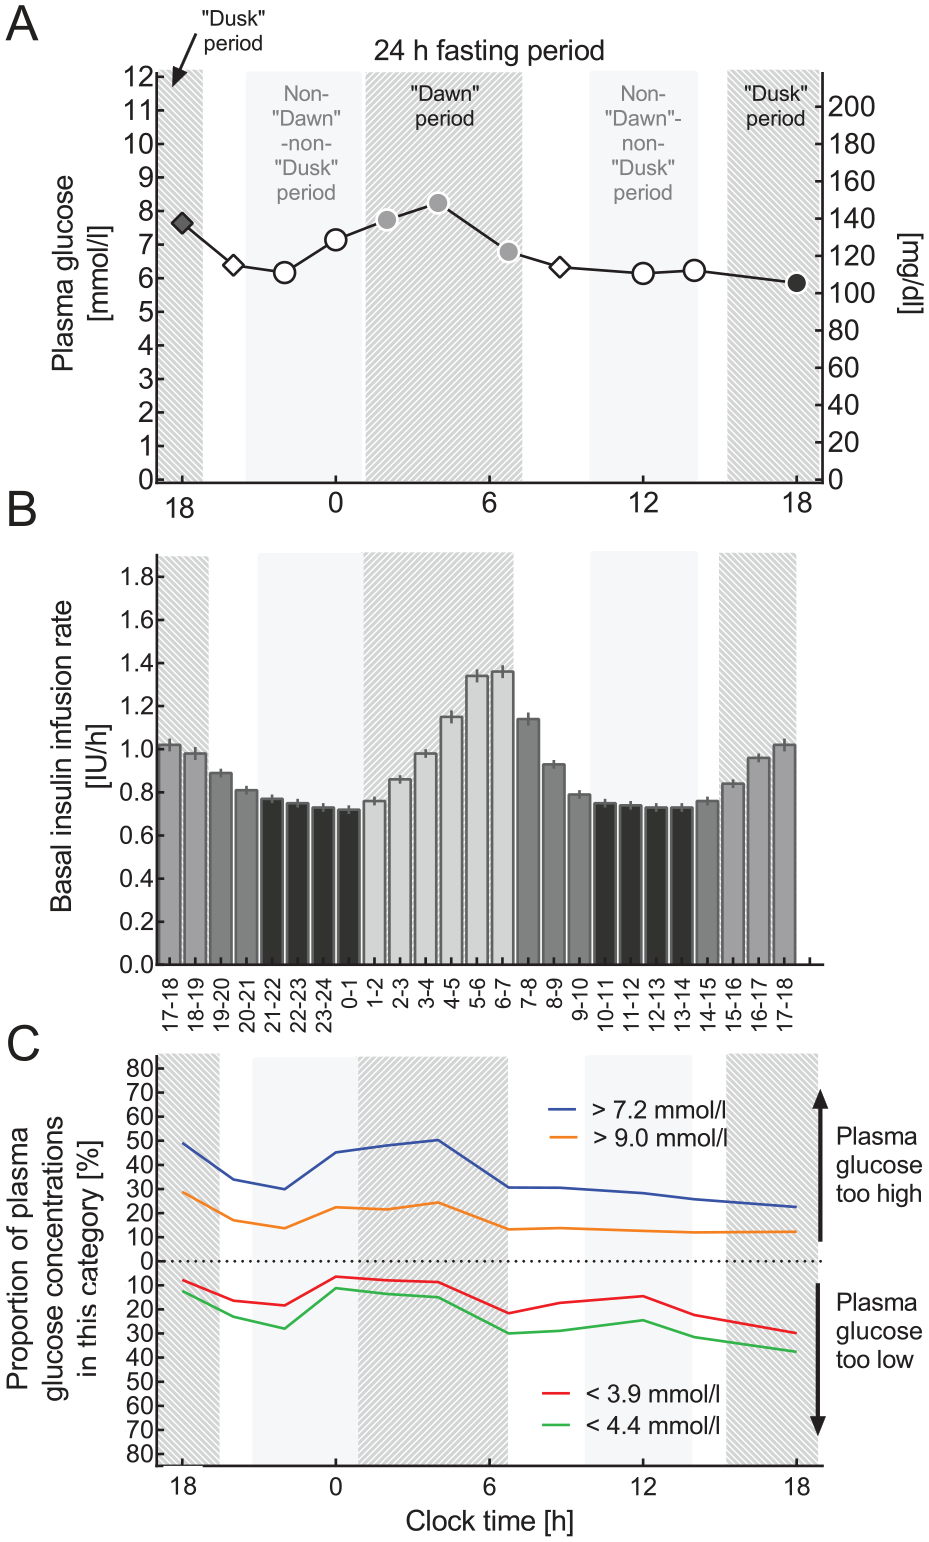
Basal insulin infusion rate profiles and results of 24-hour fasting periods performed as a basal rate test. (A) Plasma glucose profiles during 24-hour fasting periods, (B) the current hour by hour basal insulin infusion profile (IU/h), and (C) proportions of patients with plasma glucose concentrations below thresholds indicating “below the target range” or hypoglycemia (<4.4 or <3.9 mmol/L, respectively) or above thresholds indicating “above the target range” or hyperglycemia (>7.2 or >9.0 mmol/L. (A, B) Means ± standard error of the mean and (C) % of all plasma glucose values available for this time point. Light gray bars highlight the periods of the day as defined for the purpose of the present analysis. The “dawn” period from 01:00 to 07:00
For each of these diurnal time periods, mean plasma glucose concentrations were calculated as well as the proportion of plasma glucose concentrations measured below the thresholds for low plasma glucose concentrations (“stringent” definition: <4.4 mmol/L; more “relaxed” definition: <3.9 mmol/L) and above thresholds for plasma glucose concentrations deemed to be too high (“stringent” definition: >7.2 mmol/L; “relaxed” definition: >9.0 mmol/L). The latter was performed as a sensitivity analysis. These proportions were also calculated for all time points when plasma glucose was measured.
The proportion of patients with plasma glucose concentrations in a stringently defined (4.4-7.2 mmol/L) and a relaxed (3.9-9.0 mmol/L) target range was also calculated.
Proportions of plasma glucose concentrations that were too low or too high according to these definitions were calculated and compared between the “dawn” period or “dusk” period and the non-“dawn”-non-“dusk” period. Odds ratios for the probability of glucose concentrations that were too low or too high comparing different periods of interest were determined. The rationale was to determine whether the hourly basal insulin infusion rate, which typically was higher during the “dawn” period than during other periods, leads to a higher probability of corresponding plasma glucose concentrations that were too low. In this case, the temporarily higher hourly basal insulin infusion rate would be judged inappropriate. Similar reasoning would apply to the “dusk” period.
Sample Size Calculation
Since it was not the aim of the study to address a hypothesis regarding differences of any kind, this is an exploratory analysis using a large sample of patients mainly based on their availability. No formal sample size calculation has been performed. Intuitively, the number of patients available for analysis was considered sufficient.
Statistical Analysis
Patients’ characteristics are reported as means ± standard deviation (SD) or counts (n) as well as proportions (%). Results are reported as means ± standard error of the mean (SEM) or means ± 95% confidence intervals (CIs) as described in figure legends. When proportions are reported, the number of patients fulfilling or not fulfilling the criterion in question is reported, thus presenting the total number of observations, allowing the extrapolation of missing data. Significances of differences between two time points or periods were tested by paired t-tests (continuous variables; Statistica Version 12.0, Statsoft Europe, Hamburg, Germany) or contingency table analysis (χ2 test categorical variables, GraphPad Prism version 7.00 for Windows, GraphPad Software, La Jolla California, United States, www.graphpad.com). P-values < .05 were taken to indicate significant differences.
Results
Diurnal Variation in Basal Insulin Infusion Rates
Patients were examined during 24-hour fasting periods using their empirically derived basal insulin infusion rates. Our descriptive analysis of the factual basal insulin infusion rates results in a mean over 24 hours of 0.90 ± 0.02 IU/h (or 21.5 ± 9.2 IU/day or 0.27 ± 0.09 IU/kg body weight per day). Hourly basal insulin infusion rates were lowest during the periods from 09:00
Plasma Glucose Concentrations During a 24-hour Fasting Period
Mean (± SEM) plasma glucose concentrations during the 24-hour fasting period were 6.6 ± 0.1 mmol/L (95% CI: 6.4-6.8 mmol/L) (Figure 1(A)). Analysis of the frequency distribution of individual values across categories of plasma glucose concentrations revealed a wider distribution (Figure 2(A)), with 23.1% of the values below 4.4 mmol/L, 15.9% below 3.9 mmol/L, and 36.0% above 7.2 mmol/L as well as 17.5% above 9.0 mmol/L. The frequency distribution of mean plasma glucose concentrations for the individual patients was narrower (Figure 2(D); P < .0001 vs individual plasma glucose concentrations determined at any time point). Mean plasma glucose concentrations mainly fell into the target ranges (Figure 2(D)), with 4.4% of the values below 4.4 mmol/L, 1.2% below 3.9 mmol/L, and 29.8% above 7.2 mmol/L as well as 8.0% above 9.0 mmol/L.
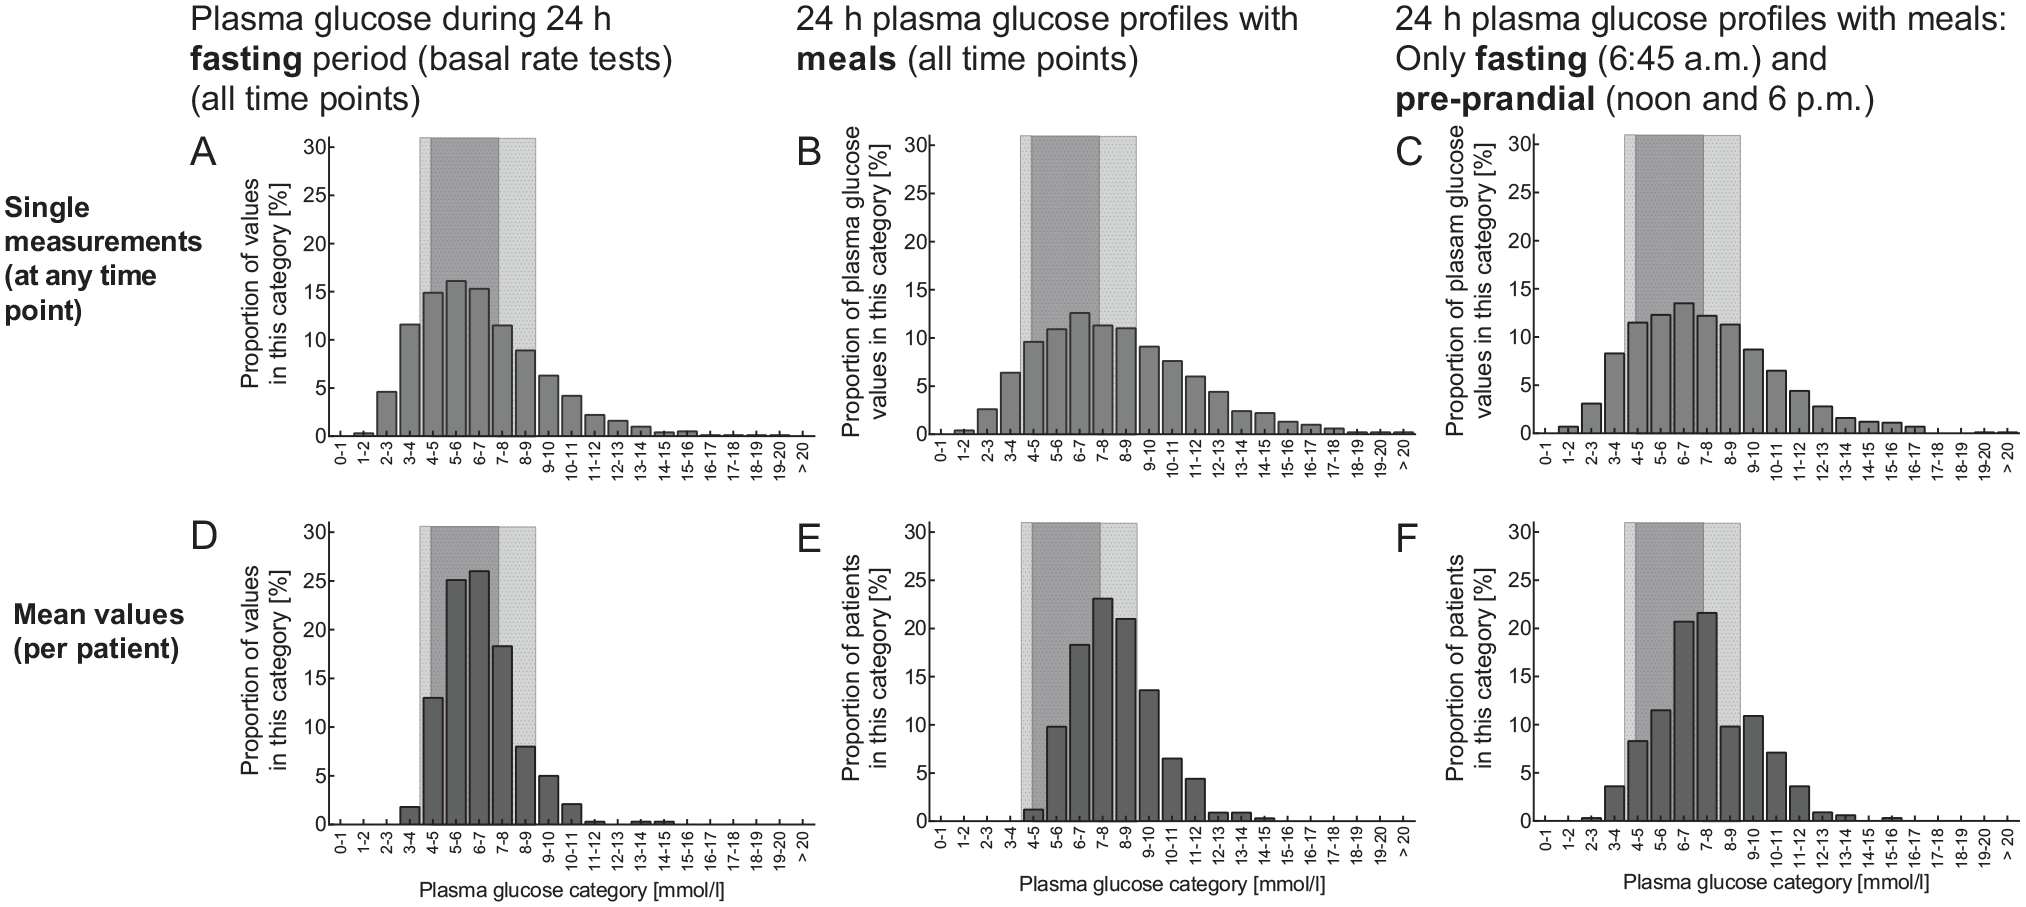
Histograms showing the frequency distribution of plasma glucose concentrations across categories ranging from 1.0-2.0 to 19.0-20.0 and >20 mmol/L (each category 1.0 mmol/L wide) during 24-hour fasting periods (A, D), during 24-hour plasma glucose profiles with regular meal rhythm (B, E), and mean fasting (06:45
Proportion of Plasma Glucose Concentrations During a 24-hour Fast Within Predefined Target Ranges
Of all plasma glucose concentrations measured during 24-hour fasting periods, depending on the time point, 34.8% to 47.2% (overall: 40.9%) fell into the strictly defined target range (4.4-7.2 mmol/L), while 57.9% to 73.0% (overall: 67.1%) fell into the target range defined by more relaxed criteria (3.9-9.0 mmol/L; Figure 3). If calculated for mean plasma glucose concentrations for each individual patient, these proportions were significantly higher (P < .0001) (Figure 3(C)).
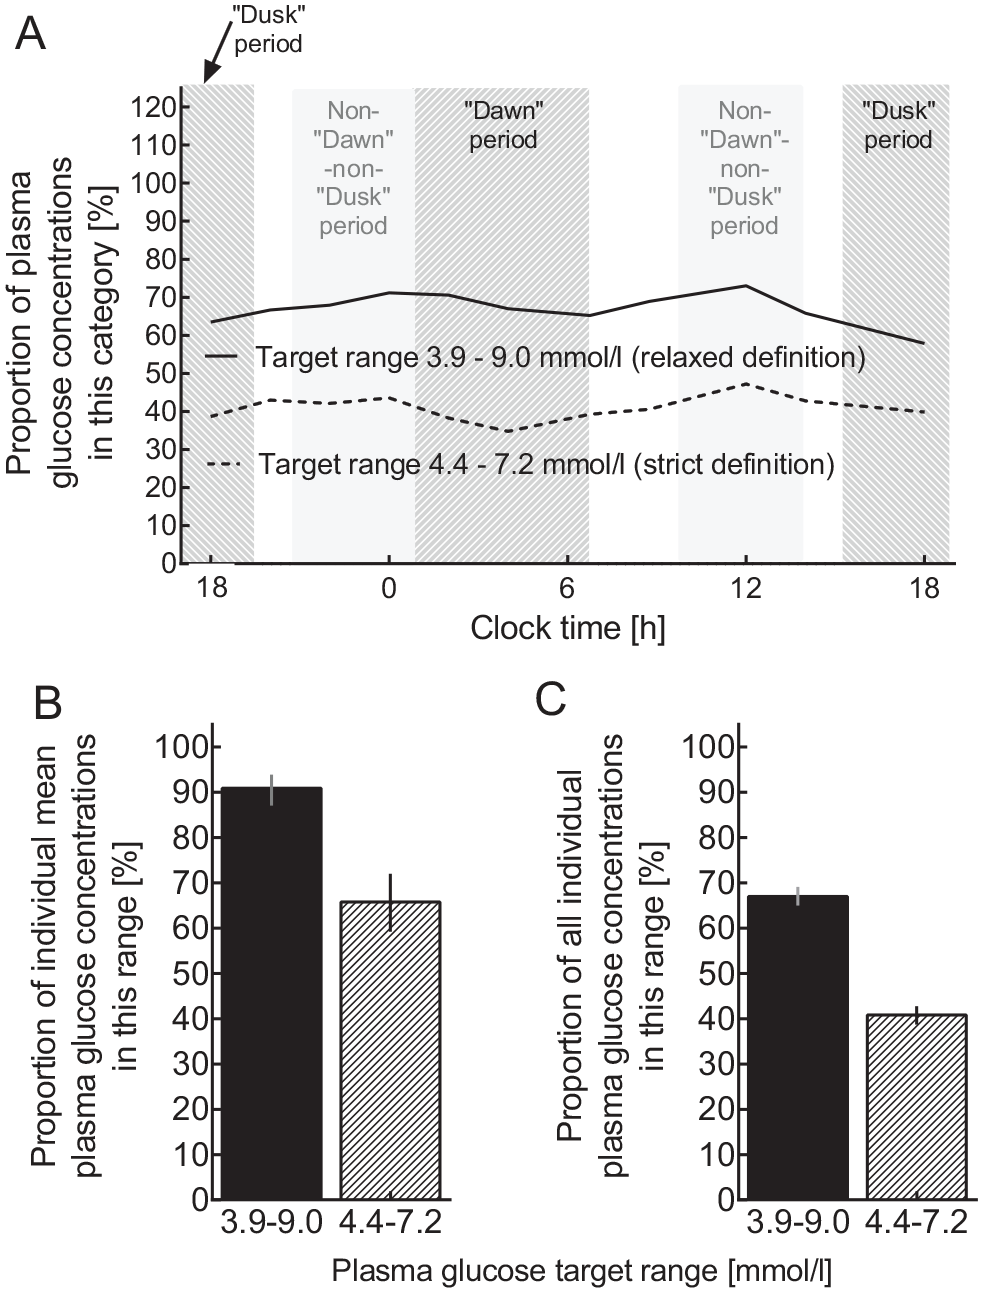
Proportions of plasma glucose measurements within predefined target ranges (“strict”: 4.4-7.2 mmol/L; “relaxed”: 3.9-9.0 mmol/L) for all patients by time point (A), for mean plasma glucose concentrations across all time points in individual patients (B), and for individual plasma glucose concentrations at all time points during 24-hour fasting periods (C). The predefined periods of the day are indicated by light gray bars (for details see Figure 1).
Comparison of Plasma Glucose Concentrations During a 24-hour Fasting Period With Profiles Taken During a Day With Regular Meal Rhythm
Mean (± SEM) plasma glucose concentration during the 24-hour period with a regular meal rhythm was 8.1 ± 0.1 mmol/L (95% CI: 7.9-8.3 mmol/L), which was significantly (P < .0001) higher (by 1.5 ± 0.1 mmol/L [95% CI: 1.2-1.7 mmol/L]) than that during 24-hour fasting (Figures 2 and 4).
Figure 4 shows that plasma glucose concentrations were higher during 24-hour plasma glucose profiles taken on a day with regular meals than during 24-hour fasting at all time points except 06:00
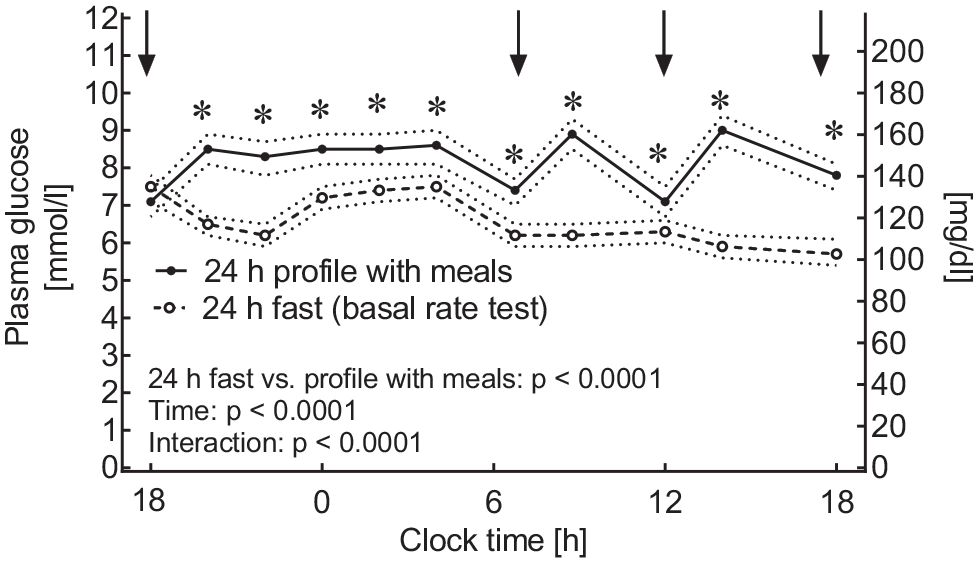
Plasma glucose profiles taken during a 24-hour fasting period (open symbols, broken line) and during a 24-hour plasma glucose profile taken during a day with regular meal rhythm (filled symbols, uninterrupted lines). Means ± 95% confidence intervals. Statistics: Repeated-measures analysis of variance reporting P-values for differences between the two experiments (fasting vs meals), for changes over time, and for their interaction. Asterisks indicate a significant difference (P < .05) between the conditions at individual time points as determined by post hoc testing.
Analysis of the frequency distribution of individual values across categories of plasma glucose concentrations during a day with meals (Figure 2(B)) revealed a wider distribution than during fasting (P < .0001; Figure 2(A)), particularly regarding hyperglycemic categories. The same applies to fasting and preprandial plasma glucose concentrations measured during a day with regular meals compared to 24-hour fasting periods (Figure 2; P < .0001). The shift to the right in frequency distributions was obvious also when comparing mean plasma glucose concentrations per individual patients between 24-hour plasma glucose profiles on a regular meal rhythm (Figure 2(B)) or selected fasting and preprandial time points (Figure 2(C)) with 24-hour fasting periods (Figure 2(A); all comparisons P < .0001),
Not only were plasma glucose concentrations during a day with meals generally significantly higher that during 24-hour fasting periods (Figures 2 and 3), but also there was no significant correlation of plasma glucose concentrations at preprandial sampling times (noon and 06:00
Magnitude of the Transient Rise in Basal Insulin Infusion Rates During the “Dawn” and “Dusk” Periods
Hourly basal insulin infusion rates increased between 01:00 and 07:00
Appropriateness of Increased Basal Insulin Infusion Rates During the “Dawn” Period
Figure 1(c) demonstrates that during the period characterized by progressively rising hourly basal insulin infusion rates (01:00-07:00
Comparison of Plasma Glucose Concentrations and Proportions of Plasma Glucose Concentrations That Were too Low or too High During Periods of a 24-hour Fasting Period (Basal Rate Test) That Were Characterized by the Dawn or Dusk Phenomenon vs Those Measure Outside These Periods.
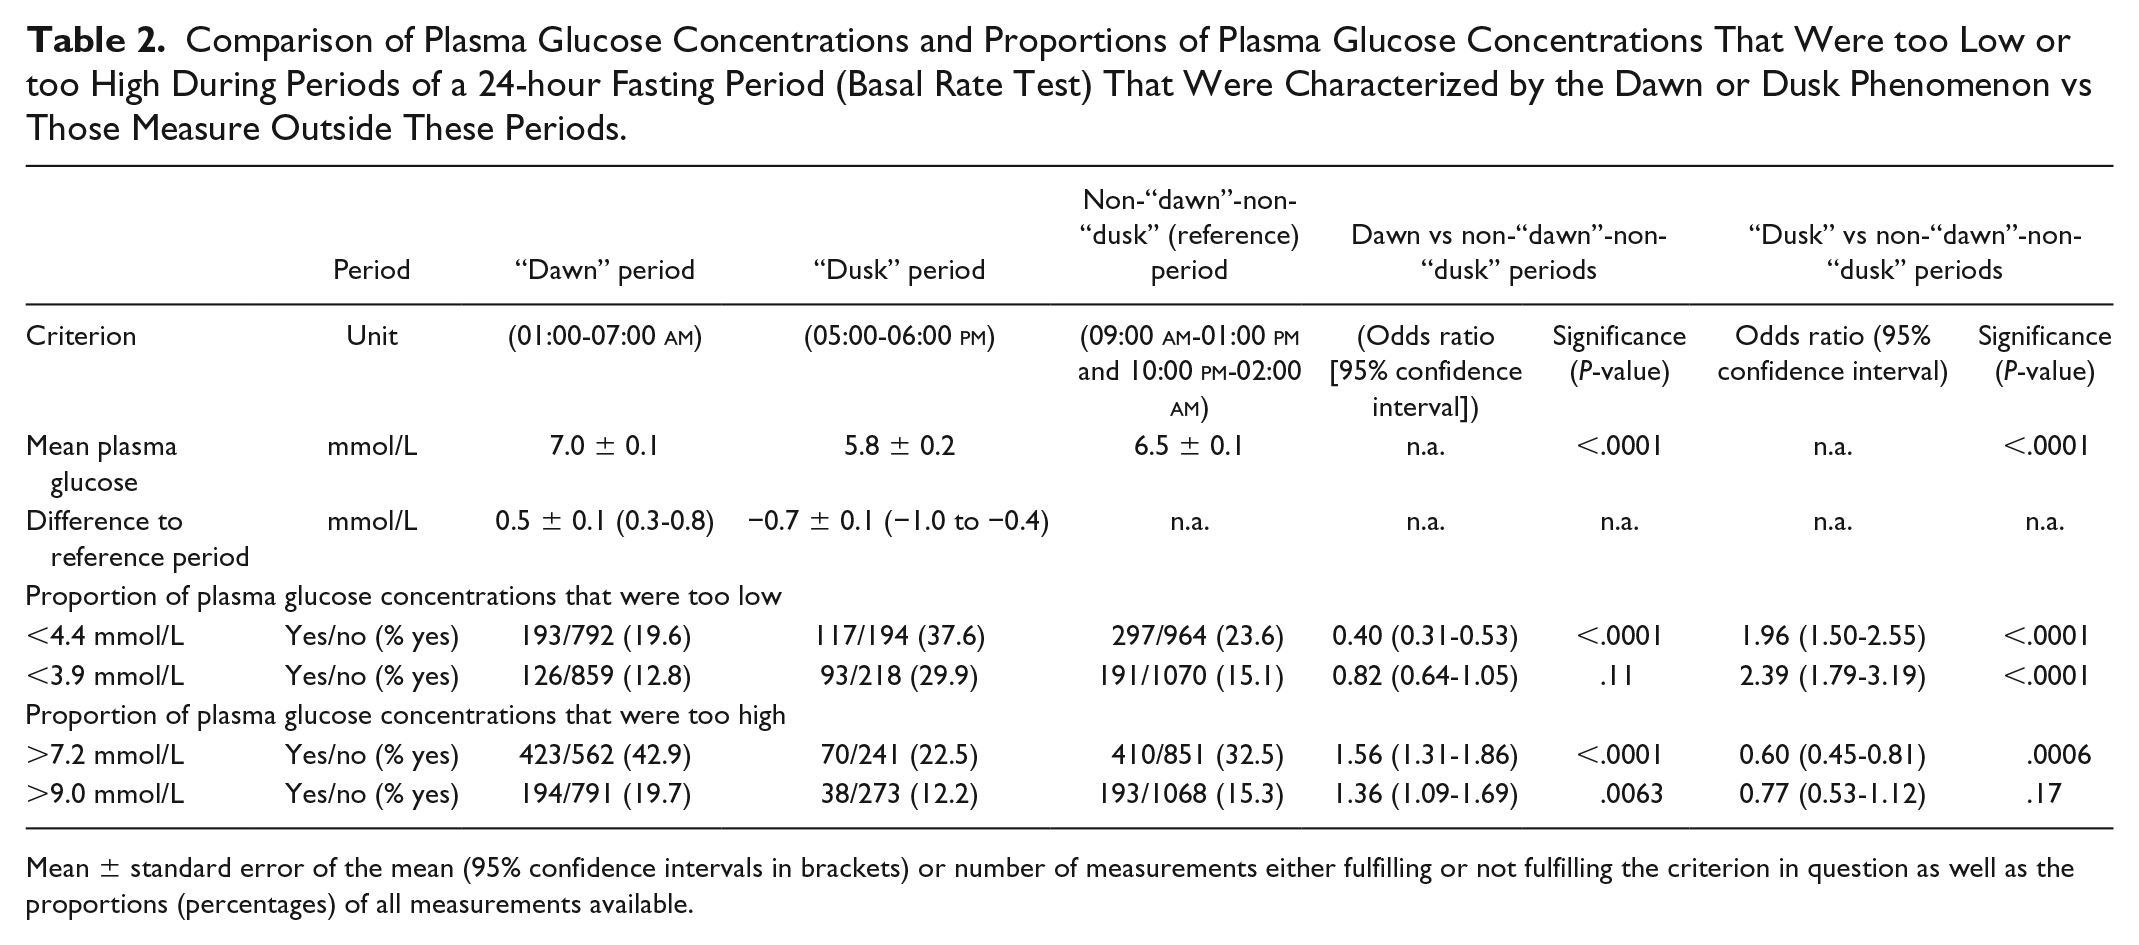
Mean ± standard error of the mean (95% confidence intervals in brackets) or number of measurements either fulfilling or not fulfilling the criterion in question as well as the proportions (percentages) of all measurements available.
Appropriateness of Increased Basal Insulin Infusion Rates During the “Dusk” Period
Plasma glucose concentration during 24-hour fasting was lower at the time of the “dusk” phenomenon (5.8 ± 0.2 mmol/L) compared to the reference period (by −0.7 ± 0.1 mmol/L [95% CI: −1.0 to −0.4 mmol/L]). Along the same line, the proportions of plasma glucose concentrations that were too low were higher during the “dusk” period (P < .0001 for both threshold values), whereas the proportion of plasma glucose concentrations that were too high was lower (significant, P = .0006 in the case of the 7.2 mmol/L threshold; Table 2), with a similar trend for a threshold of 9.0 mmol/L.
Discussion
The present study allows some important insights from performing and analyzing 24-hour fasting periods in insulin pump-treated patients with type 1 diabetes: (A) The majority of plasma glucose concentrations measured was within or near the target ranges applicable to the fasting state (Figures 1 and 2). (B) Individual mean plasma glucose concentrations calculated throughout these 24-hour fasting periods were even more likely to fall within the target range (Figure 2). (C) There were prominent diurnal variations in hourly basal insulin infusion rates, with progressively increasing basal insulin administration between 01:00 and 07:00
We believe that this suggests to optimize hourly basal insulin infusion rates with the help of information gathered during 24-hour fasting tests in order to fully exploit the technical opportunities offered by such insulin infusion devices, which can deliver a separately defined basal insulin infusion rate at least for each 60 minutes segment of the day.2,5,8,21 Therefore, we suggest that using the information provided by plasma glucose profiles measured during 24-hour fasting periods for the optimization of glycemic control in pump-treated patients with type 1 diabetes should be prospectively evaluated against any reasonable other guidance for this process. This may be of particular importance in patients using ultra-fast-acting insulin with meals, because between meals they should rely on their basal insulin more extensively than with slower-acting meal-related insulins.
Prolonged fasting might lead to a rise in nonesterified fatty acids promoting progressive insulin resistance. This may lead to a secondary rise in plasma glucose with extended periods of fasting. Therefore, avoiding 24-hour fasting and substituting it with shorter periods (skipping individual meals) has been advocated to test the appropriateness of basal infusion rates. 8 However, plasma glucose concentrations during our 24-hour fasting period did not tend to be reduced over time. We doubt that a period of approximately six hours equivalent to the time elapsing between two meals would suffice to reach a steady state as would be required for judging the appropriateness of basal insulin infusion rates.
One might argue that fasting and preprandial plasma glucose concentrations on a 24-hour profile with a regular meal rhythm might substitute for those determined at the same time of the day during a 24-hour fasting period. This, however, is not supported by our analysis: Premeal plasma glucose was significantly higher during a profile taken during a 24-hour period with regular meal rhythm before breakfast, lunch, and dinner (Figure 4). Moreover, the individual plasma glucose concentrations determined under both conditions (fasting vs eating) did not even correlate convincingly. These differences indicate that plasma glucose concentrations taken at the same time of the day during a 24-hour fasting period and during a 24-hour period with regular meal rhythm are influenced by different factors (eg, meal-related insulin injections), and cannot substitute for each other as determinants of the basal insulin infusion rate. We, therefore, advocate the use of plasma glucose concentrations obtained during prolonged fasting conditions.
This is supported by the fact that during 24-hour fasts, 15.4% of the plasma glucose concentrations taken were <3.9 mmol/L, a proportion significantly higher than during 24-hour profiles with regular meal rhythms (8.3%; P < .0001; during the day: 9.4%; at night: 6.0%); thus, a 24-hour fast helps detect fasting hypoglycemia, which would go undetected during regular plasma glucose profiles taken while the patients eat. Our estimate of the proportion of plasma glucose concentrations <3.9 mmol/L is surprisingly similar to that reported by Ly et al, 22 who used continuous plasma glucose measurements in pump-treated patients with type 1 diabetes with and without concomitant glucose sensors (day time: 5.7% and 8.3%; night time 7.3% and 11.1%) . This gives credibility to our estimates of the “proportion in range” (Figure 3) determined without continuous glucose measuring devices. For future studies, the use of continuous glucose measurements would be a helpful addition to provide even more details and precise estimates. While in the past, glycated hemoglobin in the target range was the main criterion for ascertaining acceptable metabolic control, most patients and clinicians want to achieve a maximum of readings in a safe zone, avoiding not only hyper- but also hypoglycemia. The exact value of the range of desired glucose levels is subject of an ongoing debate, but values in the range chosen here are of reasonable clinical importance and have been derived from recommendation by the American Diabetes Association for glycemic targets in the fasting range. 16 The doses of insulin needed to stay in such a desired range obviously vary by time of day.
Basal rate insulin infusion profiles in our cohort of insulin pump-treated type 1 diabetic subjects are characterized by substantial diurnal variations corresponding to a higher insulin demand, progressively increasing between 01:00 and 07:00
The present study has limitations: It is based on a database analyzed in a retrospective manner, with some incomplete datasets. Based on standard operating procedures established at the Diabeteszentrum Bad Lauterberg, plasma glucose was measured only at the time points analyzed, while shorter intervals would be desirable in particular during the night. Unfortunately, this starting and finishing point of 24-hour fasting tests was at 06:00
We used rather arbitrary definitions of plasma glucose target ranges that seemed appropriate for the fasting state in insulin-treated type 1 diabetic subjects. However, we used two definitions of the upper and lower thresholds of target ranges, and qualitatively found similar results with both, indicating a rather robust approach overall (Table 2).
In addition, the periods of the day that were of special interest (eg, because of different patterns of basal insulin infusion rates compared to the rest of the 24-hour period) followed the results obtained and have been arbitrarily defined post hoc, after inspecting the data.
We cannot provide data on the efficacy of modulating the programmed basal insulin infusion rate in response to knowledge gained during 24-hour fasting periods. However, the information gained through such tests would provide a rather rational basis for optimizing basal insulin infusion rates. We also have not compared 24-hour fasting periods with shorter periods of fasting (eg, optimizing basal insulin infusion rates based on overnight plasma glucose profiles or plasma glucose measurements determined when skipping individual meals 7 ).
We cannot rule out that some of our results are explained by certain traditions (eg, the choice of initial basal insulin infusion profile when starting insulin pump treatment with the help of published recommendations, like those widely distributed by manufacturers of insulin pumps, originating from analyses of small numbers of pump-treated patients with type 1 diabetes published by R. Renner and his group.4,14
However, the strength of our study is the relatively large cohort of subjects with type 1 diabetes using insulin pumps, who were subjected to a 24-hour fasting period with the use of an exact, laboratory-based measurement of plasma glucose. We are aware that this may not easily be possible in other health care environments, where in-patient treatment for the optimization of glycemic control is not available or reimbursed.
In conclusion, based on the assessment of 339 adult type 1 diabetic subjects using insulin pumps and undergoing 24-hour fasting periods to scrutinize the appropriateness of their basal insulin infusion rates, we found that, for the whole population, insulin demands were higher in the early morning hours, corresponding to a “dawn” phenomenon, and that such 24-hour fasting tests detect a multitude of plasma glucose concentrations outside the fasting plasma glucose range requiring reprogramming of the basal insulin infusion rate. We suggest that supervised 24-hour fasting periods are a helpful tool to optimize glycemic control in such patients, especially considering interindividual differences in insulin needs and their diurnal profiles.
Supplemental Material
InsulinPumpSupplement290719 – Supplemental material for Twenty-Four Hour Fasting (Basal Rate) Tests to Achieve Custom-Tailored, Hour-by-Hour Basal Insulin Infusion Rates in Patients With Type 1 Diabetes Using Insulin Pumps (CSII)
Supplemental material, InsulinPumpSupplement290719 for Twenty-Four Hour Fasting (Basal Rate) Tests to Achieve Custom-Tailored, Hour-by-Hour Basal Insulin Infusion Rates in Patients With Type 1 Diabetes Using Insulin Pumps (CSII) by Michael A. Nauck, Anna M. Lindmeyer, Chantal Mathieu and Juris J. Meier in Journal of Diabetes Science and Technology
Footnotes
Acknowledgements
We acknowledge the contribution of Heike Schulze, Sandra Tepelmann, Annette Varnhorn, and Martin Janert (all Diabeteszentrum Bad Lauterberg, Bad Lauterberg im Harz, Germany) to documenting all insulin pump treatments at this institution, and for helping retrieve patient data from hospital charts, and Melanie Kahle-Stephan (Diabetes center Bochum-Hattingen, Bochum, Germany) for generating the database on insulin-pump-treated subjects with type 1 diabetes.
Author Contributions
MAN and JJM designed the study; MAN and AML analyzed the data, performed the statistical analysis, and wrote the first draft of the manuscript. JJM and CM provided input into the analysis and into designing and writing the manuscript. All authors have seen an approved the final draft of this manuscript and have decided to submit it for publication. MAN is the guarantor who takes full responsibility for the work as a whole, including study design, access to data, and the decision to submit and publish the manuscript.
Declaration of Conflicts Interests
The author(s) declared the following potential conflicts of interest with respect to the research, authorship, and/or publication of this article: MAN has been member on advisory boards or has consulted with AstraZeneca, Boehringer Ingelheim, Eli Lilly & Co., Fractyl, GlaxoSmithKline, Menarini/Berlin Chemie, Merck, Sharp & Dohme, and NovoNordisk. He has received grant support from AstraZeneca, Eli Lilly & Co., Menarini/Berlin-Chemie, Merck, Sharp & Dohme, Novartis Pharma and NovoNordisk. He has also served on the speakers’ bureau of AstraZeneca, Boehringer Ingelheim, Eli Lilly & Co., Menarini/Berlin Chemie, Merck, Sharp & Dohme, NovoNordisk, and Sun Pharma. AML has no conflicts of interest to declare. CM serves or has served on advisory panels for Novo Nordisk, Sanofi, Merck Sharp and Dohme, Eli Lilly, Novartis, Bristol-Myers Squibb, AstraZeneca, Pfizer, Janssen Pharmaceuticals, Boehringer Ingelheim, Hanmi Pharmaceuticals, Roche Diagnostics, Medtronic, Mannkind, Intrexon, Dianax and UCB, and as a speaker for Novo Nordisk, Sanofi, Merck Sharp and Dohme, Eli Lilly, Boehringer Ingelheim, AstraZeneca and Novartis. Financial compensation for these activities has been received by KU Leuven. KU Leuven has received research support for Chantal Mathieu from Medtronic, Novo Nordisk, Sanofi, Merck Sharp and Dohme, Eli Lilly, Roche Diagnostics, Abbott, Intrexon and Novartis. JJM has received consulting and speaker honoraria from AstraZeneca, BristolMyersSquibb, Eli Lilly, Merck, Sharp & Dohme, Novo Nordisk and Sanofi. He has received research support from Eli Lilly, Boehringer-Ingelheim, Merck, Sharp & Dohme, Novo Nordisk, Novartis and Sanofi. SW has nothing to declare.
Funding
The author(s) received no financial support for the research, authorship, and/or publication of this article.
Access to Original Data
The authors are offering access to original data for research purposes upon reasonable request.
Supplemental Material
Supplemental material for this article is available online.
References
Supplementary Material
Please find the following supplemental material available below.
For Open Access articles published under a Creative Commons License, all supplemental material carries the same license as the article it is associated with.
For non-Open Access articles published, all supplemental material carries a non-exclusive license, and permission requests for re-use of supplemental material or any part of supplemental material shall be sent directly to the copyright owner as specified in the copyright notice associated with the article.