
Abstract
Background:
Pump-treated patients with type 1 diabetes have widely differing basal insulin infusion profiles. We analyzed consequences of such heterogeneity for glycemic control under fasting conditions.
Methods:
Data from 339 adult patients with type 1 diabetes on insulin pump therapy undergoing a 24-hour fast (basal rate test) were retrospectively analyzed. Hourly programmed basal insulin infusion rates and plasma glucose concentrations as well as their proportions within, below, or above arbitrarily defined target ranges were assessed for specific periods of the day (eg, 1-7 hours, “dawn” period, 16-19 hours, “dusk” period, reference period 20-1 hours/10-14 hours), by tertiles of a predefined “dawn” index (mean basal insulin infusion rate during the “dawn” divided by the reference periods).
Results:
The “dawn” index varied interindividually from 0.7 to 4.4. Basal insulin infusion profiles exhibited substantial differences (P = .011), especially overnight. Despite higher insulin infusion rates at 4 and 6.45 hours, patients with the most pronounced “dawn” phenomenon exhibited higher plasma glucose concentrations at those time points (P < .012). Patients with a marked “dawn” phenomenon exhibited a lower probability for low (<4.4 mmol/L) and a higher probability of high values (>7.2 mmol/L) during the dawn period (all P values <.01).
Conclusions:
We observe substantial interindividual heterogeneity in the “dawn” phenomenon. However, widely different empirically derived basal insulin infusion profiles appear appropriate for individual patients, as indicated by similar plasma glucose concentrations, mainly in the target range, during a 24-hour fasting period.
Keywords
Introduction
Recommendations vary widely regarding basal insulin infusion rates for pump treatment of type 1 diabetes.1-5 In many patients, a rather constant basal insulin infusion rate seems to provide appropriate control glycemia under basal (fasting) conditions, whereas in other patients, there seems to be a need for a transiently increased insulin delivery overnight,1,3-5 putatively addressing what is called the “dawn” phenomenon.6-9 This most prominent phenomenon is part of typical diurnal changes in insulin sensitivity and is thought to be caused by nocturnal growth hormone surges and their metabolic impact.7,10
In a recent analysis of a large patient database of adult pump-treated patients with type 1 diabetes undergoing 24-hour fasts as basal rate tests, the average pattern of insulin delivery comprised almost a doubling in basal insulin infusion rates between 1 and 7 hours, the overnight period when the “dawn” phenomenon is typically observed. 5 Analyses of plasma glucose concentrations during this critical period indicated that they tended to be rather higher than during the reference period (outside the time frame when a “dawn” or “dusk” phenomenon might occur). Along the same lines, the proportion of plasma glucose concentration below the target range at least tended to be significantly lower, and the proportion of plasma glucose concentrations that were above the target range were significantly higher than during the reference period. This indicated that overall basal insulin needs overnight might be even higher than empirically addressed with the patients’ current basal insulin profiles. At the same time, a large interindividual variation was observed in the extent of the “dawn” phenomenon as assessed by the “dawn” index, suggesting that the individual needs may vary widely between patients. 5
To further address the question, whether differential programming of hourly basal insulin infusion rates is appropriate, we wanted to analyze basal glycemic control in subgroups with basal insulin infusion profiles indicating a negligible or prominent “dawn” phenomenon. If those with a prominent rise in basal insulin infusion rates during the “dawn” period developed lower plasma glucose concentrations and higher proportions of values in the low/hypoglycemic range and lower proportions in the hyperglycemic range, this pattern of insulin delivery would prove inappropriate and indicate overtreatment. If, along the same lines, patients with a negligible increment in overnight basal insulin supply (rather constant diurnal profiles of basal insulin delivery) developed higher plasma glucose concentrations (along with more values falling into the hyperglycemic range and less values in the low/hypoglycemic range), this would speak in favor of an inadequately low insulin delivery during this critical period. If, in the face of substantial differences in basal insulin delivery during the “dawn” period, 5 plasma glucose control under fasting conditions turned out to be comparable, this would indicate an important degree of heterogeneity in basal insulin needs with respect to the “dawn” phenomenon between patients.
Therefore, we analyzed basal insulin infusion profiles and plasma glucose concentrations during a 24-hour fasting period to learn about the relationship of heterogeneous patterns of basal insulin delivery and their metabolic consequences in patients with varying degrees of a “dawn” phenomenon comparing tertiles with respect to the “dawn” index.
Methods
Description of the Patient Cohort
Patients with type 1 diabetes using insulin pumps and their selection for our analysis have been described in a previous communication. 5 Patients had an age of 16-80 years. Patients were excluded, if their diabetes type was different from type 1 diabetes, if they were pregnant at the time of inpatient treatment, or if no basal rate test (fasting period 24 hours) had been performed. Patients with an age of less than 16 years were excluded, because insulin requirements in children and adolescents are usually different.1,11 If a patient had been admitted to the hospital for the performance of a 24-hour fast (basal rate test) more than once, only the most recent dataset was used to most likely represent the individual optimum. Reasons for excluding individual data sets from the analysis have been described in detail. 5 Details regarding data extraction from individual patient charts and details of the protocol for performing 24-hour fasts as basal rate tests have been communicated previously. 5 Patients recently initiating insulin pump treatment used the recommendations made by the Roche Basal Rate Calculator12,13 widely distributed across Europe. Later, individual basal insulin infusion rates were optimized in clinical practice (guided by plasma glucose measurements) and, in the cohort of patients described in the present analysis, by performing 24 fasting basal rate tests.
Study Design
While the previous analysis of the same patient cohort looked at the totality of 339 patients in the cohort, 5 the present analysis divided the whole group into tertiles, based on the magnitude of the “dawn” phenomenon as assessed by the “dawn” index. The term “dawn” phenomenon is used in a descriptive manner, just stating the fact that basal insulin infusion needs increase during the night hours (1-7 hours), without implying any specific causative mechanism. For each tertile separately, hourly basal insulin infusion profiles and resulting patterns of plasma glucose concentrations during a standardized 24-hour fast were analyzed as previously described 5 to assess the appropriateness of individual basal insulin infusion rate profiles.
Measurements
Plasma glucose was measured in capillary samples using a glucose oxidase/amperometric method on a Biosen S-line Lab + (EKF Diagnostic GmbH, D-39179 Barleben, Germany) at prespecified time points (18, 20, 22, 24, 2, 4, 6.45, 9, 12, 14, and 18 hours).
Achievement of Fasting Plasma Glucose Targets During 24-Hour Fasts (Basal Rate Tests)
Two definitions for the target range of plasma glucose during fasting have been analyzed: First, our more stringent definition of this target range was 4.4-7.2 mmol/L (80-130 mg/dL) according to the definition of the fasting target range recently published by the American Diabetes Association. 14 This, in our clinical practice, is the range that is aimed for without suggesting or inducing changes in the insulin infusion rates when reached. Second, as a more relaxed definition, we used 3.9-9.0 mmol/L (70-162 mg/dL), because <3.9 mmol/L (<70 mg/dL) is equivalent to hypoglycemia, 14 and since for a target glycated hemoglobin of 7.5% (58 mmol/mol) this is the upper limit of the fasting plasma glucose range that would be equivalent. 14 This latter range appears generally acceptable; however, it would lead to attempts of optimizing basal insulin infusion rates, if single or more values lie outside the narrow target range as defined above.
The achievement of plasma glucose in the fasting target range was tested for each measurement taken at any time during the 24-hour fasting period (to fully represent the distribution of individual values) and at the patient level, ie, by calculating mean values for each individual subject in our cohort.
Appropriateness of diurnal variations in hourly insulin infusion rates with emphasis on the “dawn” and “dusk” phenomenon
Based on the diurnal profiles of basal insulin infusion rates (Figure 1), there were two periods (21-1 hours and 10-14 hours) with a rather flat and comparable basal insulin infusion profile. There also was a period with a progressive rise in hourly basal insulin infusion rates between 1 and 7 hours, tentatively representing the “dawn” phenomenon and period.7-9,15 Corresponding standard time points of measuring plasma glucose were at 2, 4, and 6.45 hours. There was another transient rise in hourly basal insulin infusion rates with a peak at 18 hours, tentatively representing a “dusk” phenomenon, with a corresponding time point of measuring plasma glucose at 18 hours. The flat parts of the basal insulin infusion profile were defined as non-“dawn”-non-“dusk” (or reference) period(s). Corresponding time points for determining plasma glucose were 22 and 24 hours as well as 12 and 14 hours. For each of these diurnal time periods, mean plasma glucose concentrations were calculated as well as the proportion of plasma glucose concentrations measured below the thresholds for low plasma glucose concentrations (“stringent” definition: <4.4 mmol/L; more “relaxed” definition: <3.9 mmol/L) and above thresholds for plasma glucose concentrations deemed to be too high (“stringent” definition: >7.2 mmol/L; “relaxed” definition: >9.0 mmol/L). The latter was performed as a sensitivity analysis. These proportions were also calculated for all time points when plasma glucose was measured.
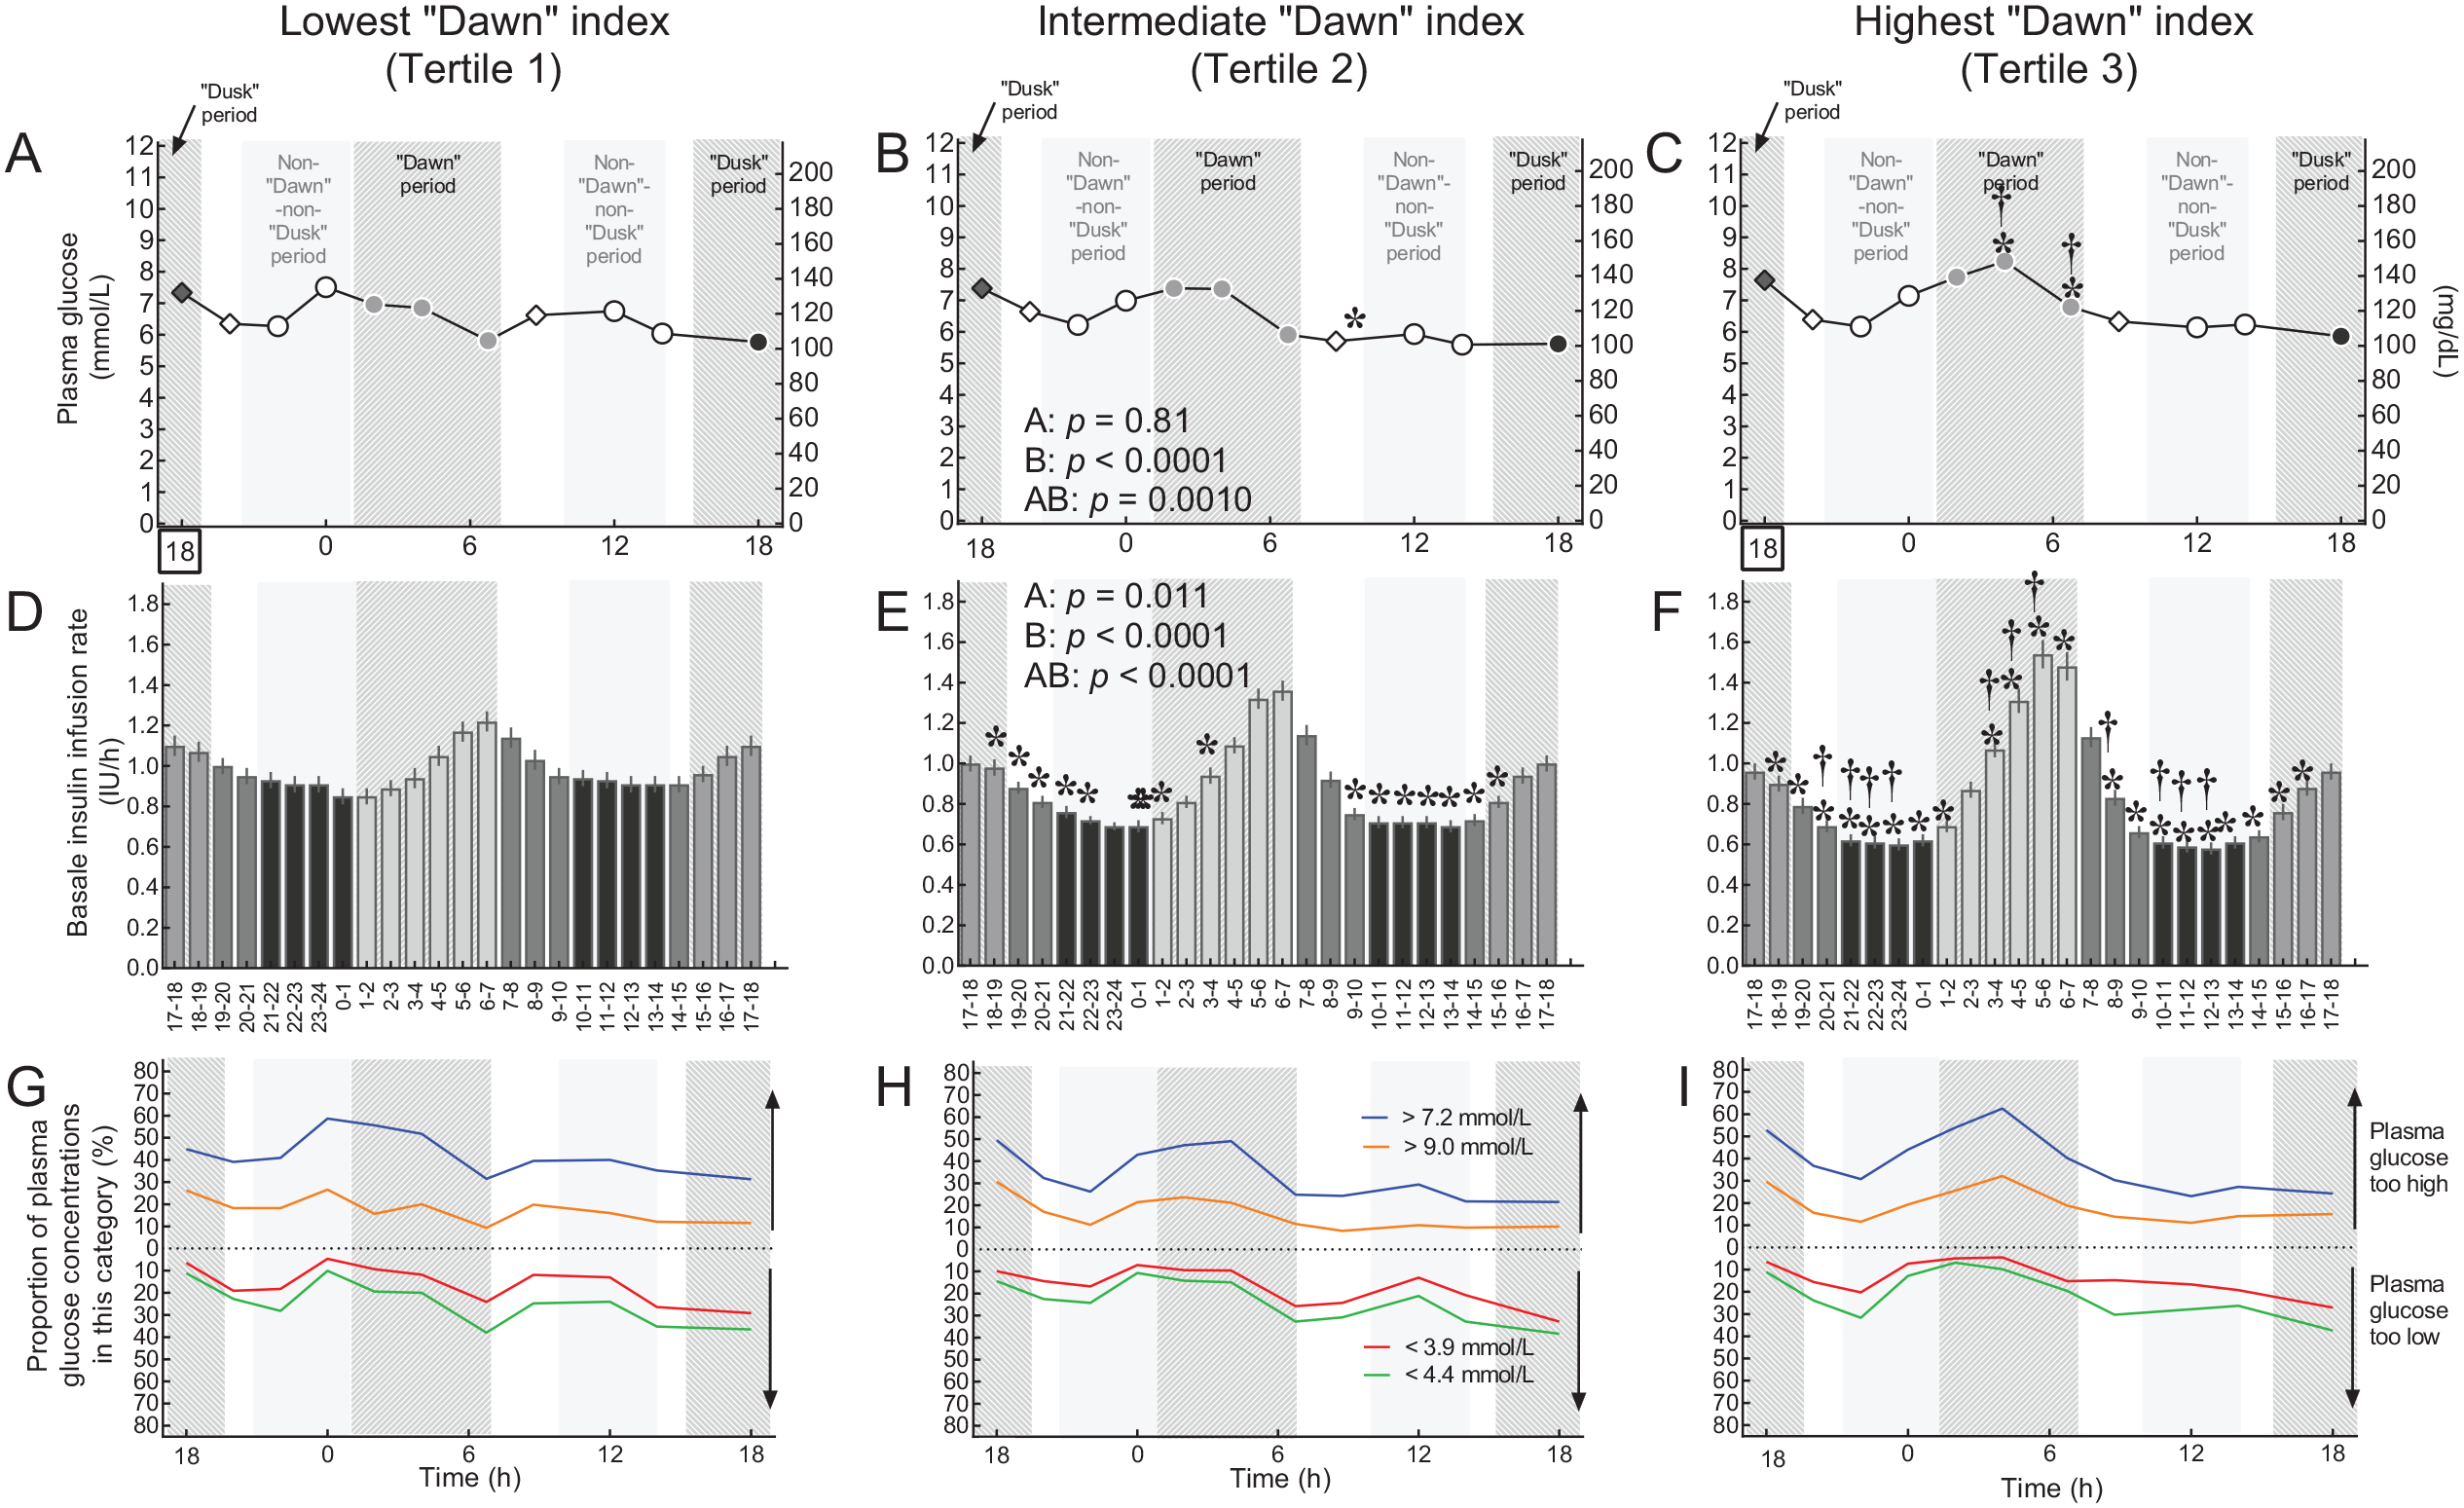
Basal insulin infusion rate profiles and results of 24-hour fasting periods performed as a basal rate test by by tertiles regarding the patients’ “dawn indices.” The upper row of panels (A–C) shows plasma glucose profiles during 24-hour fasting periods. The middle row of panels (D–F) shows current hour-by-hour basal insulin infusion profiles (IU per hour). The lower row of panels (G–I) shows proportions of patients with plasma glucose concentrations below thresholds indicating “below the target range” or hypoglycemia (<4.4 mmol/L or <3.9 mmol/L, respectively) or above thresholds indicating “above the target range” or hyperglycemia (>7.2 mmol/L or >9.0 mmol/L). For color codes regarding categories, see legend in panel H. A–F: Means ± standard error of the mean. G–I: Percent of all plasma glucose values available for this time point falling into this category. Light gray bars highlight the periods of the day as defined for the purpose of the present analysis. The “dawn” period from 1 to 7 hours, the “dusk” period from 15 to 19 hours, a reference period with a peak-less, flat insulin basal rate profile (10-14 hours and 20-1 hours, “non-“dawn”-non-“dusk” period). Plasma glucose concentrations are shown with different symbols if belonging to one of these predefined periods of the day. Time points 20 and 8.45 hours were considered not to belong to any of these predefined periods. Statistical analysis: Repeated-measures analysis of variance and Duncan’s post hoc test (A–F). For the statistical analysis of data displayed in panels G–I, see Table 2.
The proportion of patients with plasma glucose concentrations in a stringently defined (4.4-7.2 mmol/L) and a relaxed (3.9-9.0 mmol/L) target range were also calculated.
Proportions of plasma glucose concentrations that were too low or too high according to these definitions were calculated and compared between the “dawn” period or “dusk” period and the reference period. Odds ratios for the probability of glucose concentrations that were too low or too high comparing different periods of interest were determined. The rationale was to determine whether the hourly basal insulin infusion rate, which typically was higher during the “dawn” period than during other periods, leads to a higher probability of corresponding plasma glucose concentrations that were too low. In this case, the temporarily higher hourly basal insulin infusion rate would be judged inappropriate. Similar reasoning would apply to the “dusk” period.
Sample size calculation
Since our previous analysis of the present patient cohort indicated substantial (approximately 25%) difference in peak insulin infusion rates during the late “dawn” period, the sample size of tertiles (112-114 subjects) was thought adequate for detecting differences in basal glycemic control during the critical overnight period.
Statistical analysis
Patients’ characteristics are reported as means ± standard deviation or counts (n) as well as proportions (%). Results are reported as means ± standard error of the mean or means ± 95% confidence intervals as described in the figure and table legends. When proportions are reported, the number of patients fulfilling or not fulfilling the criterion in question is reported, thus presenting the total number of observations, allowing the extrapolation of missing data. Significances of differences between two time points or periods were tested by paired t-tests (continuous variables; Statistica Version 12.0, Statsoft Europe, Hamburg, Germany) or contingency table analysis (χ2 test categorical variables, GraphPad Prism version 7.00 for Windows, GraphPad Software, La Jolla, CA, USA, www.graphpad.com). P-values <.05 were taken to indicate significant differences.
Results
Patient Characteristics by Tertile of “Dawn” Index
Important subject characteristics did not differ significantly between the three tertiles (Table 1). The one noticeable exception is the duration of insulin pump treatment, which was slightly, but significantly, shorter in those with a prominent “dawn” phenomenon. Overall, basal insulin doses were 21.5 ± 9.2 IU per day, total insulin requirement was 42.9 ± 17.9 IU per day, and the proportion of basal relative to total insulin was 51% ± 11%. However, both absolute and relative (vs total insulin dose) amounts of basal insulin declined significantly when going from tertile 1 to tertiles 2 and 3. Thus, those with the most pronounced “dawn” phenomenon used relatively more mealtime insulin.
Subject Characteristics of Patients with Type 1 Diabetes Treated with Continuous Subcutaneous Insulin Infusion (Insulin Pumps) Who Performed a 24-Hour Fasting Test During Inpatient Service for Optimization of Plasma Glucose Control Divided into Three Tertiles with Different Pronounced “Dawn”-Phenomena: Tertile 1 with the Lowest Dawn Index, Tertile 2 with Intermediate, and Tertile 3 with the Highest Dawn Index.
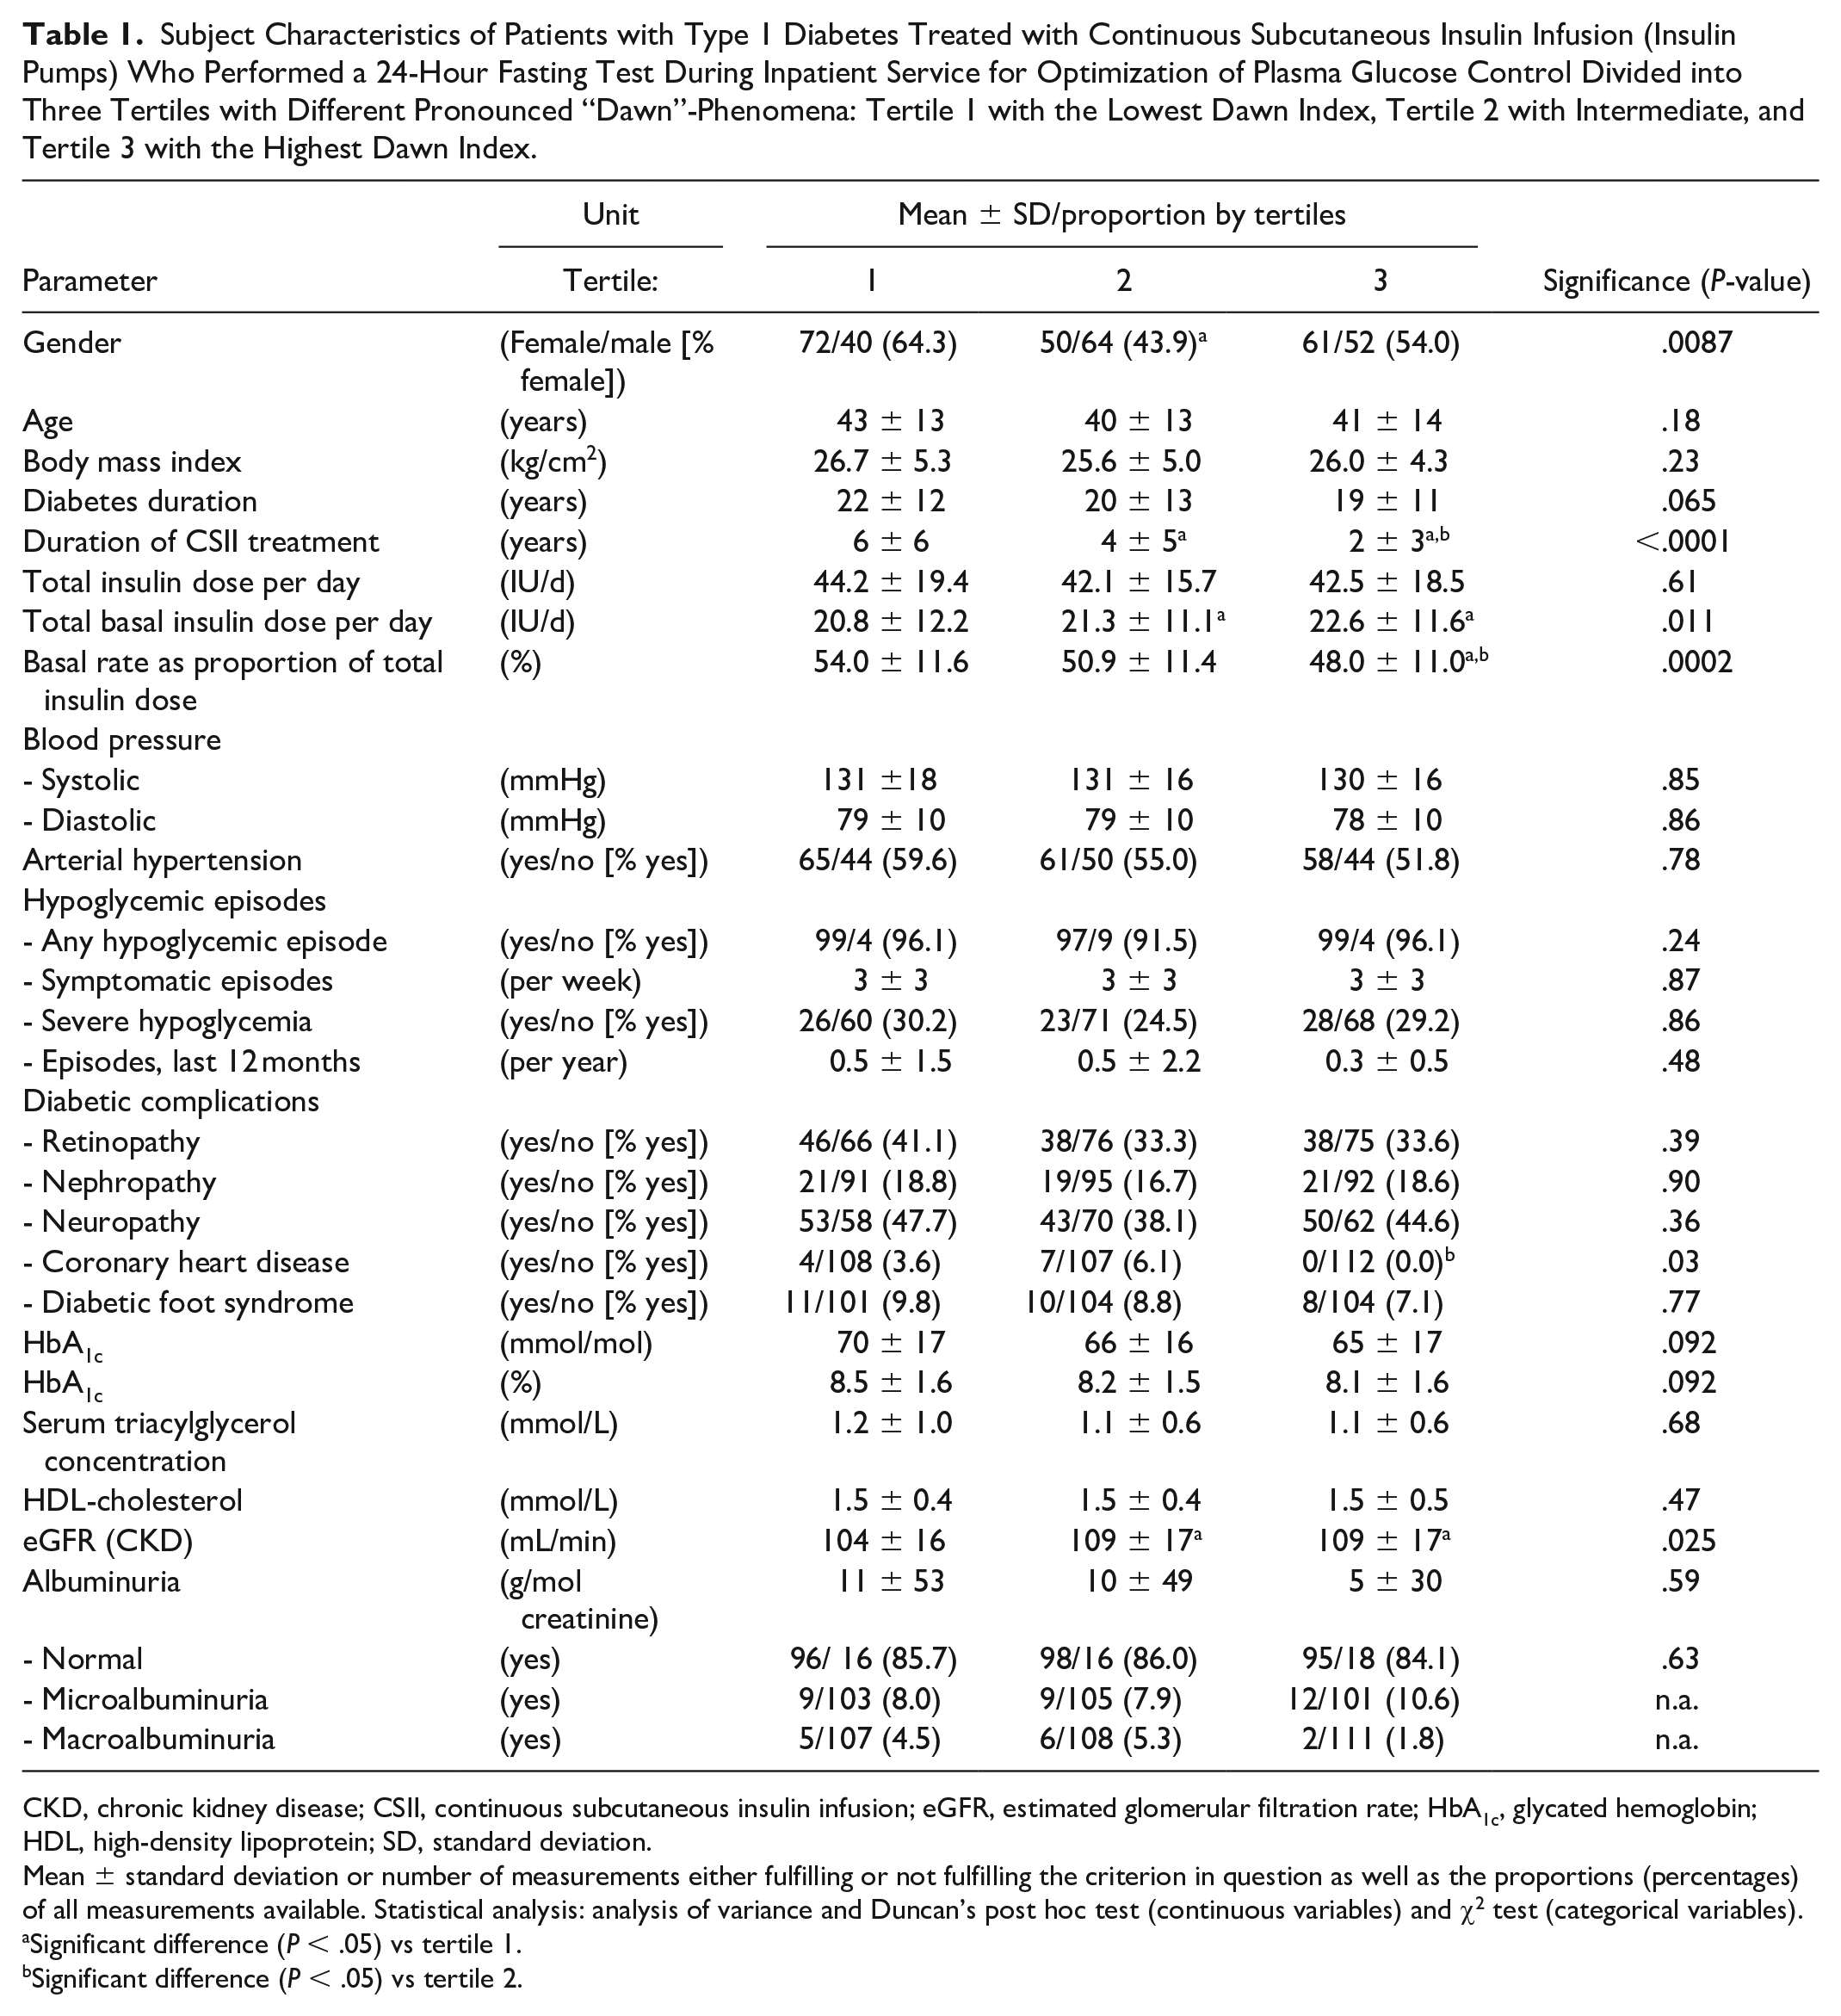
CKD, chronic kidney disease; CSII, continuous subcutaneous insulin infusion; eGFR, estimated glomerular filtration rate; HbA1c, glycated hemoglobin; HDL, high-density lipoprotein; SD, standard deviation.
Mean ± standard deviation or number of measurements either fulfilling or not fulfilling the criterion in question as well as the proportions (percentages) of all measurements available. Statistical analysis: analysis of variance and Duncan’s post hoc test (continuous variables) and χ2 test (categorical variables).
Significant difference (P < .05) vs tertile 1.
Significant difference (P < .05) vs tertile 2.
Basal Insulin Infusion Rates and 24 Fasting Plasma Glucose Profiles by Tertiles of the “Dawn” Index
Despite substantial and highly significant differences between the three tertiles in 24-hour basal insulin infusion rates (mainly apparent during the “dawn” period from 1 to 7 hours), plasma glucose profiles displayed rather minor differences between the three tertiles (Figure 1). The main differences were higher plasma glucose concentrations during 24-hour fasting at the peak of the “dawn” phenomenon (4 and 6.45 hours). In all three tertiles, the probability of low or even hypoglycemic plasma glucose concentrations during the dawn period was rather lower than during other periods of the day (Figure 1G–I; Table 2). Conversely, the probability of high or even hyperglycemic plasma glucose concentrations was rather higher during the “dawn” period compared to other times of the 24-hour period (Figure 1G–I; Table 2).
Comparison of Plasma Glucose Concentrations and Proportions of Plasma Glucose Concentrations That Were Too Low or Too High During Periods of a 24-Hour Fasting Period (Basal Rate Test) That Were Characterized by the Dawn or Dusk Phenomenon Versus Those Measure Outside These Periods Divided into Three Tertiles with Different Pronounced “Dawn”-Phenomena: Tertile 1 with the Lowest Dawn Index, Tertile 2 with Intermediate, and Tertile 3 with the Highest Dawn Index.
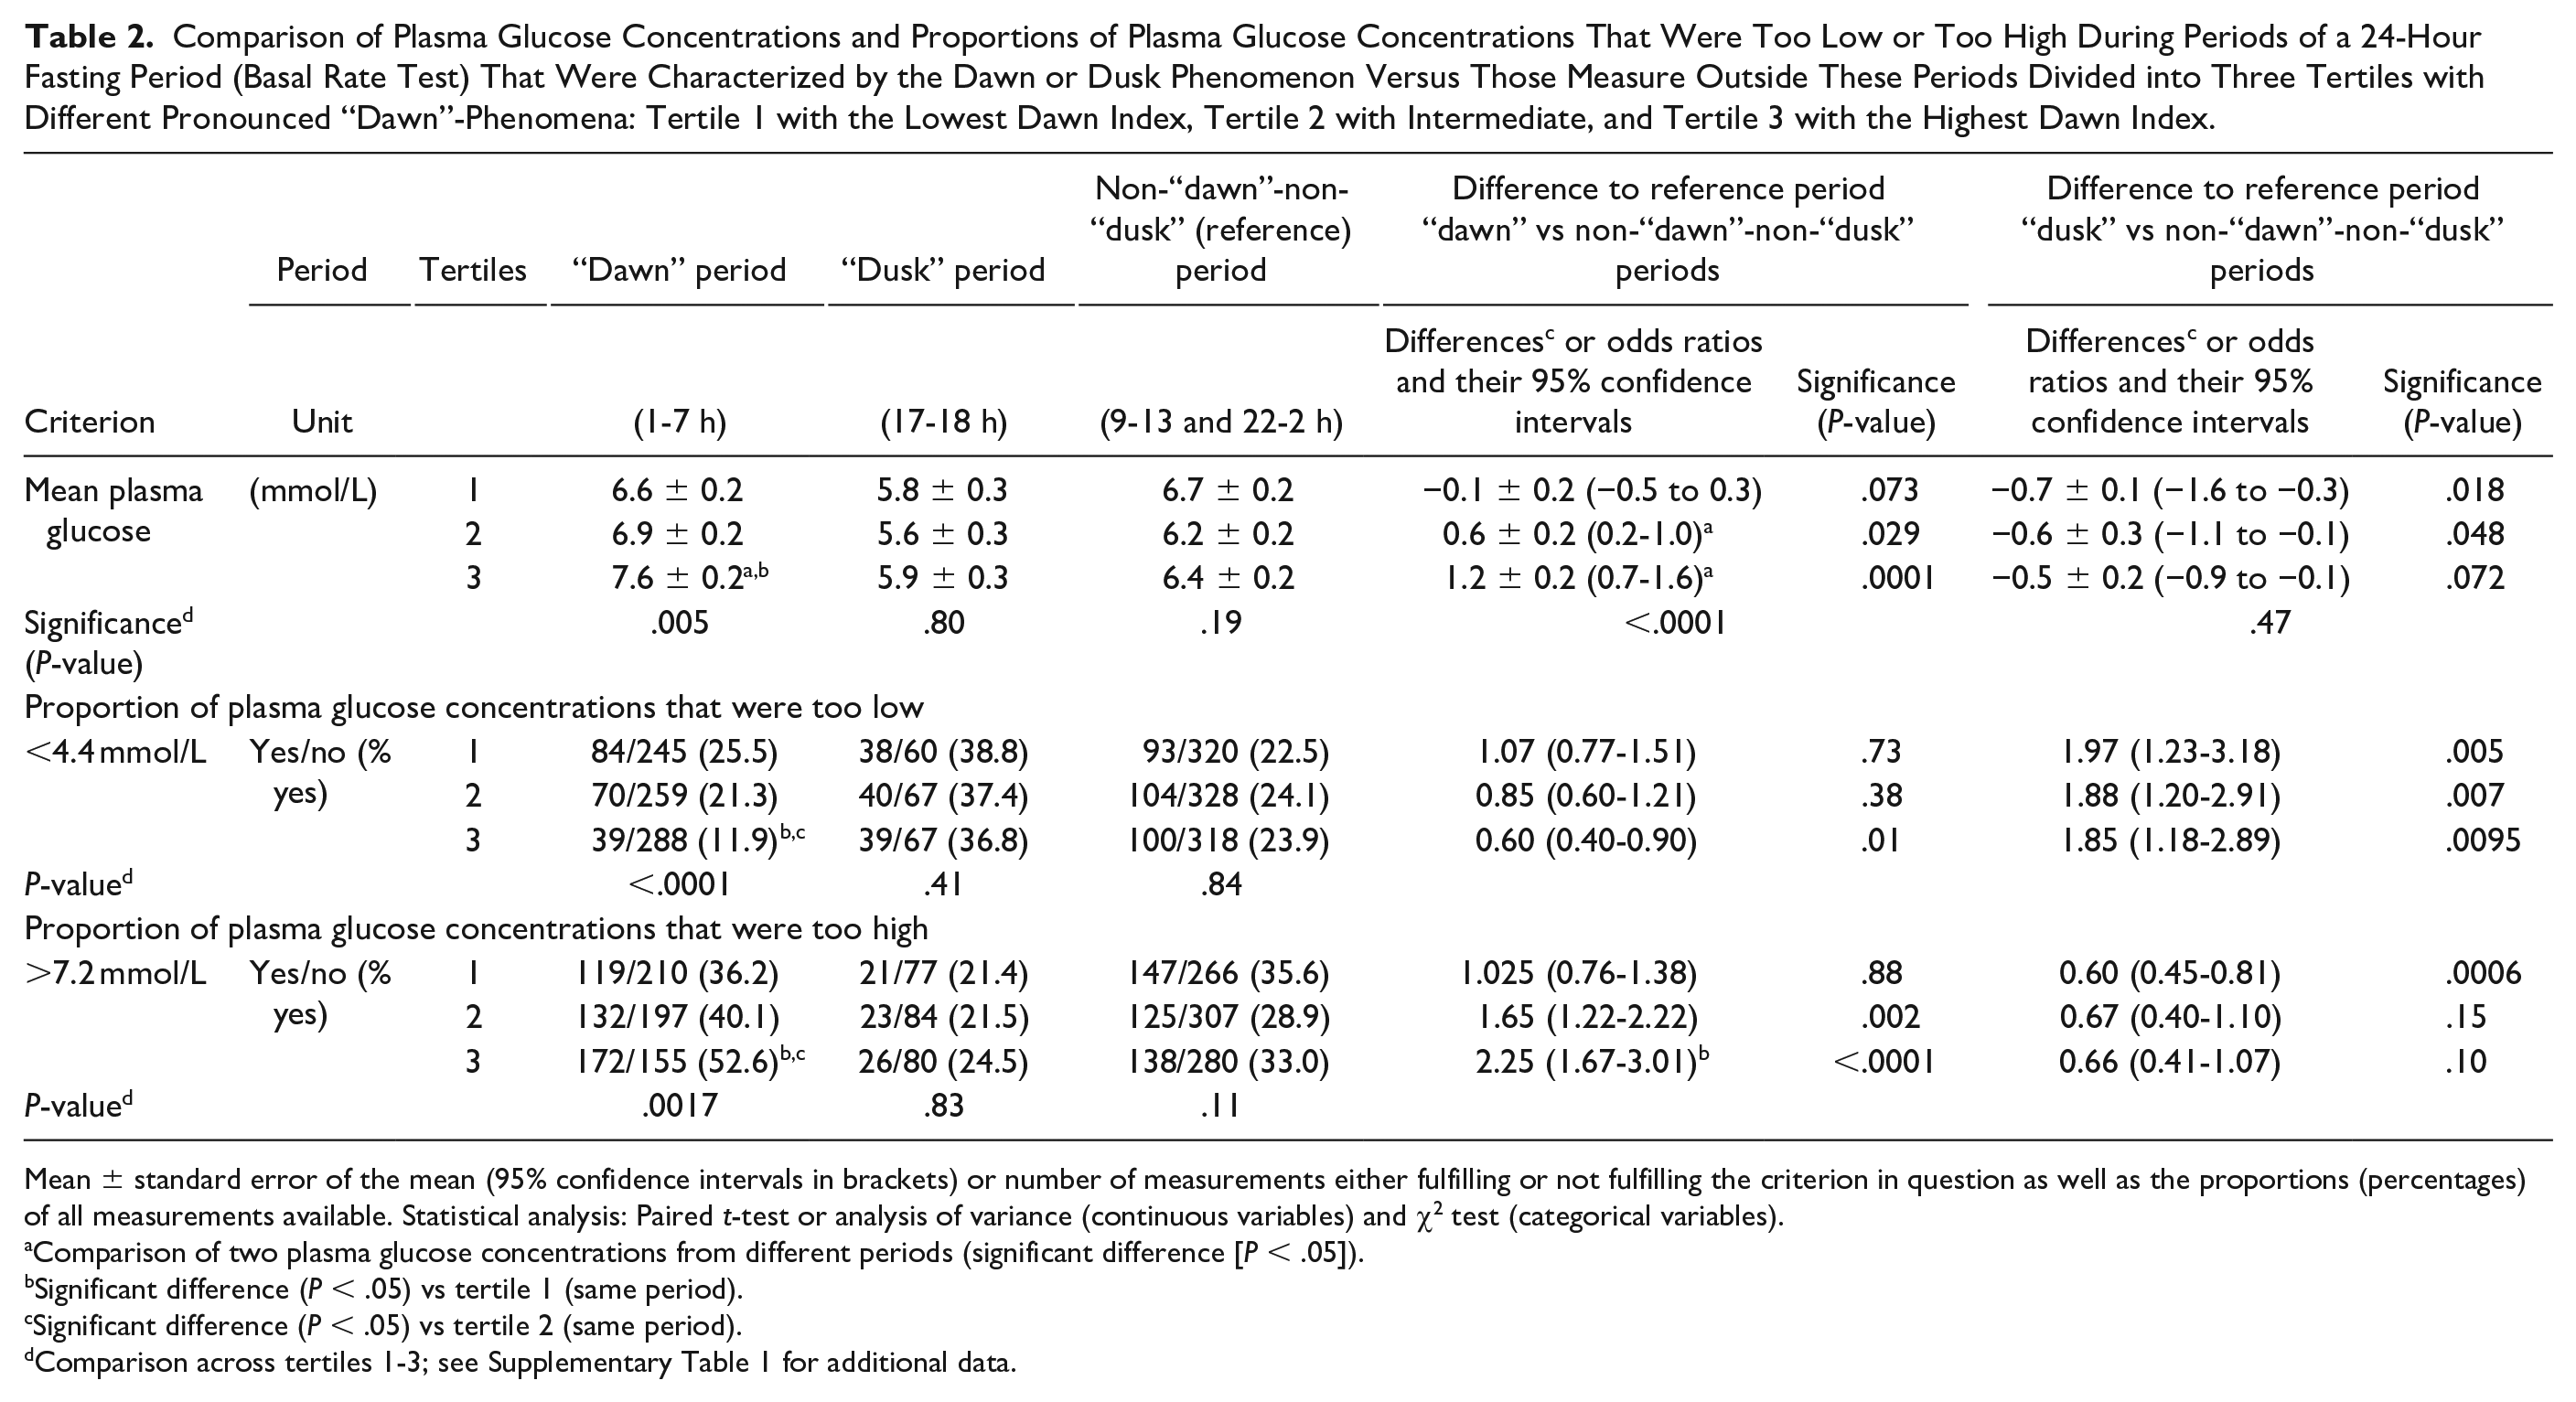
Mean ± standard error of the mean (95% confidence intervals in brackets) or number of measurements either fulfilling or not fulfilling the criterion in question as well as the proportions (percentages) of all measurements available. Statistical analysis: Paired t-test or analysis of variance (continuous variables) and χ2 test (categorical variables).
Comparison of two plasma glucose concentrations from different periods (significant difference [P < .05]).
Significant difference (P < .05) vs tertile 1 (same period).
Significant difference (P < .05) vs tertile 2 (same period).
Comparison across tertiles 1-3; see Supplementary Table 1 for additional data.
Interestingly, the higher “dawn” indices for tertiles 2 and 3 were not only due to higher basal insulin infusion rates during the peak “dawn” period (applies only to tertile 3), but rather to lower basal insulin infusion rates during the (non-“dawn”-non-“dusk”) period (Figure 1D–F).
Distribution of Plasma Glucose Concentrations During a 24-Hour Fasting Period
Both based on all single plasma glucose measurements and individual mean values, the distribution across plasma glucose categories ranging from 0 to >20 mmol/L was similar across “dawn” index tertiles. The majority of values fell into the predefined target ranges (Supplementary Figure S1). However, the range of distribution was significantly narrower in the case of individual mean values.
Proportion of Plasma Glucose Concentrations During a 24-Hour Fast Within Predefined Target Ranges
Approximately 90% of individual mean plasma glucose concentrations fell into the range 3.9-9.0 mmol/L, independent of the magnitude of the “dawn” index (tertile) (Figure 2). Sixty to seventy percent of all individual mean plasma glucose concentrations were in the narrower target range (4.4-7.2 mmol/L), again independent from the “dawn” index tertile. Approximately 65%-75% of all individual plasma glucose concentrations measured at any time point fell into the range 3.9-9.0 mmol/L. This proportion was significantly higher in tertile 3 compared to tertiles 1 and 2. Approximately 40% of all individual plasma glucose concentrations were in the narrower target range (4.4-7.2 mmol/L), again independent of the “dawn” index tertile.
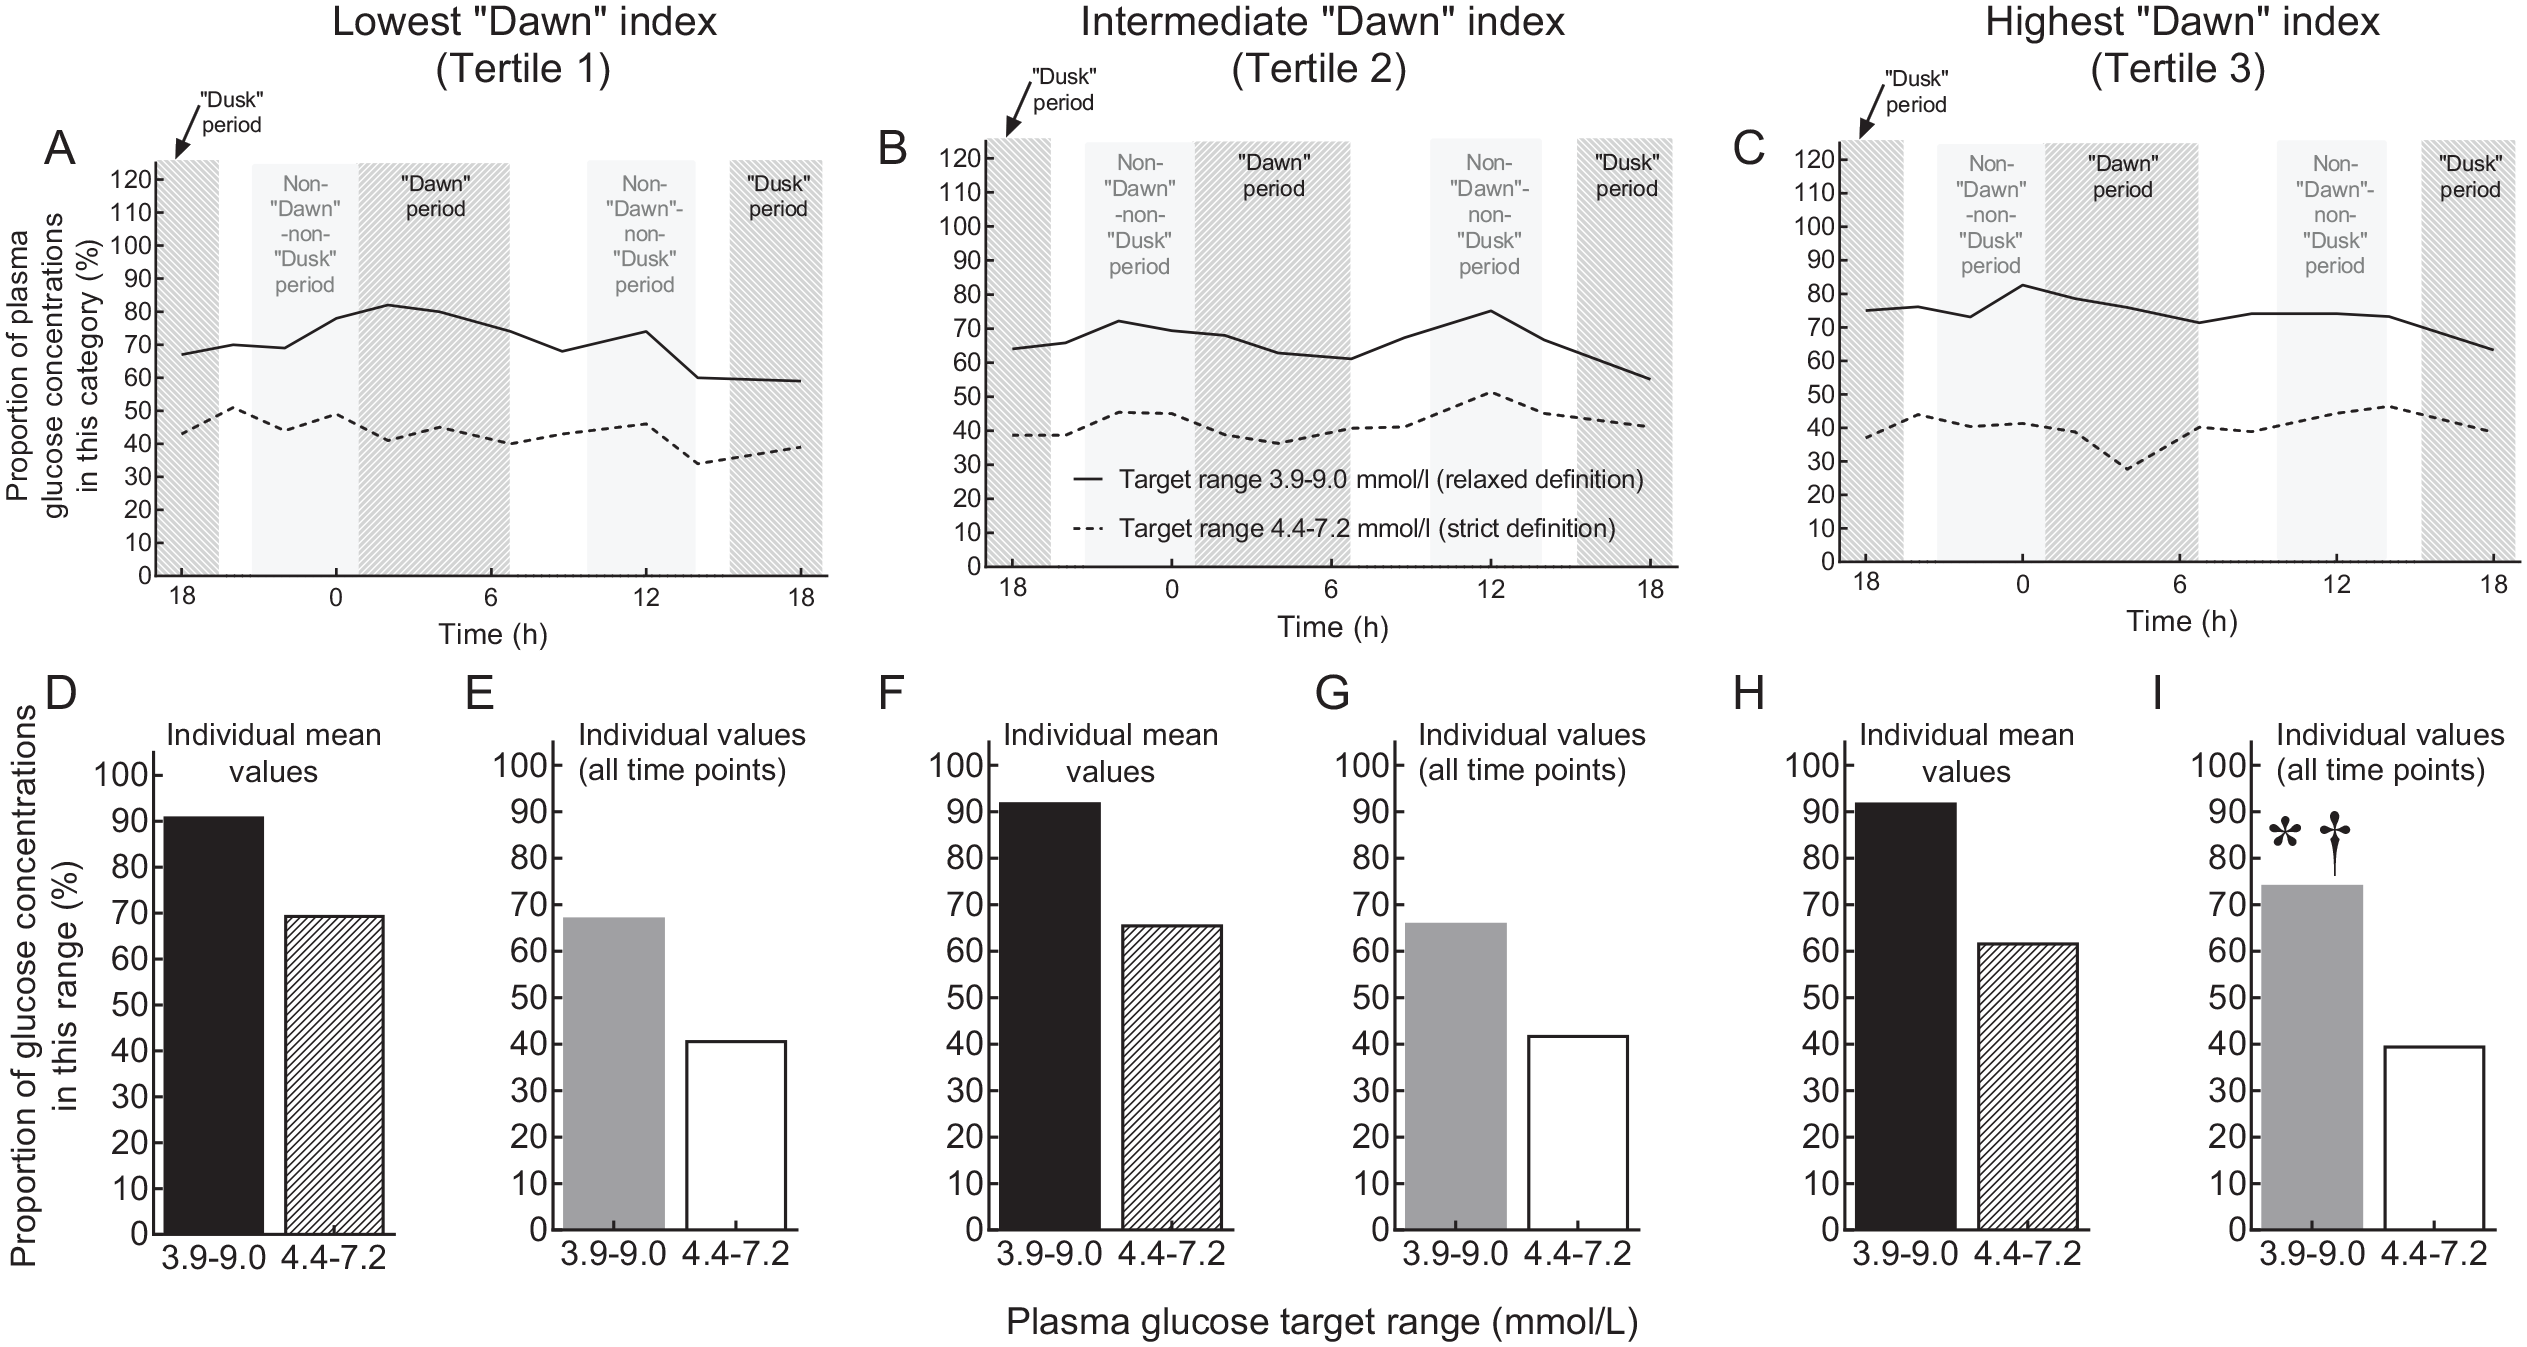
Proportions of plasma glucose measurements within predefined target ranges (“strict”: 4.4-7.2 mmol/L; “relaxed”: 3.9-9.0 mmol/L) by tertiles regarding the patients’ “dawn indices.” Results for all patients by clock time are shown in the upper row of panels (A–C). The predefined periods of the day are indicated by light gray shades. In the lower row of panels (D-I), target achievement for individual mean plasma glucose concentrations is shown in black (target range 3.9-9.0 mmol/L) and striped (target range 4.4-7.2 mmol/L) bars; target achievement for individual plasma glucose concentrations measured at any time point is shown as gray (target range 3.9-9.0 mmol/L) and white (target range 4.4-7.2 mmol/L) bars. Across tertiles, there were no significant differences regarding the black (P = .83), striped (P = .56), and white (P = .25) bars. However, for the gray bars, χ2-test indicated a significant difference (P < .0001). The asterisk indicates a significant difference (P < .05) vs tertile 1, and the dagger indicates a significant difference (P < .05) vs tertile 2.
Magnitude of the Transient Rise in Basal Insulin Infusion Rates During the “Dawn” and “Dusk” Periods
Going from tertile 1 to 3, the “dawn” index increased significantly from a mean of 1.1 (tertile 1) to 1.5 (tertile 2) to 2.0 (tertile 3). Likewise, the “dusk” index increased from approximately 1.2 to 1.3 to 1.5 (tertiles 1-3), with all differences being significant. In tertile 1, there was no significant difference between the “dawn” and dusk” indices, whereas in tertiles 2 and 3, the “dawn” index was significantly greater than the “dusk” index. As a consequence, there was less overlap between the individual “dawn” and “dusk” indices going to tertiles 2 and 3.
Appropriateness of Increased Basal Insulin Infusion Rates During the “Dawn” Period
Figure 1G–I demonstrates that during the period characterized by progressively rising hourly basal insulin infusion rates (1-7 hours) the proportion of plasma glucose concentrations that were above the target ranges tended to be higher, while those below the target range tended to be reduced when compared to the rest of the day in all tertiles regarding the “dawn” index. Table 2 breaks down these proportions below and above the target ranges comparing the period of the day characterized by the “dawn” phenomenon (1-7 hours) with rather “uneventful” periods of the 24-hour profile that were used as a reference. The reference period was characterized by the absence of any noticeable peaks or troughs regarding hourly basal insulin infusion rates. Remarkably, during the “dawn” period, especially in tertile 3 (with the most prominent “dawn” phenomenon), the proportion of low glucose concentrations (in comparison to both thresholds) was significantly lower. The odds ratios for observing low/hypoglycemic plasma glucose concentrations were <1.00. Conversely, again in tertile 3, the proportion of high plasma glucose concentrations was significantly higher during the “dawn” period, resulting in odds ratios >1.00 for observing high/hyperglycemic plasma glucose concentrations (Table 2). At least a similar trend was observed for tertile 2. This indicates that patient belonging to tertile 3 would most likely benefit from an even higher insulin delivery rate during the “dawn” period.
The “dawn” index did not display a significant negative correlation with age (r2 = 0.0037, P = .26), but with diabetes duration (r2 = 0.0177, P = .014) and with duration of pump treatment (r2 = 0.0819, P < .0001). However, there were no significant differences between the three “dawn” tertiles regarding age and diabetes duration (Table 1).
The “Dusk” Phenomenon
Across the three tertiles regarding the “dawn” index, the plasma glucose concentration at 18 hours (end of 24-hour fasting period) tended to be the lowest value of all time points measured (Figure 1A–C). For all three tertiles, basal insulin infusion rates increased from 14 to 18 hours with a slow decline thereafter. As indicated in Figure 1G–I, 18 hours is the time with the highest probability of low/hypoglycemic plasma glucose concentrations, again in all tertiles. Accordingly, the probability of measuring plasma glucose concentrations that were below the target range or even hypoglycemic was significantly increased during the “dusk” period.
Sensitivity Analyses
Since the generation of tertiles regarding the “dawn” phenomenon relied on the arbitrary choice of the “dawn” index, we performed a sensitivity analysis using tertiles based on the coefficient of variation of individual hourly basal insulin infusion rates instead. This approach makes no assumption about when during the day peaks and troughs in basal insulin delivery occur. The results of this analysis are presented in Supplementary Tables S1 and S2 and in Supplementary Figures S3 to S6 and fully confirm the results of our primary analysis.
Conclusion
Further to the insights gained from our previous analysis of the entire cohort of pump-treated patients with type 1 diabetes, 5 the present analysis based on the comparison of tertiles regarding overnight increments in basal insulin delivery (the “dawn” index representing the “dawn” phenomenon) allows the following conclusions:
(a) Based on the process of empirically optimizing individual basal insulin infusion profiles, the results differ widely between subjects regarding their apparent need for an overnight rise in basal insulin delivery rates. There are patients with type 1 diabetes with a “dawn” index near 1, ie, with no evidence of an increased insulin need during the “dawn” period, but there are also patients with a highly prominent “dawn” phenomenon, characterized by an up to 4.4-fold increment in average hourly basal insulin delivery rates between 1 and 7 hours.
(b) Despite the substantial and significant differences in basal insulin infusion profiles, especially during the “dawn” period, plasma glucose concentrations only marginally differ between the three tertiles regarding the “dawn” index. If anything, the tertile with the most extensive expression of the “dawn” phenomenon still has the highest plasma glucose concentrations and the lowest probability of low or even hypoglycemic plasma glucose values and the highest probability of high/hyperglycemic plasma glucose concentrations during that period (Figure 1; Table 2). This indicates that (at least some of) these patients would probably require even more basal insulin during this critical period.
(c) Our analysis indicates that there are no prominent patient characteristics predicting the need for a smaller or greater compensatory increase of overnight basal insulin infusion rates (Table 1). Thus, for the time being, this important distinction can only be made on empirical grounds. It is not known which biological factors may have changed with longer pump treatment and could be responsible for any impact on overnight basal insulin requirements. Perhaps, initial rules to program insulin pumps have changed, such that those with recent start of their insulin pump treatment may have been suggested profiles with more accentuated overnight rises in basal insulin infusion rates. Longer duration of pump treatment may mean more opportunity to empirically change the basal insulin infusion profile. However, if this was an important differentiator regarding the basal insulin infusion profile with regard to the overnight period, this should have led to more marked differences in fasting plasma glucose profiles.
(d) The present analysis supports conclusion from our previous publication 5 that a late afternoon rise in basal insulin delivery potentially addressing a putative “dusk” phenomenon16,17 has become part of typical basal insulin infusion profiles, but leads to lower plasma glucose concentrations and a higher probability of glucose concentrations below the target or even in the hypoglycemic range (Table 2). This suggests that a potential “dusk” phenomenon16,17 has been overaddressed with the basal insulin infusion profiles used by our patients.
(e) A sensitivity analysis based on a second approach for categorization of patients solely based on the coefficient of variation of individual hourly basal insulin infusion rates fully confirms the conclusions to be drawn. This second analysis does not make any assumptions regarding the time period of higher or lower than average basal insulin infusion rates and simply describes patients with a lower versus a greater diurnal variability in insulin needs.
The absence of a relationship between the extent of the “dawn” phenomenon and age argues against growth hormone secretion7,10 as the sole causative mechanism for what we describe as the “dawn” phenomenon in our patient cohort.
In healthy human subjects, data addressing basal insulin secretion are only available from studies with subjects eating regular meals. Such studies do not show an obvious rise in insulin or C-peptide concentrations during the night hours.18,19 Whether overnight insulin and C-peptide concentrations determined under those conditions purely represent basal insulin needs is questionable. After a meal it takes >5 hours to re-establish postabsorptive steady-state. 20 Nevertheless, these studies could indicate that the “dawn” phenomenon as assessed in the present study is less apparent in healthy subjects and could even be an artifact related to insulin pump treatment in type 1 diabetes.
When interpreting the current results, we have to take into account the time course of insulin action after delivery into the subcutaneous compartment. Absorption, distribution into insulin-sensitive tissues, and exposure of insulin receptors with ensuing signaling processes are not at all instantaneous, but take several hours to achieve a new steady state after changing insulin delivery rates. 21 However, significantly different insulin infusion rates between the tertiles of the “dawn” phenomenon should lead to differences in plasma glucose concentrations several hours after these differences occurred, unless these differences are justified by truly different diurnal insulin requirements (eg, differences in insulin sensitivity, which apparently varies over a 24-hour period 22 ).
The relatively lower proportion of basal insulin relative to total insulin requirements in those with a more marked “dawn” phenomenon indicates that deficits in basal insulin provision (eg, during our reference periods) might potentially be compensated for by using higher amounts of meal-related insulin. However, our analysis focusses on the influence of basal insulin on fasting plasma glucose, which appears to be appropriately controlled under the conditions of the present study.
Whereas the pathophysiology of the “dawn” phenomenon has been delineated by appropriate mechanistic studies,7,8,10,15 the “dusk” phenomenon is much less well defined,16,17 and to our knowledge, no accepted pathophysiological mechanism has been described. We believe that the use of transiently higher basal insulin infusion rates during the late afternoon hours is based on the recommendations often used for the initiation of insulin pump treatment.12,13
Insulin pump therapy nowadays is often combined with continuous glucose monitoring (sensor-augmented pump therapy23,24), sometimes with an added “low glucose suspend” function to prevent hypoglycemia and/or to accelerate recovery from low glucose concentrations. Data generated during such episodes with low glucose concentrations might even help optimize basal insulin infusion rates. 25 Even “closed-loop” insulin delivery systems26-29 may benefit from individualized assumptions regarding diurnal changes in basal insulin requirements. The study published by Ruan et al 28 confirms our results regarding wide interindividual variations of overnight insulin requirements using a “closed-loop” insulin delivery approach, ie, employing a completely different methodology. There is evidence for a significant day-to-day variability in basal insulin infusion requirements (Ruan et al 28 ). However, this study used 24-hour closed-loop insulin delivery in subjects with type 1 diabetes unrestricted regarding meal intake and sleeping hours. Such variables may have contributed to the intraindividual variation in overnight insulin requirements reported. The intraindividual day-to-day variability in basal insulin needs under fasting condition has been studied by Perriello et al 8 and was found to be low (coefficient of variation approximately 5%). The dawn phenomenon, on average, amounted to around 22% (up to 30%), whereas in our study, the average dawn phenomenon for all patients was 52% ± 43%. One reason could be that plasma glucose in Perriello et al’s study 8 continuously increased from 2 to 7 hours, leading to some underestimation of the “dawn” phenomenon for technical reasons. Alternative reasons could be differences in patient characteristics.
Our study supports the careful individual choice of basal insulin infusion rates in pump-treated patients with type 1 diabetes. We believe that even patients employing these advanced methods for optimizing glycemic control might benefit from a carefully chosen basal insulin infusion rate that corresponds with their individual biology, eg, concerning their nocturnal growth hormone secretion.7-10,15
Given the heterogeneity in diurnal variations in basal insulin needs, the question arises how insulin pumps should be programmed when beginning such treatment. Based on our previous analysis of all patients in our cohort, we suggest to start with a profile with a 30% rise in insulin delivery between 1 and 7 hours (slightly lower than the average we found in our cohort). Another reasonable option would be to start with a flat profile. Most important seems to the awareness that interindividual differences exist, and that basal insulin profiles may need to be empirically changed in order to optimize basal insulin delivery according to individual needs.
Our study has limitations: This is a patient cohort collected and a data set generated over a number of years now analyzed in a retrospective manner. The criteria for generating tertiles based on the “dawn” index are empirical and driven by the current analysis. As discussed in our previous publication, 5 24-hour fasts in inpatients are not a universally accepted way of approving appropriateness of basal insulin infusions rates and may not be available in other regions of the world. Strengths of the present analysis are the standardized 24-hour fasting experiments using exact laboratory plasma glucose measurements, the relatively large patient number even when breaking the population down into tertiles, and the detailed statistical analysis.
In conclusion, our study indicates a prominent heterogeneity among insulin pump-treated patients with type 1 diabetes regarding the quantitative prominence of their overnight increment in basal insulin infusion requirements. Nevertheless, irrespective of these marked differences ranging from a negligible to a prominent “dawn” phenomenon, 24-hour fasting provided similar plasma glucose profiles, indicating the appropriateness of individual, empirically derived basal insulin infusion rates. Thus, this heterogeneity should be addressed in clinical practice in order to provide patients with a basal insulin infusion profile that meets their individual needs.
Supplemental Material
AMLDawnTertilesSupplement100820 – Supplemental material for Patients with Type 1 Diabetes Treated with Insulin Pumps Need Widely Heterogeneous Basal Rate Profiles Ranging from Negligible to Pronounced Diurnal Variability
Supplemental material, AMLDawnTertilesSupplement100820 for Patients with Type 1 Diabetes Treated with Insulin Pumps Need Widely Heterogeneous Basal Rate Profiles Ranging from Negligible to Pronounced Diurnal Variability by Anna M. Lindmeyer, Juris J. Meier and Michael A. Nauck in Journal of Diabetes Science and Technology
Footnotes
Acknowledgements
We acknowledge the contribution of Heike Schulze, Sandra Tepelmann, Annette Varnhorn, and Martin Janert (all Diabeteszentrum Bad Lauterberg, Bad Lauterberg im Harz, Germany) to documenting all insulin pump treatments at this institution, and for helping retrieve patient data from hospital charts, and Melanie Kahle-Stephan (Diabetes center Bochum-Hattingen, Bochum, Germany) for generating the database on insulin-pump-treated subjects with type 1 diabetes.
Author Contributions
MAN and JJM designed the study, and MAN and AML analyzed the data, performed the statistical analysis, and wrote the first draft of the manuscript. JJM provided input into the analysis and into designing and writing the manuscript. All authors have seen and approved the final draft of this manuscript and have decided to submit it for publication. MAN is the guarantor who takes full responsibility for the work as a whole, including study design, access to data, and the decision to submit and publish the manuscript.
Declaration of Conflicting Interests
The author(s) declared the following potential conflicts of interest with respect to the research, authorship, and/or publication of this article: AML has no conflicts of interest to declare. MAN has been member on advisory boards or has consulted with AstraZeneca, Boehringer Ingelheim, Eli Lilly & Co., Fractyl, GlaxoSmithKline, Menarini/Berlin Chemie, Merck, Sharp & Dohme, and NovoNordisk. He has received grant support from AstraZeneca, Eli Lilly & Co., Menarini/Berlin-Chemie, Merck, Sharp & Dohme, Novartis Pharma, and NovoNordisk. He has also served on the speakers’ bureau of AstraZeneca, Boehringer Ingelheim, Eli Lilly & Co., Menarini/Berlin Chemie, Merck, Sharp & Dohme, NovoNordisk, and Sun Pharma.JJM has received consulting and speaker honoraria from AstraZeneca, BristolMyersSquibb, Eli Lilly, Merck, Sharp & Dohme, Novo Nordisk, and Sanofi. He has received research support from Eli Lilly, Boehringer-Ingelheim, Merck, Sharp & Dohme, Novo Nordisk, Novartis, and Sanofi.
Funding
The author(s) received no financial support for the research, authorship, and/or publication of this article.
Access to Original Data
The authors are offering access to original data for research purposes upon reasonable request.
Supplemental Material
Supplemental material for this article is available online.
References
Supplementary Material
Please find the following supplemental material available below.
For Open Access articles published under a Creative Commons License, all supplemental material carries the same license as the article it is associated with.
For non-Open Access articles published, all supplemental material carries a non-exclusive license, and permission requests for re-use of supplemental material or any part of supplemental material shall be sent directly to the copyright owner as specified in the copyright notice associated with the article.