
Abstract
Background:
Continuous glucose monitors (CGMs) have become important tools for providing estimates of glucose to patients with diabetes. Recently, neural networks (NNs) have become a common method for forecasting glucose values using data from CGMs. One method of forecasting glucose values is a time-delay feedforward (FF) NN, but a change in the CGM location on a participant can increase forecast error in a FF NN.
Methods:
In response, we examined a NN with gated recurrent units (GRUs) as a method of reducing forecast error due to changes in sensor location.
Results:
We observed that for 13 participants with type 2 diabetes wearing blinded CGMs on both arms for 12 weeks (FreeStyle Libre Pro—Abbott), GRU NNs did not produce significantly different errors in glucose prediction due to sensor location changes (P < .05).
Conclusion:
We observe that GRU NNs can mitigate error in glucose prediction due to differences in CGM location.
Introduction
Diabetes mellitus is a metabolic disease ensuing from insufficient β-cell action in the pancreas. Common classifications of diabetes mellitus include type 1 diabetes (T1D), in which β-cells are destroyed by an autoimmune response, and type 2 diabetes (T2D), in which β-cells fail following initial insulin resistance. 1 In both types, loss of β-cell function leads to insufficient insulin secretion and hyperglycemia (chronically high blood glucose). Chronic hyperglycemia can lead to severe macrovascular and microvascular complications. 2
A critical component in the treatment of diabetes and minimization of vascular complications is the ability for patients to accurately and precisely monitor their blood glucose level. Traditionally, this has been done by using a glucometer to measure small blood samples acquired through multiple daily fingersticks. Self-monitored blood glucose (SMBG) is an important tool for the treatment of diabetes especially when therapy includes insulin injections.1-4
Recently, interstitial continuous glucose monitors (CGMs) have begun to replace the traditional SMBG method. The Food and Drug Administration (FDA) approved CGMs for non-adjunctive use in 2016, allowing patients and providers to exclusively use CGMs, without fingerstick confirmation, for treatment decisions.5-8 With SMBG, patients frequently sample four to seven glucose measurements per day which incompletely capture overnight and postprandial glycemic trends.9,10 Conversely, with CGMs a small sensor is inserted under the skin to measure the glucose levels in the interstitial fluid. The major advantage with CGM devices is the ability to record glucose levels every 5 to 15 minutes for 14 days. 11 Continuous glucose monitor usage results in approximately ten times the number of glycemic measurements compared with SMBG; patients using CGMs also improve glycemic control and reduce glycemic variability compared with SMBG monitoring. 12 Although there is a well-known lag between glucose measured by CGM compared with SMBG, many patients and providers are moving toward exclusive us of CGMs for treatment decisions. Studies have shown that CGM readings can lag 4 to 14 minutes behind SMBG; CGM readings can be corrected via an algorithm with variables chosen with a least squares fit.13,14
To further improve glycemic control, there has been a considerable body of work dedicated to mathematical forecasting of the glycemic profile from CGM data. Some of these methods include autoregressive models, deterministic models, support vector machines, and neural networks (NNs).15-18 Notably, NN methods have effectively forecasted glucose behavior 30 minutes into the future19-23 which is relevant to patient care since this time frame permits the patient to take action to avoid hypoglycemia. Equipping patients and providers with automated glycemic forecasting is desirable because it enables more individualized, patient-specific therapy.
While there are numerous methods available for glucose prediction, every algorithm depends on sensor accuracy. Continuous glucose monitors are approved to replace traditional SMBG, yet questions persist regarding accuracy, particularly during hypoglycemia and hyperglycemia.24-27 Factors affecting accuracy include device-tissue motion and forces, patient physiology, calibration, and implantation site physiology, and solutions such as de-noising, sensor delays, and additional calibration have proven successful in reducing error.26,28-34 Enhancing CGM accuracy is critical due to its importance in implementing effective treatment.35,36
Recent work has highlighted sensor location between the left and the right arms as an important factor in CGM accuracy. Continuous glucose monitors on the market are approved for use on either arm, but a 2019 study by Liu et al reported significant differences between CGMs placed on the left and right arms of their participants.8,37 Moving beyond real-time accuracy, our previous work examined CGM sensor agreement between different recommended locations in feedforward (FF) NN glycemic forecasting. In 10 of 13 participants, we observed significant differences in NN prediction performance from NNs trained on the right arm versus the left arm. 38 In this companion article, we examined NNs with gated recurrent units (GRUs) as a method for reducing forecasting error due to sensor location changes. Neural networks with GRUs offer notable benefits over other NN methods since GRUs can capture both long-term and short-term behaviors. By using a reset gate to nullify unimportant short-term information and an update gate to capture behavior of previous states, GRUs are more robust in managing variability. Since GRUs calculate recursively, the network has the effect of remembering performance across every forecast which improves on the long-term performance of FF NNs.39-41 We hypothesize that GRU NNs trained from different manufacturer-approved CGM locations will not experience increases in forecast error (P < .05).
Data Acquisition
This is a secondary data analysis and companion study from a previously published study. 38 Thirteen subjects with T2D not previously using CGMs were eligible for this study. All participants wore one FreeStyle Libre Pro CGM device (Abbott, Alameda, California) on the back of each arm (two sensors per participant) for approximately 15 weeks. Devices were replaced every two weeks and placed per manufacturer’s instructions. Both sensors were blinded, meaning the subjects were unable to view the CGM data throughout the study and only received results after the study. Participants were instructed to continue monitoring their blood sugars and manage their diabetes as per their usual habits. The FreeStyle Libre Pro is one of the CGM systems approved for non-adjunctive, standalone use by the FDA and does not require calibration from fingerstick blood glucose measurements. 8 Other important characteristics of the FreeStyle Libre Pro system include 14-day continuous monitoring, a 15-minute sampling rate,42,43 and the ability to download the raw glucose data and time stamp from the sensor.
All data were collected from individuals participating in a University of Minnesota Institutional Review Board approved study, “Role of CGMS Usage in Predicting Risk of Hypoglycemia” (NCT03481530, ID:STUDY00002113). All participants provided written informed consent before participation. A breakdown of participant characteristics is presented in Table 1.
Characteristics of Individuals Participating in the “Role of CGMS Usage in Predicting Risk of Hypoglycemia” Study.
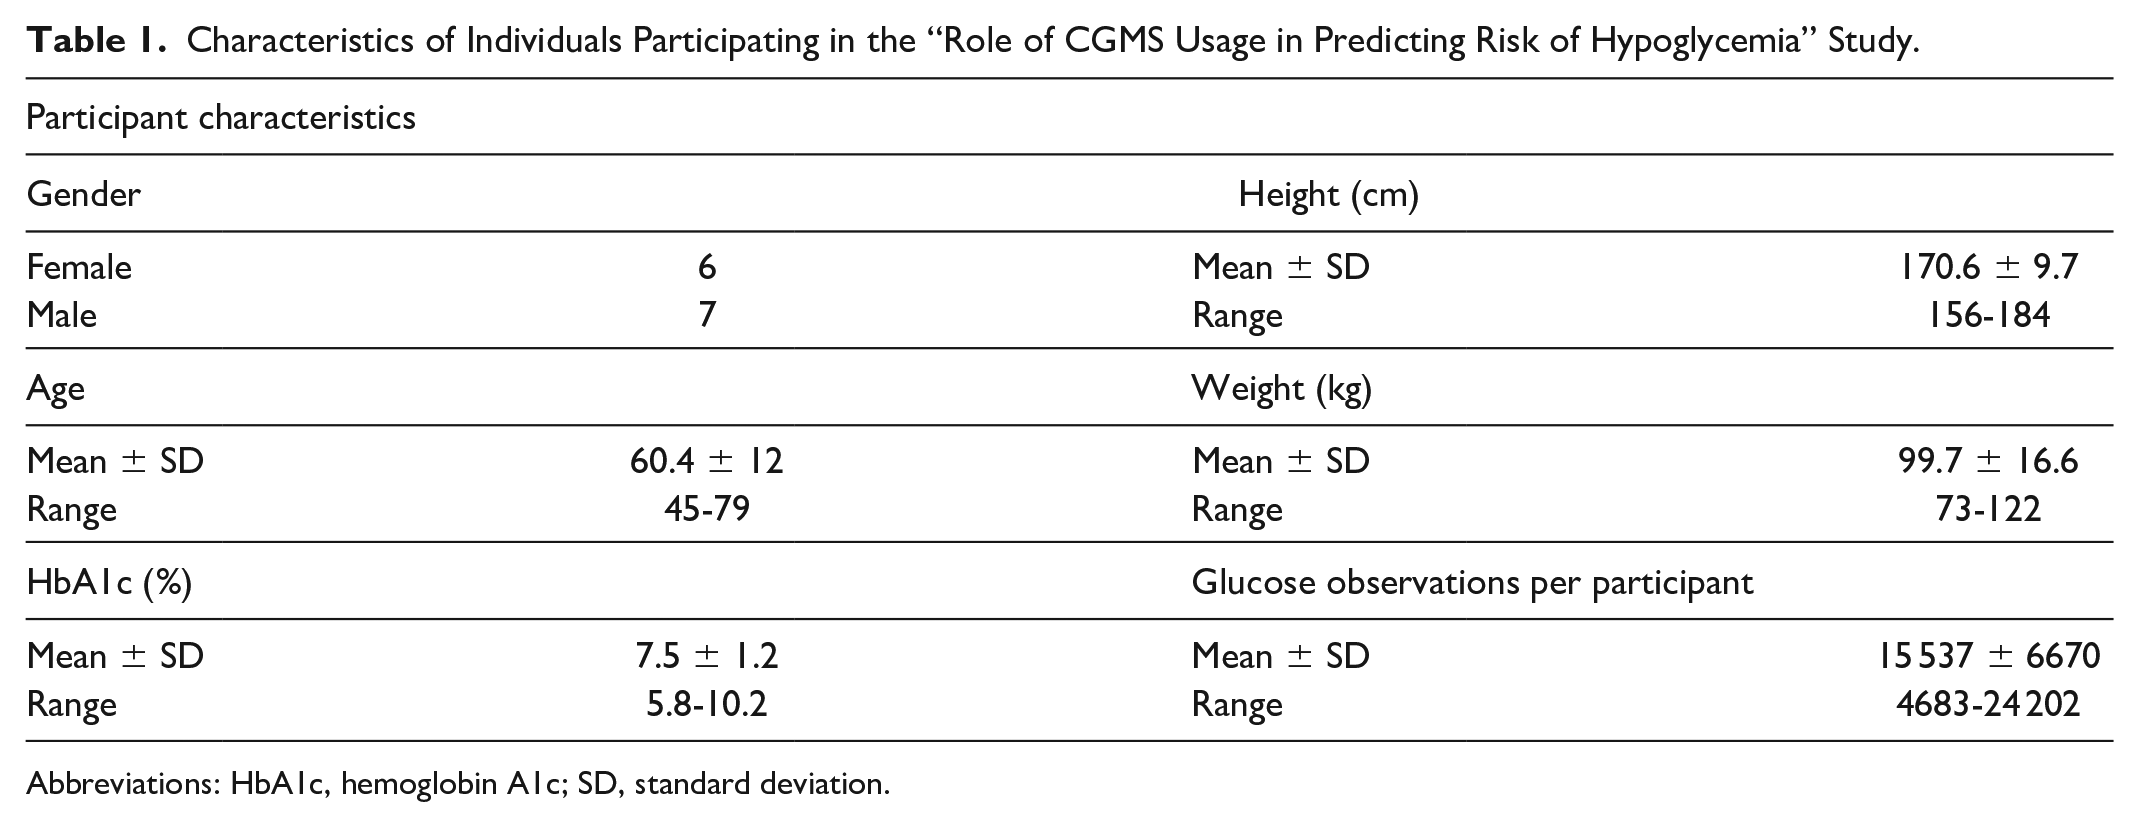
Abbreviations: HbA1c, hemoglobin A1c; SD, standard deviation.
Methods and Materials
Problem Formulation
We previously identified the need to account for CGM location when building algorithms to forecast glucose values. 38 In response, this work aims to reduce NN forecast error due to sensor location. To test this, we isolated sensor location as a testable variable by comparing results between algorithms trained and tested on data from the same arm versus ones trained and tested on data from different arms. This resulted in construction of two groups of two NNs per participant, the left arm group and the right arm group. In the left arm group, an algorithm trained and tested on the left arm (Left-Left) was compared with one trained on the right arm and tested on the left arm (Right-Left). Conversely, in the right arm group an algorithm trained and tested on the right arm (Right-Right) was compared with one trained on the left arm and tested on the right arm (Left-Right). Within each group, the root mean square error (RMSE) was used to evaluate performance due to its use as a common metric in glucose forecasting evaluation (see Figure 1).20,22,44-46
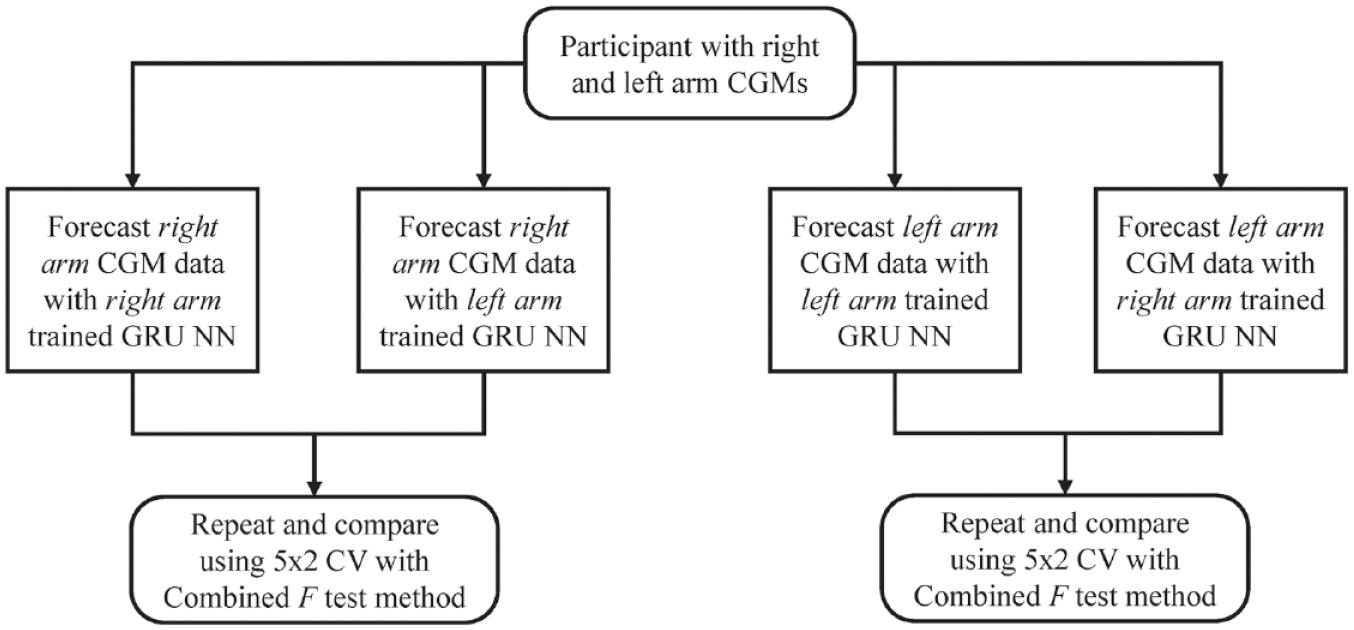
Glucose forecasting algorithms were evaluated with the 5 × 2 CV method by comparing algorithms trained and tested on data from the same arm with algorithms trained on data from the opposite arm. Abbreviations: CGMs, continuous glucose monitors; CV, cross-validation; GRU, gated recurrent unit; NN, neural networks.
General Algorithm Criteria
While the focus of this work is mitigating error from change in sensor location, the algorithmic framework adhered to four general criteria. First, algorithms were formulated to provide clinically acceptable error rates. For scenarios in which forecasts were trained and tested with data from the same arm, our algorithm was structured to provide clinically acceptable accuracy. Second, forecasts were made to be participant specific. We believe that avoiding inter-participant differences is important when isolating sensor location as a testable variable. Third, multiple prediction horizons (PHs) of 15, 30, 45, and 60 minutes were considered for a robust analysis across time. Prediction horizon is defined as the time period between the current time and the forecasted value, and past works have shown larger PHs increase forecast error.20,21 Finally, overlapping data were examined for the purposes of this analysis. In other words, data were only used during time periods in which both sensors were operating correctly.
Feedforward Neural Network
In our companion article, a FF NN with one hidden layer was implemented to forecast glucose values. Inputs,
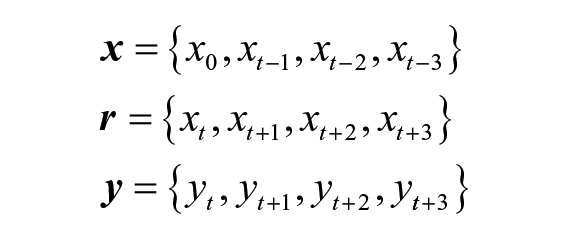
Since the FreeStyle Libre Pro has a sampling rate of 15 minutes, the inputs represented 45 minutes’ worth of glucose data. Data into the NNs were normalized to prevent saturation during training. Standard gradient descent presented by Alpaydin 47 was used for training. For a more detailed explanation, view the companion article Examining Sensor Agreement in Neural Network Blood Glucose Prediction. 38
NN With GRUs
We constructed a NN with GRUs to compare with the results from the time-delay FF NN in the companion study.
38
Gated recurrent units were first proposed in 2014 by Cho et al and have seen increasing use since their inception.40,48 Identical to the FF NN, inputs to the GRU network,
Gated recurrent units offer notable improvements over FF NNs. First, as the model is training, the network retains information about previous model states using a hidden state that is propagated through the network. During training, the NN determines how much information to use from previous model states with an update gate. This is also a feature of other recurrent neural networks. However, a GRU also contains a reset gate which evaluates the usefulness of previous hidden states and can reduce model dependency on unimportant information. Therefore, if a forecast has a strong dependency on short-term behavior, the algorithm will capture that behavior with its reset gate. Conversely, for reliance on long-term behavior, the model will frequently activate the update gate.
48
After each pass through a GRU, the output
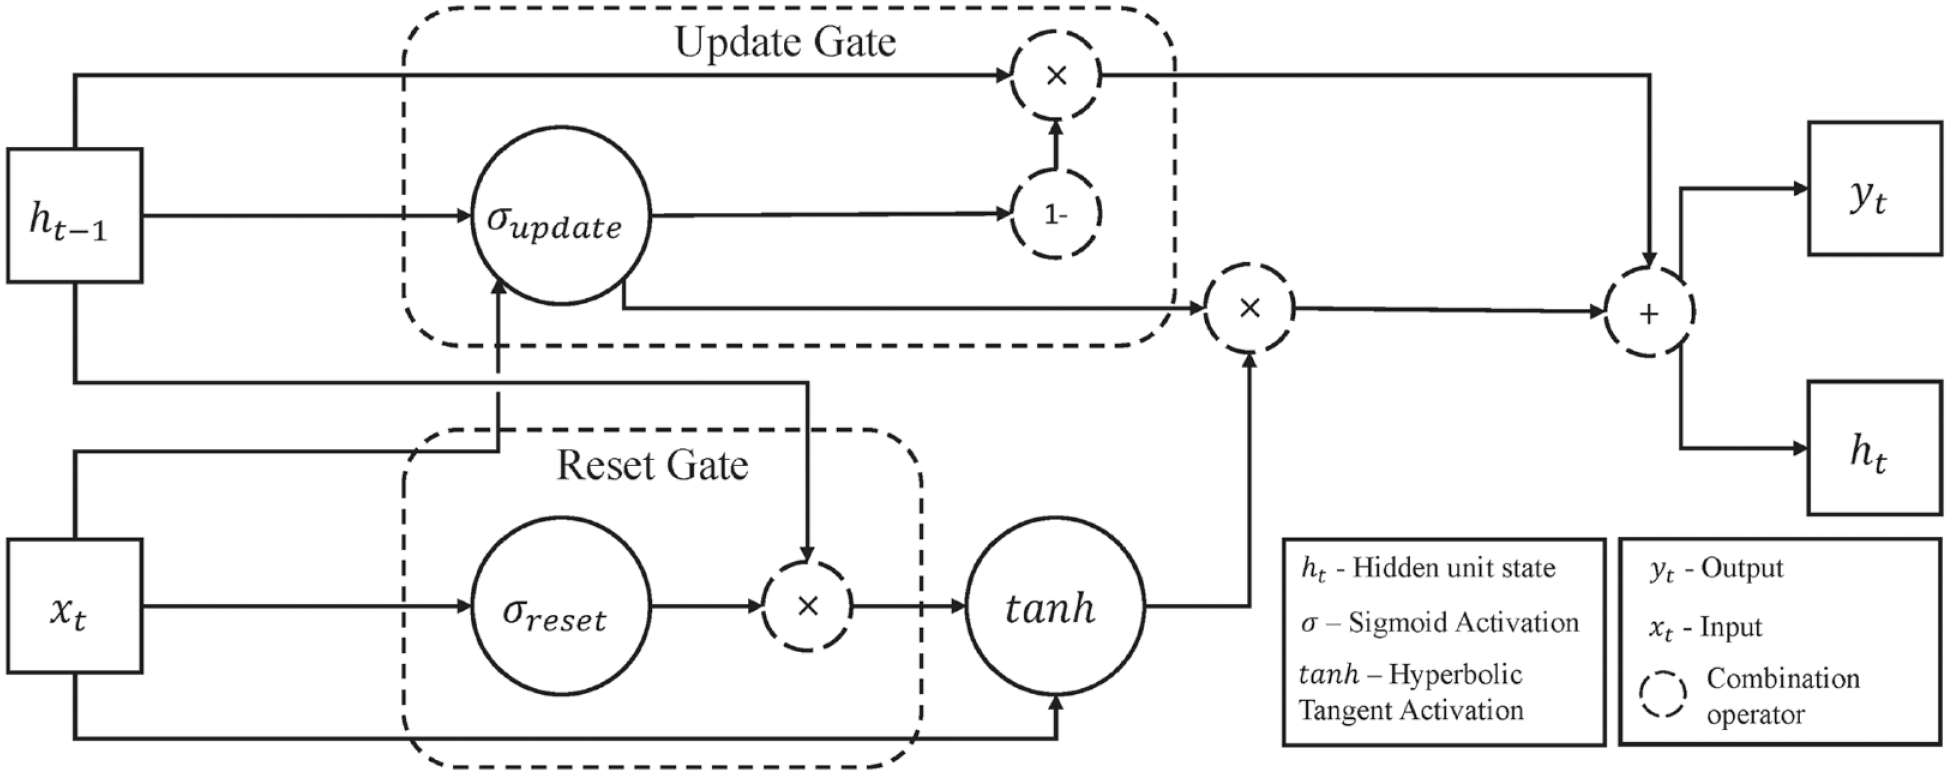
The structure of the gated recurrent unit contains a reset gate and an update gate which combine to capture long-term and short-term behavior.
Algorithm Evaluation
To compare forecast performance, the 5 × 2 cross-validation (5 × 2 CV) method was used. This approach is commonly used to compare algorithms by performing five randomized replications of two-fold cross-validation. Data were split into two random, equal-sized groups: training set and validation set. For each set, five new predictors were trained and validated on the opposite set, leading to ten total predictors and a set of error metrics for Alpaydin’s combined 5 × 2 CV F-test.49,50
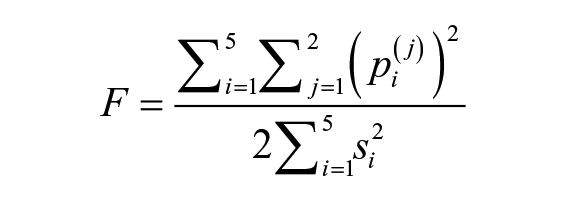
Alpaydin has shown that this representation is F distributed with 10 and 5 degrees of freedom where
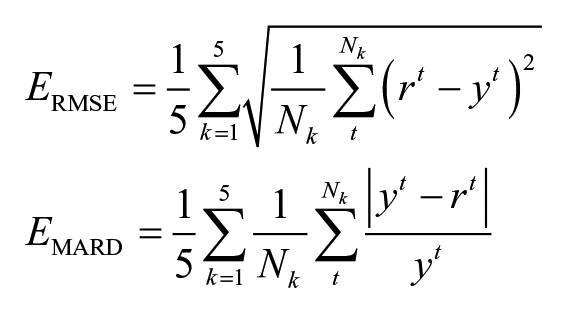
Two metrics were considered when assessing performance. First, the RMSE was used both to assess overall forecast performance and to compare performance within groups using the F-test (eg, performance between Left-Left and Right-Left predictors). Second, the mean absolute relative difference (MARD) was used as another assessment of general predictor performance due to its support in literature.21,23
Results
The data collected for this analysis were used to construct 40 glucose forecasting algorithms per participant, for a total of 520 glucose predictors. For each participant, the RMSE rates from two groups of 20 predictors were compared using 5 × 2 CV to evaluate changes in forecast error rate due to changes in physiological sensor location. Thus, the comparisons of interest are between the Left-Left and Right-Left algorithms as well as the Right-Right and Left-Right algorithms. Figure 3 shows an example forecast of the GRU NN.
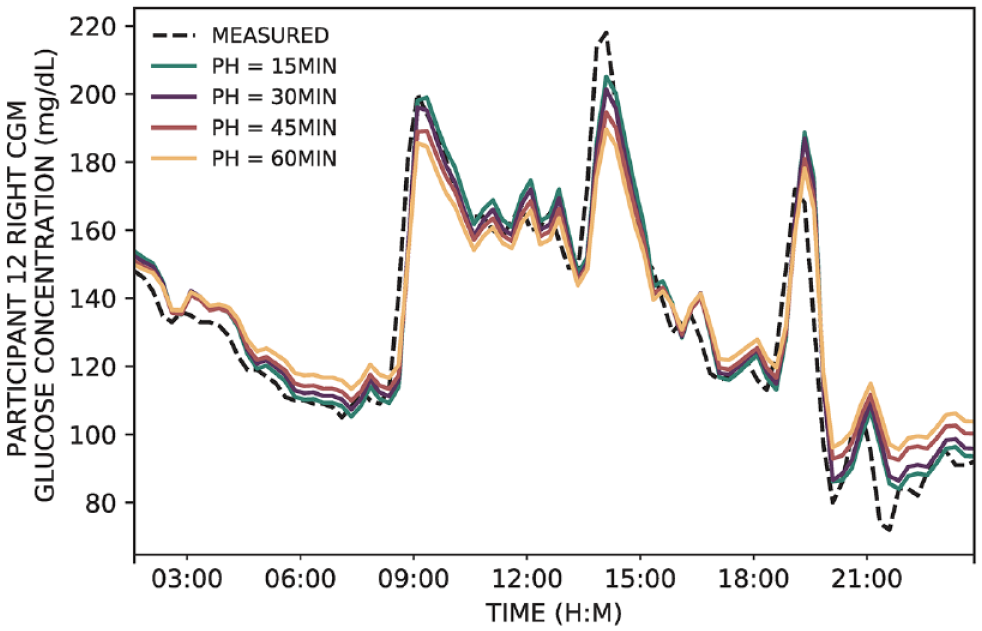
The gated recurrent unit neural networks were able to accurately forecast glucose for a variety of PHs. In this example, a single-day forecast is shown for participant 12. Abbreviations: CGM, continuous glucose monitor; PH, prediction horizon.
Previous results in our companion publication using this methodology for time-delay FF NNs showed significant increases in error for 10 of 13 participants due to CGM location (P < .05). 38 When using the NN with GRUs, we observed no significant differences in error due to changes in sensor location (P < .05). Glycemic standard deviations for each patient are shown in Table 2. Root mean square error values are presented in Table 3, MARD values are shown in Table 4, the comparison between the FF NN is shown in Figure 4, and the results of the GRU NN are shown in Figure 5.
The Glycemic Standard Deviations are the Standard Deviations Across the Entire CGM Data Set per Arm per Participant.
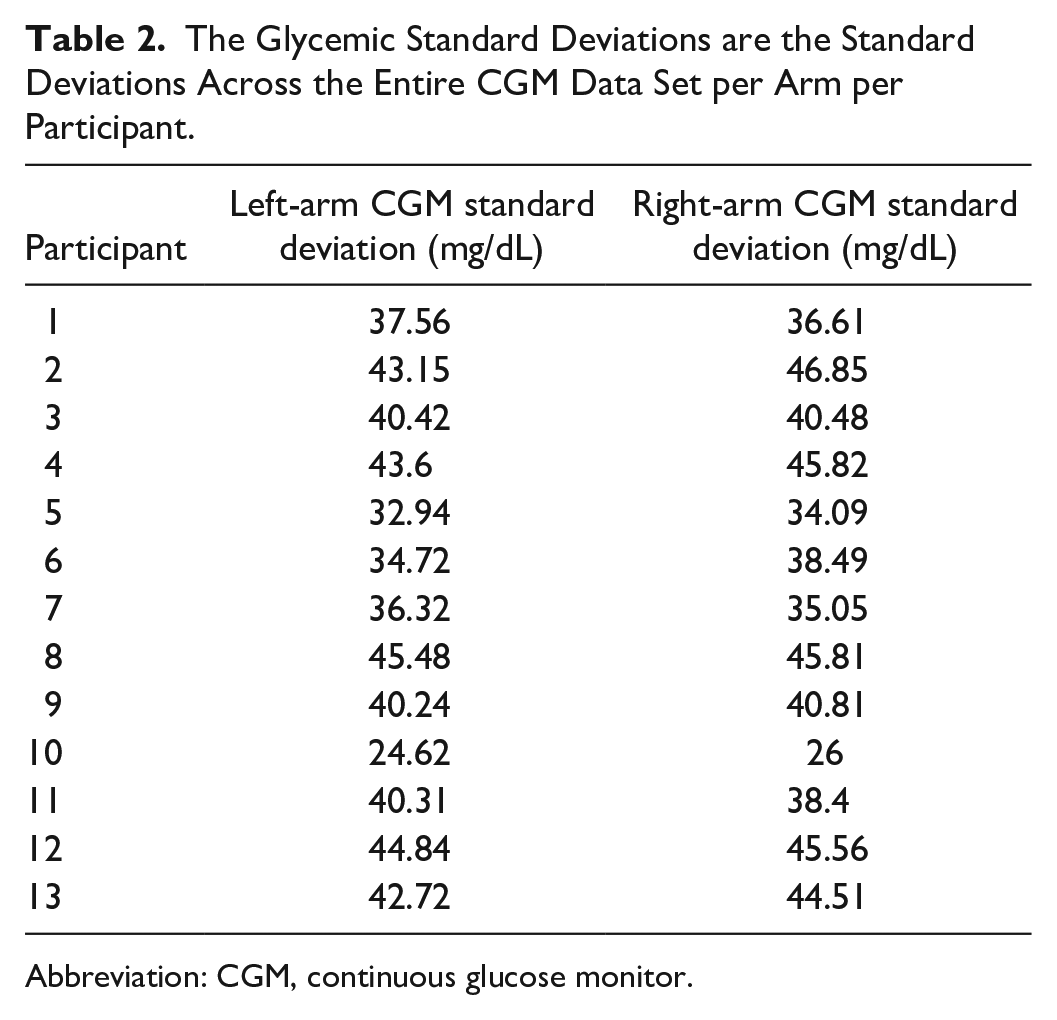
Abbreviation: CGM, continuous glucose monitor.
The RMSE Results from the Algorithm 5 × 2 Cross-Validation Process are Presented with their Standard Deviations. Between Train-Test Pairs, there were No Instances of Significant Increases in Error (P < .05).
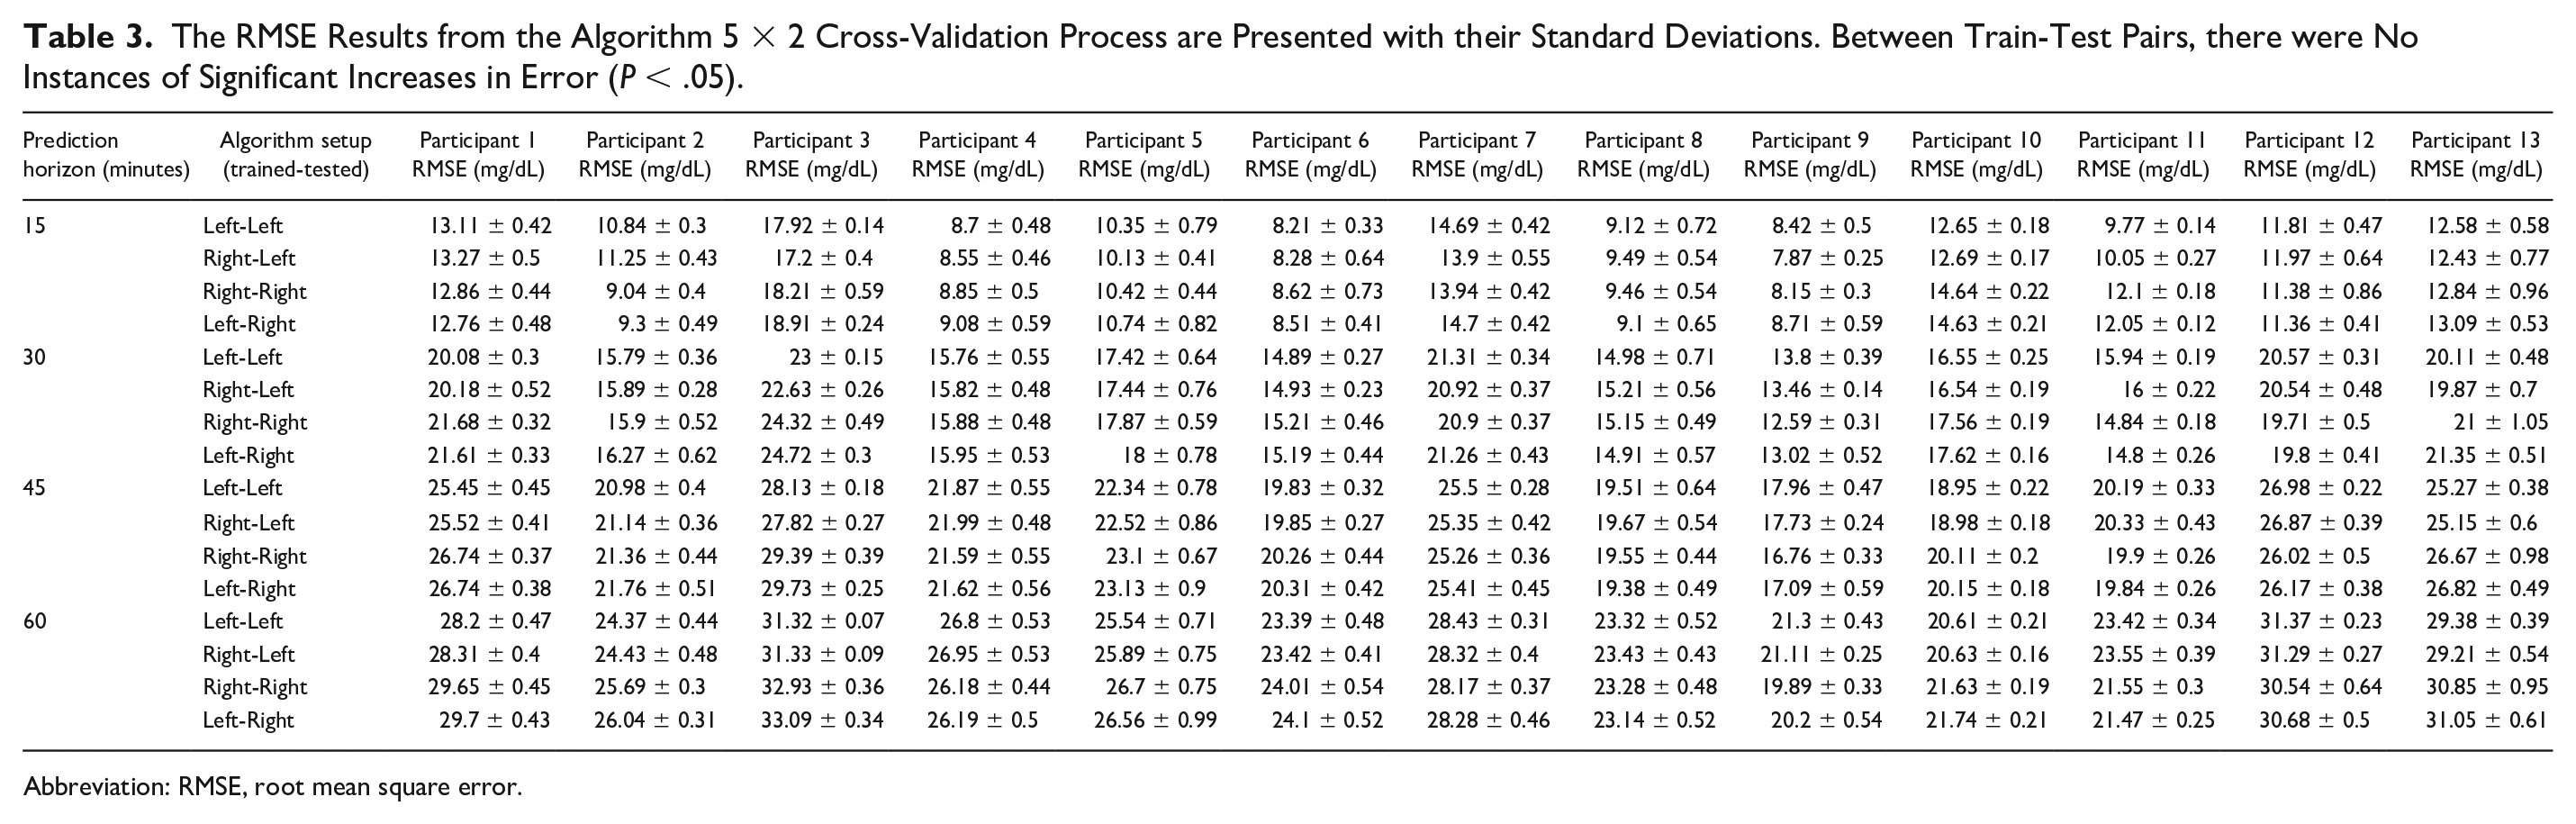
Abbreviation: RMSE, root mean square error.
The MARD was Used to Evaluate Overall Predictor Performance. The Mean and Standard Deviations from the 5 × 2 Cross-Validation Process are Reported. Note that MARD Standard Deviation was Low Across all Prediction Horizons.
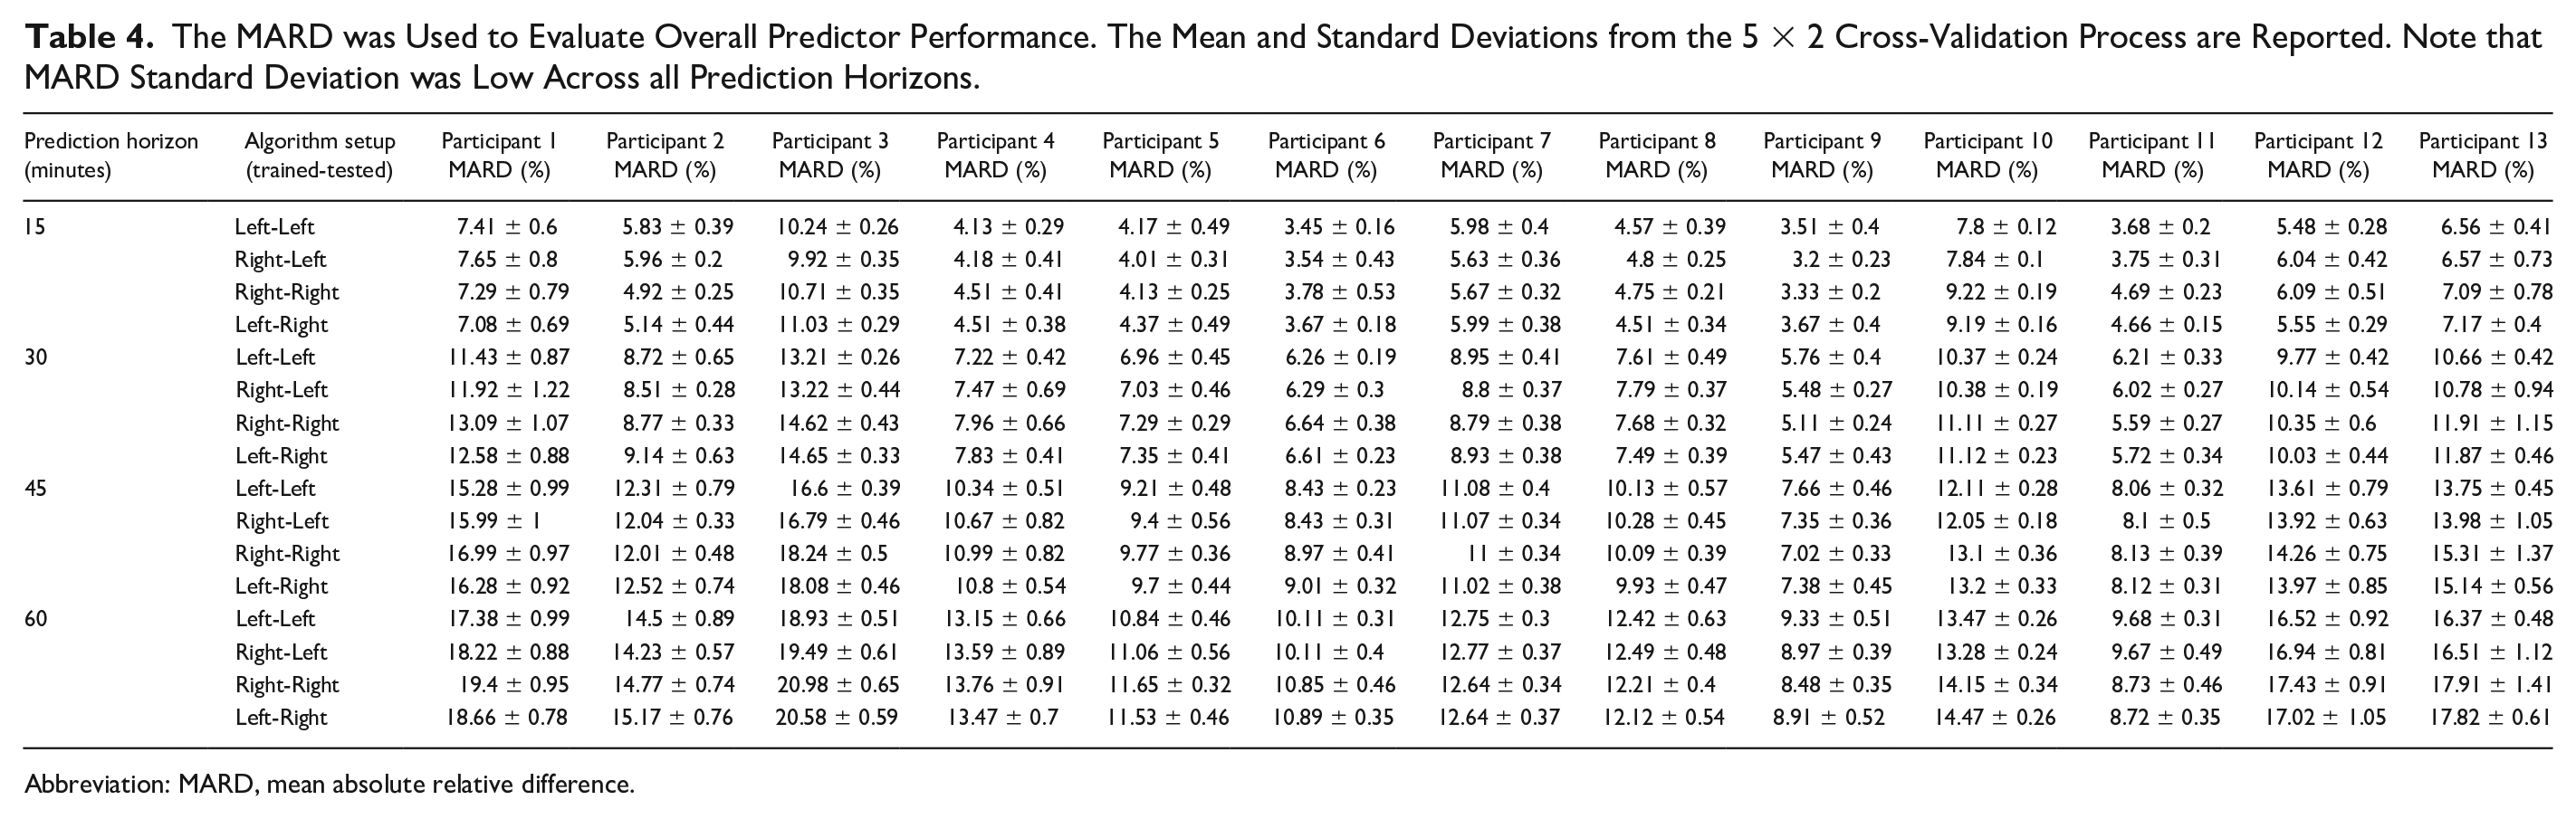
Abbreviation: MARD, mean absolute relative difference.
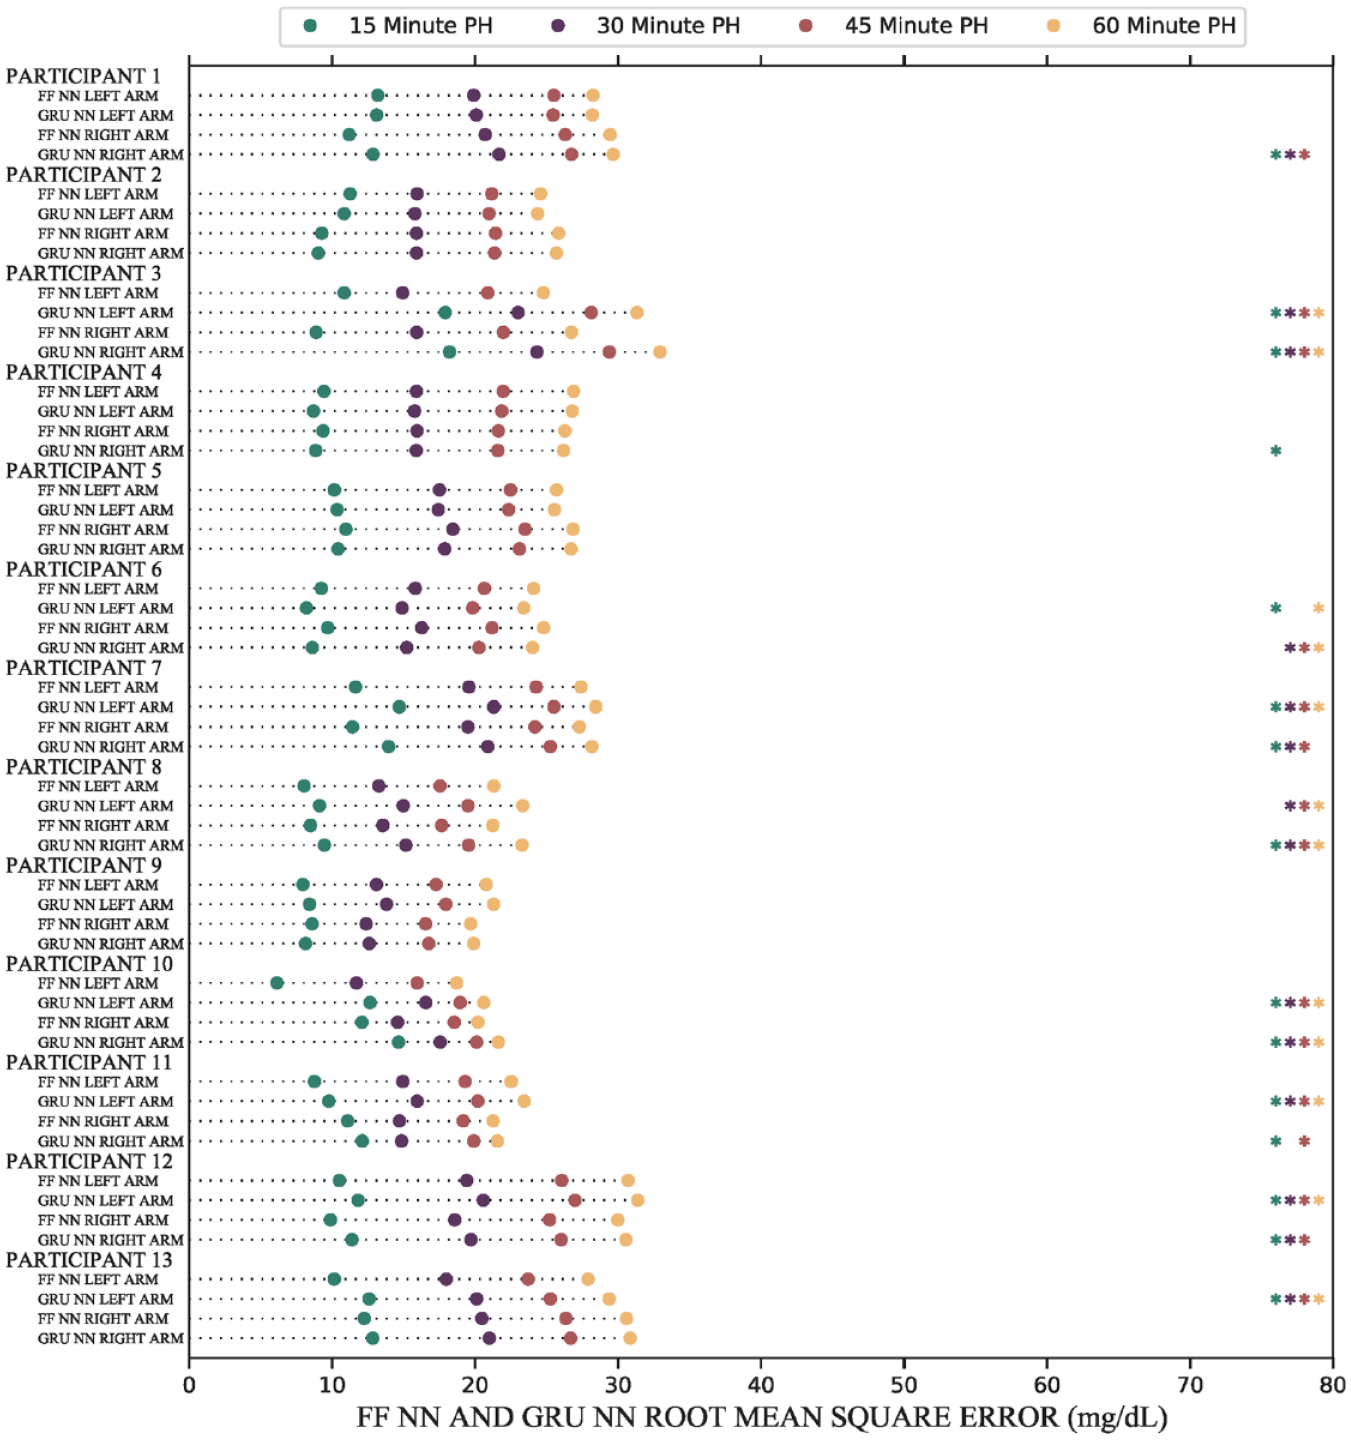
Error rates for the same arm algorithms (eg, Left-Left) between the two NNs were compared. The FF NN and GRU NN produced many significant instances (P < .05) of different forecast root mean square errors. Significant instances are denoted by an asterisk (*) of the same color as the corresponding PH. Abbreviations: FF, feedforward; GRU, gated recurrent unit; NN, neural networks; PH, prediction horizon.
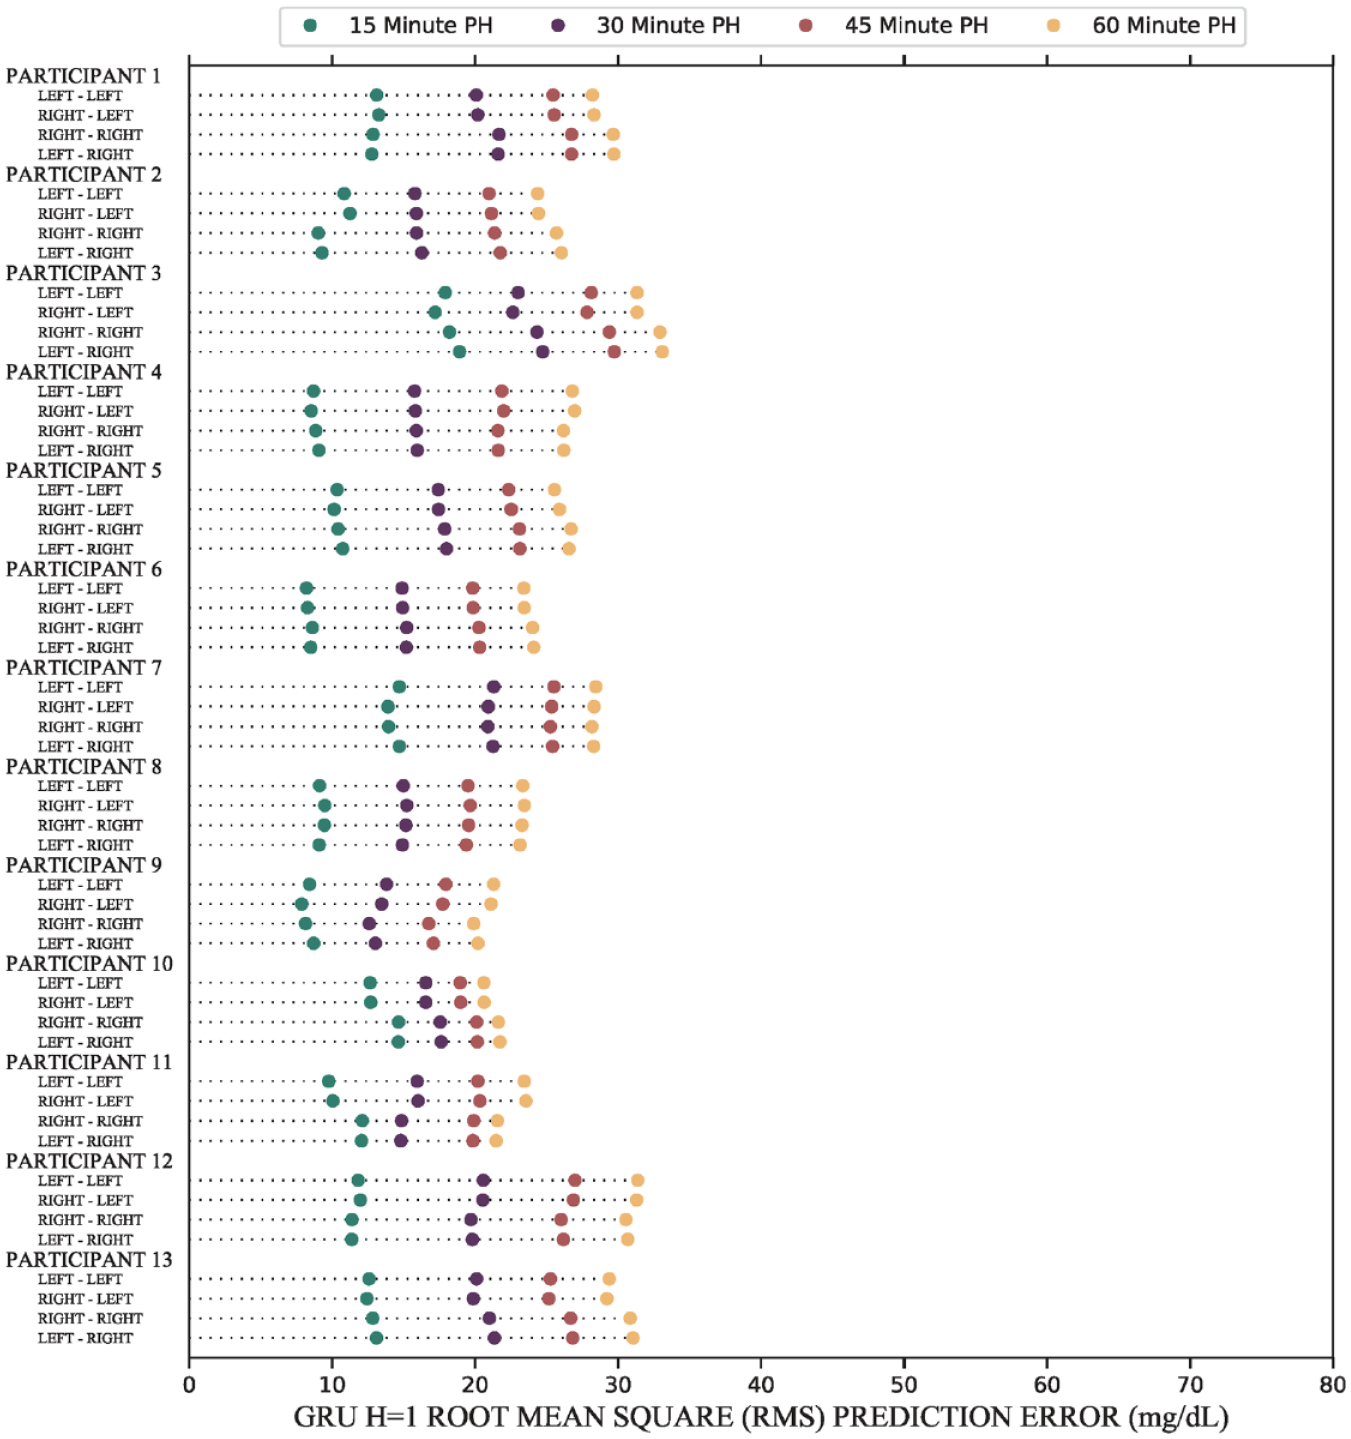
The results of the forecasts show that there are no participants which have significant increases (P < .05) in forecast error due to changes in sensor location, across all PHs. Comparisons in this figure consist of predictors Left-Left versus Right-Left and Right-Right versus Left-Right. Mean and standard deviations are reported in Table 3. Abbreviations: GRU, gated recurrent unit; PH, prediction horizon.
Forecast RMSEs for same arm predictions (ie, Left-Left and Right-Right) were compared with the FF NN from the companion article. For most participants, 10 of 13, the GRU NN and the FF NN produced significantly different forecast RMSEs (P < .05). Of 20 possible comparisons (two for each of the ten with significant differences), the GRU NN produced larger error than the FF NN in 14 instances. The errors for approximately 75% of GRU NN forecasts were within 10% of the forecasts made by the time-delay FF NN while over 90% of GRU NN forecasts were within 20%. These results are shown in Figure 4. All forecast RMSEs for the FF NN are reported in our companion article. 38
These results were independent of differences in variance between training and testing data sets and differences in baseline participant physiological characteristics such as glycemic standard deviation between left and right arm CGMs, age, height, five-year hypoglycemia risk score, 51 blood pressure, fructosamine levels, resting heart rate, and hemoglobin A1c. The standard deviations of the glycemic profile were acquired by measuring the standard deviation across the entire data set per CGM per participant. The glycemic standard deviations are shown in Table 2. We observed no meaningful differences in forecast performance due to overall glycemic standard deviations.
In terms of general performance, we observed low variance between the RMSE and the MARD across forecasting algorithms. Root mean square error values and MARD values are presented in Tables 3 and 4, respectively, and RMSE graphical results are presented in Figure 5.
Training was completed on a Windows 11 desktop machine with an Intel i7-10700 2.9 GHz CPU, 32.0 GB of RAM, and an NVIDIA Quadro M2000 GPU. Average training time for convergence to a data set of 1000 randomly selected glucose inputs was 2.05 seconds for the GRU NN and 0.94 seconds for the FF NN. For 10 000 randomly selected inputs, the average time for the GRU NN was 9.02 seconds compared with 3.16 seconds for the FF NN.
Discussion
In this work, we made the novel observation that GRU NNs can mitigate forecast error due to changes in CGM location. Our previous work identified that CGM location is important when forecasting glucose values using NN methods. 38 While participant-specific time-delay FF NNs can accurately forecast values for algorithms trained and tested on the same arm, they remain inadequate when the sensor data are acquired from a different location. We believe that GRUs are particularly helpful due to their ability to capture both long-term and short-term dependencies. Furthermore, these algorithms perform comparably to the time-delay FF NNs from our previous work. Approximately, 75% of forecasts with the GRU NN were within 10% of the error of the time-delay FF NN, and over 90% of forecasts were within 20%.
From a clinical perspective, this observation suggests that glucose prediction with NN methods would be much better served by using networks with GRUs. While time-delay FF NNs can capture behavior using data solely from one arm, GRU NNs are clearly better at mitigating error due to sensor location changes.
We believe this study has numerous strengths. First, we examined a population with T2D and a diverse range of five-year risk for hypoglycemia. With the use of two sensors and 15 weeks of data collection per participant, we analyzed an abundant, varied data set. Furthermore, we utilized the same testing procedure as in our previous work identifying sensor location error, which strengthens the significance of our results. In addition, we completed our analysis without any use of synthetic data.
We also identified several weaknesses. First, by using GRU NNs, the training time for each forecasting algorithm increased markedly. On average, the time to convergence for randomly selected inputs was two to three times longer for the GRU NN compared with the FF NN. On a larger data set, performing these calculations would be time consuming and computationally intensive. It is likely that specialized hardware would be needed to reduce calculation time. Differences were observed for error rates for same arm predictions (ie, Left-Left and Right-Right) between the GRU NN and the FF NN. In most (but not all) cases, the GRU yielded higher forecast error than the FF NN which provides users with a tradeoff between same arm error and mitigation of error due to CGM location changes. In addition, we did not get the opportunity to test other CGM systems, and we do not know how these results will apply to other CGM devices. Participants also placed CGMs on manufacturer-approved locations only, meaning that the effects of CGM on other body locations are unknown. Furthermore, these forecasting algorithms were only tested on individuals with T2D, we do not know whether these results will be replicated in individuals with T1D.
Finally, participant-specific forecasts likely improved forecast error overall. While participant-specific forecasts were a requirement for isolating sensor location as a testable variable, we recognize that this was a limitation of this study since our methods were not exposed to additional glycemic variance resulting from forecasting with multiple participant data sets.
Conclusion
Accurate and precise glucose forecasting continues to be a long-term goal for diabetes therapy, and we believe that GRU NNs can significantly reduce error due to changes in CGM location. Furthermore, we believe clinicians and researchers should prioritize the effects of sensor location on their predictions. We strongly believe that any prediction method should account for both long-term and short-term dependencies, and we believe the error robustness of GRU NNs merits further investigation for glucose forecasting.
Footnotes
Abbreviations
AHC, Academic Health Center; CGM, continuous glucose monitor; FDA, Food and Drug Administration; HbA1c, hemoglobin A1c; NIH, National Institutes of Health; NN, neural network; FF, feedforward; GRU, gated recurrent unit; MARD, mean absolute relative difference; PH, prediction horizon; RMSE, root mean square error; SMBG, self-monitored blood glucose; T1D, type 1 diabetes; T2D, type 2 diabetes; 5 × 2 CV, 5 × 2 cross-validation.
Declaration of Conflicting Interests
The author(s) declared no potential conflicts of interest with respect to the research, authorship, and/or publication of this article
Funding
The author(s) disclosed receipt of the following financial support for the research, authorship, and/or publication of this article: This work was funded by the National Institutes of Health National Center for Advancing Translational Sciences (UL1TR002494) and the University of Minnesota Academic Health Center (ACH-FRD-17-08 to L.S.C.). The content is solely the responsibility of the authors and does not necessarily represent the official views of the National Institutes of Health’s National Center for Advancing Translational Sciences.