
Abstract
Background:
In type 1 diabetes (T1D) management, short-term glucose prediction can allow to anticipate therapeutic decisions when hypo/hyperglycemia is imminent. Literature prediction methods mainly use past continuous glucose monitoring (CGM) readings. Sophisticated algorithms can use information on insulin delivered and meal carbohydrate (CHO) content. The quantification of how much insulin and CHO information improves glucose prediction is missing in the literature and is investigated, in an open-loop setting, in this proof-of-concept study.
Methods:
We adopted a versatile literature prediction methodology able to utilize a variety of inputs. We compared predictors that use (1) CGM; (2) CGM and insulin; (3) CGM and CHO; and (4) CGM, insulin, and CHO. Data of 15 T1D subjects in open-loop setup were used. Prediction was evaluated via absolute error and temporal gain focusing on meal/night periods. The relative importance of each individual input of the predictor was evaluated with a sensitivity analysis.
Results:
For a prediction horizon (PH) ≥ 30 minutes, insulin and CHO information improves prediction accuracy of 10% and double the temporal gain during the 2 hours following the meal. During the night the 4 methods did not give statistically different results. When PH ≥ 45 minutes, the influence of CHO information on prediction is 5-fold that of insulin.
Conclusions:
In an open-loop setting, with PH ≥ 30 minutes, information on CHO and insulin improves short-term glucose prediction in the 2-hour time window following a meal, but not during the night. CHO information improves prediction significantly more than insulin.
Keywords
In the past 15 years the development, commercialization and adoption into clinical practice of portable continuous glucose monitoring (CGM) sensors opened new scenarios and opportunities for type 1 diabetes (T1D) therapy. The quasi continuous nature of the signal allows the use of prediction algorithms. Prediction could allow the patient to take therapeutic decisions on the basis of future instead of current glycemia, possibly mitigating/avoiding imminent critical events.1-4
Since the introduction of CGM devices, various methods have been proposed for short-term prediction of glucose concentration with prediction horizon typically no longer than 45 minutes. Prediction methods exploit dynamic models and the majority of them use as input only the past history of the CGM signal.5-10 Glucose dynamics are influenced by many factors, including quantity of ingested carbohydrates (CHO), delivered insulin, physical activity, stress, emotions, and inter- or intraindividual variability. Accounting for these inputs in the prediction of glucose concentration is difficult and requires formalization in mathematical terms and use of advanced models and algorithms. Published short-term glucose prediction models that use additional inputs include
- autoregressive with exogenous input models exploiting information on CHO and insulin therapy11,12
- autoregressive with moving average with exogenous inputs models accounting for food intake, physical activity, emotional stimuli, and lifestyle; 13 physical activity and insulin on board information; 14 and insulin and CHO information 15
- latent variable-based predictors 16
- random forests, support vector-based algorithms, and Gaussian processes using a variety of inputs, such as glucose history, time of the day, plasma insulin concentration, effect of food intake, and energy expenditure17-19
- neural networks using insulin and CHO information; 15 self-monitoring of blood glucose (SMBG) readings; information on insulin, CHO, and hypo- and hyperglycemic symptoms; lifestyle, activity, and emotions; 20 and information on CHO only21,22
None of these studies systematically evaluated how much each individual input can improve the prediction of glucose concentration.
The aim of this work is to assess the improvement in short-term prediction accuracy when information on delivered insulin and amount of ingested CHO is added to CGM as inputs of a glucose predictor. Data of 15 T1D subjects monitored in an open-loop setup with the Dexcom Seven Plus CGM sensor are used. Detailed information on ingested CHO and delivered insulin are available in the data set. In our analysis we investigate prediction horizon of 15, 30, 45, and 60 minutes, and we compare 4 glucose predictors with different input combinations: (1) CGM; (2) CGM and insulin; (3) CGM and CHO; and (4) CGM, insulin, and CHO. Prediction is assessed in terms of absolute error (separating meal and nighttime periods) and temporal gain of prediction. The relative importance of each individual input of the predictor is analyzed and inputs are ranked with a sensitivity analysis.
Methods
The Prediction Method
The present work is meant to be a proof-of-concept study. Analyses are performed with the most flexible prediction model we are familiar with: a neural network (NN)–based algorithm that allows to easily incorporate information relative to exogenous inputs. 22 While for a thorough description of the algorithm and NN model we have to refer the reader to Zecchin et al, 22 some key aspects are briefly summarized in the following and in the appendix. The predictor is based on a jump NN, that is, a feed-forward NN with inputs directly connected to both the first hidden layer and the output layer. In this article we consider 4 versions of the NN predictors in which the only difference is the number and type of inputs used: (1) Pred(CGM) fed by CGM data only; (2) Pred(CGM+I) fed by CGM and insulin; (3) Pred(CGM+CHO) fed by CGM and CHO; (4) and Pred(CGM+I+CHO) fed by CGM, insulin, and CHO. All 4 NN predictors exploit the information on CGM history, which consists specifically of 2 inputs: the sensor data and their first-order time derivative. Pred(CGM+I) has 3 inputs because it also uses the information on injected insulin during the meal, which is preprocessed by calculating the area under the curve (between the current time instant t and t+PH) of the rate of appearance of insulin (RaI) in blood with the model developed in Dalla Man et al: 23
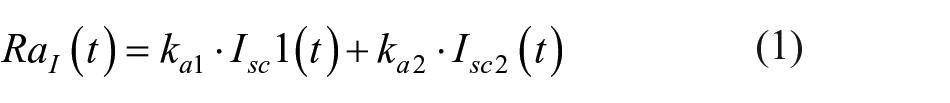
where Isc1 is the amount of nonmonomeric insulin in the subcutaneous space, Isc2 is the amount of monomeric insulin in the subcutaneous space, ka1 is the rate constant of nonmonomeric insulin absorption, and ka2 is the rate constant of monomeric insulin absorption. Model details and population parameters can be found in Dalla Man et al. 24 Note that the area under the curve of RaI is here delayed by 60 minutes to account for physiological delays in insulin absorption and action. 25 Pred(CGM+CHO) also has 3 inputs: the sensor data and its first-order time derivative, and the information on the quantity of CHO assumed during the meal, which is preprocessed by calculating area under the curve (between the current time instant t and t+PH) of the rate of appearance of CHO (RaG) in blood with the model developed in Dalla Man et al: 23
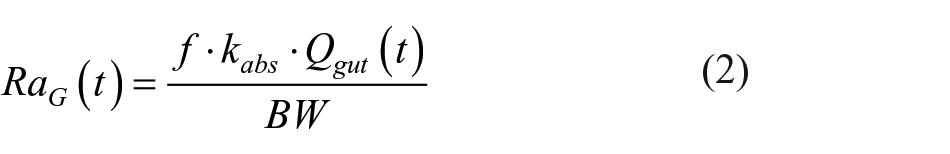
where f is the fraction of ingested glucose which actually appears in plasma, BW is the body weight, kabs is the rate constant of intestinal absorption, and Qgut is the glucose mass in the intestine. Model details and population parameters can be found in Dalla Man et al.23,26 Finally, Pred(CGM+I+CHO) is fed by all 4 the inputs previously described. Robustness of the methodology against errors in meal timing and size estimates was shown in Zecchin et al. 21
Assessment of Prediction Sensitivity to Inputs
A sensitivity analysis was used to quantify the relative value of each input in determining the predicted glucose. Sensitivity was computed using the partial derivative (PaD) method.27,28 This method starts by computing, analytically, the PaD of the prediction with respect to each input
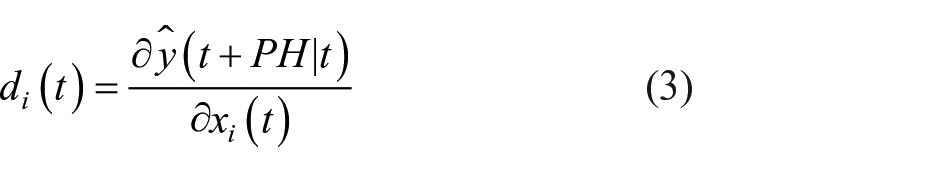
with
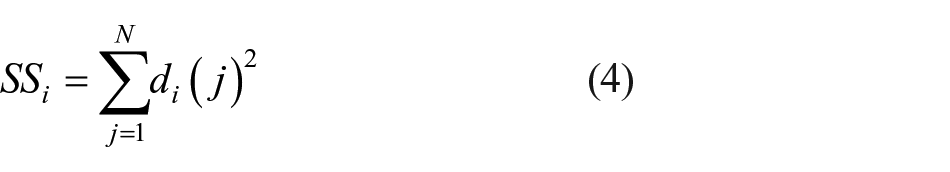
with N length of the time series. The relative contribution of each input variable, with respect to the other inputs, is obtained as:
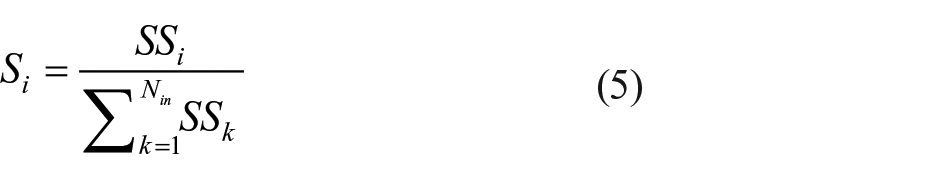
The variable with the highest Si has the greatest effect on the output. Si allows to rank the relative influence of each input on the output, with respect to the other input signals and changes in this influence, when different PH are considered, can also be quantified.
Metrics of Predictor Assessment
Predicted glucose profiles obtained with the 4 considered models are evaluated with 2 commonly used metrics to assess accuracy and time anticipation of the predicted time series with respect to the target signal.
1. The mean absolute error (MAE [mg/dl]) between target and predicted time series
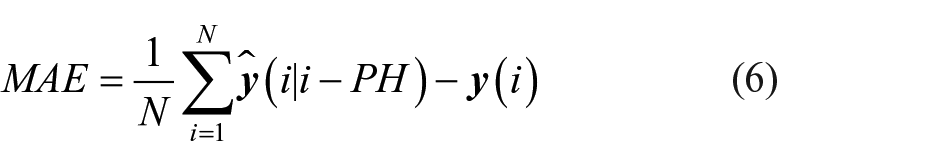
where N is the length of the time series,
2. The average normalized temporal gain (TG [adim])
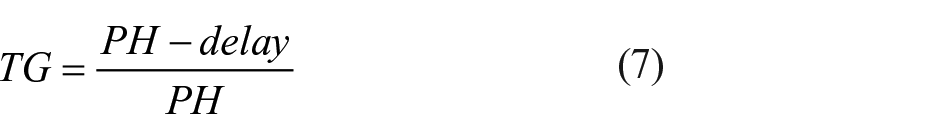
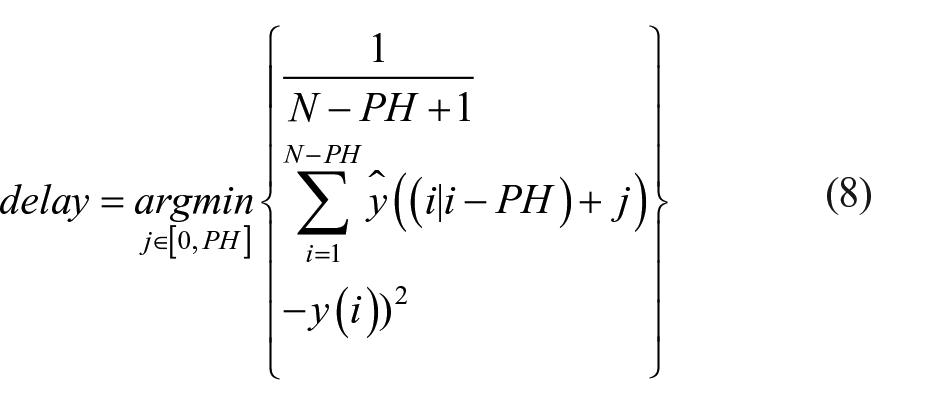
with the delay quantified as the temporal shift minimizing the square of the L2 distance between prediction and target, as in Gani et al 29 and in Facchinetti et al 30
TG is an easy to compute index. It quantifies the average anticipation with which events could be, in theory, detected and, thus, can have a clinical value.
Database
Data were collected during the European Project DIAdvisor, funded under the 7th Framework Programme. Data consist of CGM monitoring for 3 consecutive real-life days of 15 T1D patients in open-loop setup. CGM was measured by the Dexcom Seven Plus CGM sensor (Dexcom Inc, San Diego, CA), which has a sampling period of 5 minutes. Information on dose of insulin injections and CHO content of meals was manually recorded by the patients.
The data set was divided into training plus validation set (including the first day of monitoring of every subject) and test set (containing the following 2 days of monitoring of every subject). The training and validation set was further randomly divided into the training set (containing 70% of the data) and the validation set (formed by the remaining 30% of the data).
Results
Assessment of the Entire Time Window
Figure 1 shows glucose concentration during a 7-hour time window in a representative subject together with prediction obtained by the 4 predictors for PH = 30 minutes (upper panel) and PH = 60 minutes (bottom panel). The black line is the target signal measured by the CGM sensor, the gray line is the prediction obtained using Pred(CGM), the green line is the prediction obtained using Pred(CGM+I), the blue line is the prediction obtained using Pred(CGM+CHO), and the red line is the prediction obtained using Pred(CGM+I+CHO). The green and red stems represent, respectively, insulin injection and CHO ingestion. Note that the predicted signals are plotted at the time instant to which they refer, that is, the value plotted at a certain time is obtained PH minutes earlier, using only data available until PH minutes earlier.
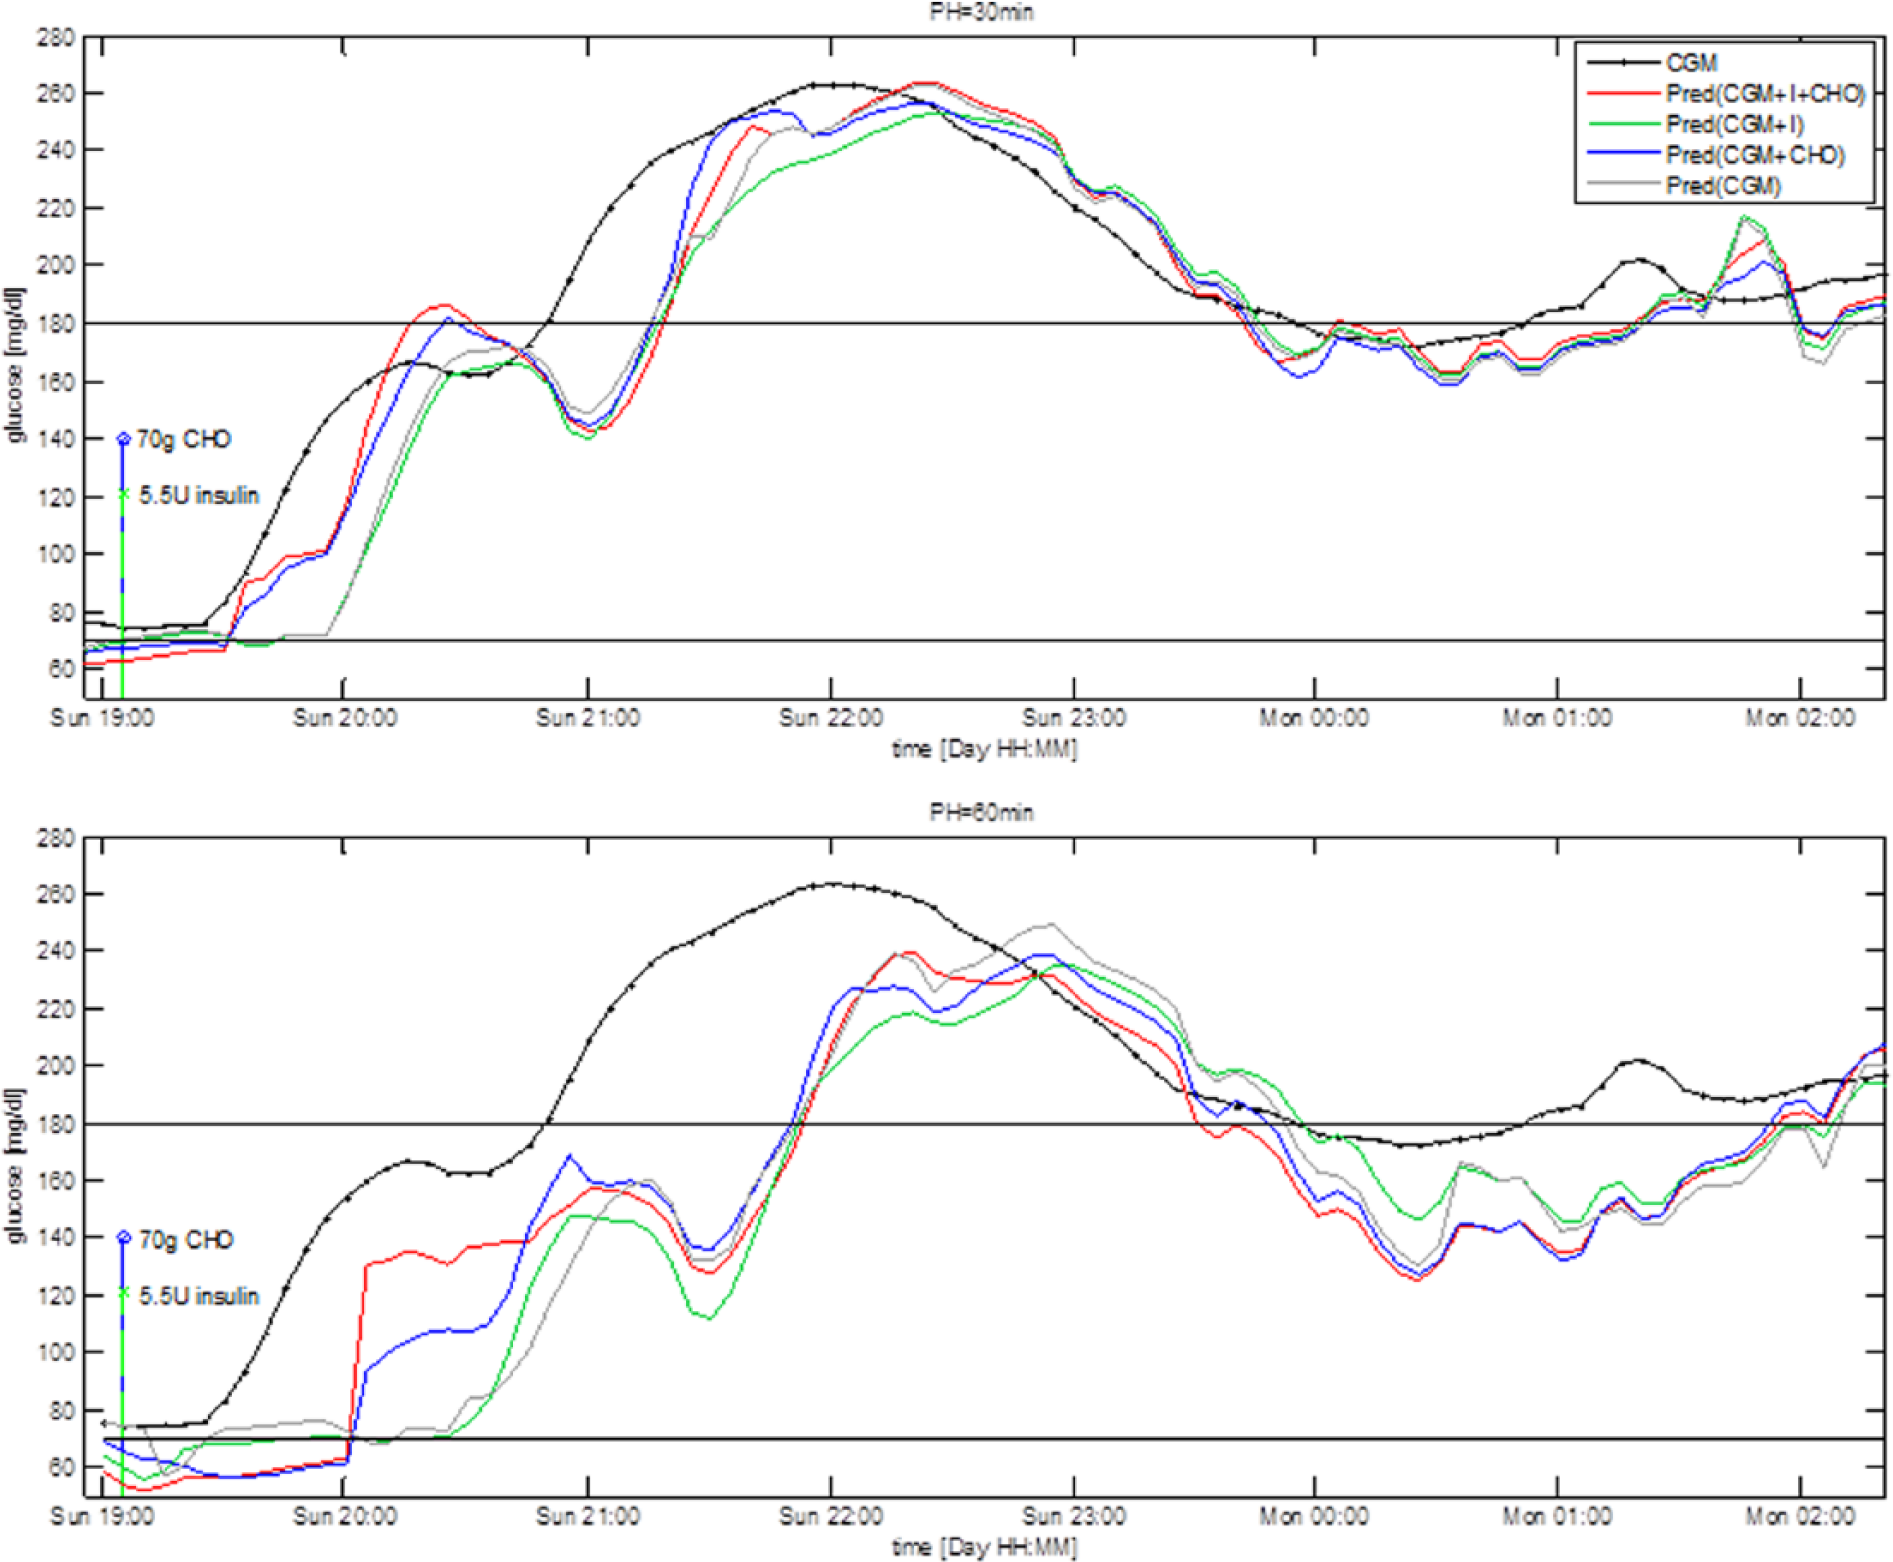
Representative CGM profile (black) and prediction obtained with the 4 predictors for PH = 30 minutes (upper panel) and PH = 60 minutes (bottom panel).
The addition to CGM of inputs relative to CHO and insulin (red line) or CHO only (blue line) visually improves the prediction over the 2 hours following meal and insulin injection. In the time window 19:00-21:00 Pred(CGM+I+CHO) and Pred(CGM+CHO) forecast with a minimum delay the upward trend following the meal, while Pred(CGM+I) and Pred(CGM) have a delay almost comparable to PH. In the rest of the 4 predictions almost coincide. Numerical results computed on the entire test time series, (not reported for the sake of space), show no significant differences among the 4 predictors. This is reasonable since ingestion of CHO and injection of insulin largely influence glucose time course mostly during the 2 hours following these events. Therefore, we expect information relative to insulin injection and/or CHO ingestion to improve prediction only during those time intervals, which constitute approximately 25% of the test time series, considering 3 meals and relative insulin boluses per day. In the following paragraphs we assess the 4 predictors separately on the 2-hour time window following CHO ingestion and insulin injection, and during the night.
Assessment on Meal and Nighttime Windows
Figure 2 shows a representative test time series and the prediction obtained with the compared models during the 2 hours following the ingestion of CHO and the injection of insulin (left column) and during the night (ie, from 11
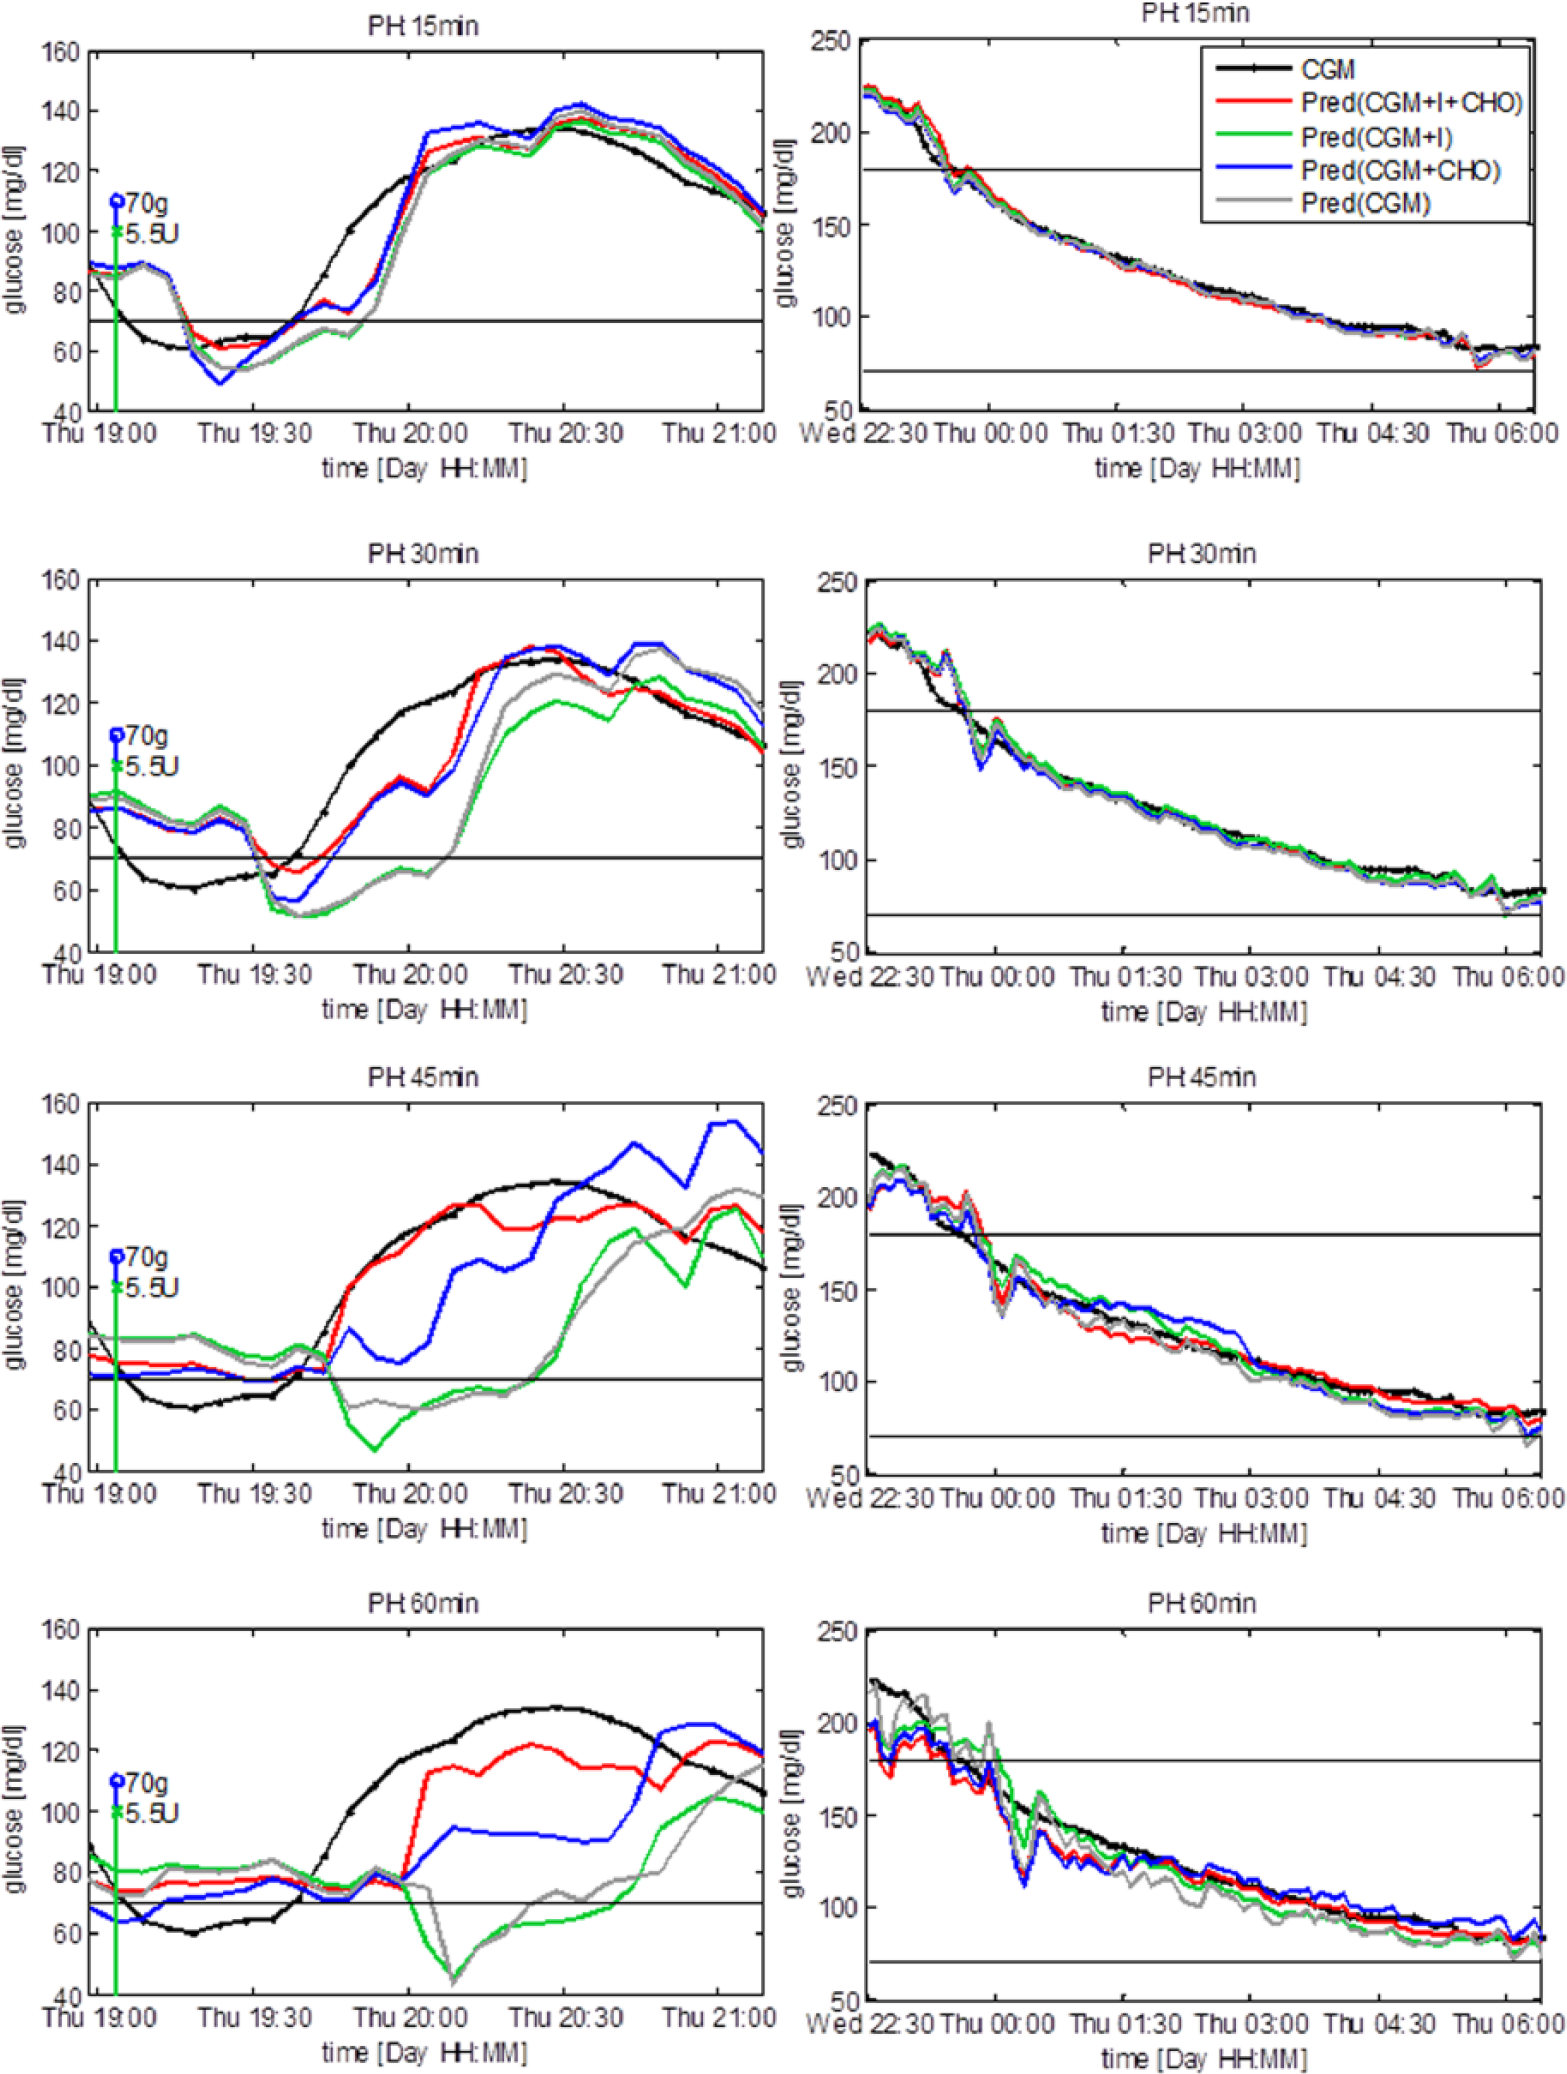
Representative subject. Prediction after meal and insulin injection (left column) and during the night (right column). Vertical stems represent injection of insulin (green) and ingestion of CHO (blue). The predicted signals are plotted at the time instant to which they refer.
Figure 3 summarizes with box plots the performance of the 4 algorithms in terms of MAE and normalized TG during the 2-hour time window following ingestion of CHO and injection of insulin and during the night. The lower the MAE and the closer to 1 the normalized TG, the better the prediction. In the 2-hour window following CHO ingestion and insulin injection, with PH greater than 15 minutes Pred(CGM+I+CHO) and Pred(CGM+CHO) have a MAE visibly lower than the other models (top left panel). The TG is visibly higher for Pred(CGM+I+CHO) and for Pred(CGM+CHO), compared to Pred(CGM+I) and Pred(CGM) (bottom left panel). During the night differences are not so evident and the 4 models have similar MAE and TG values.
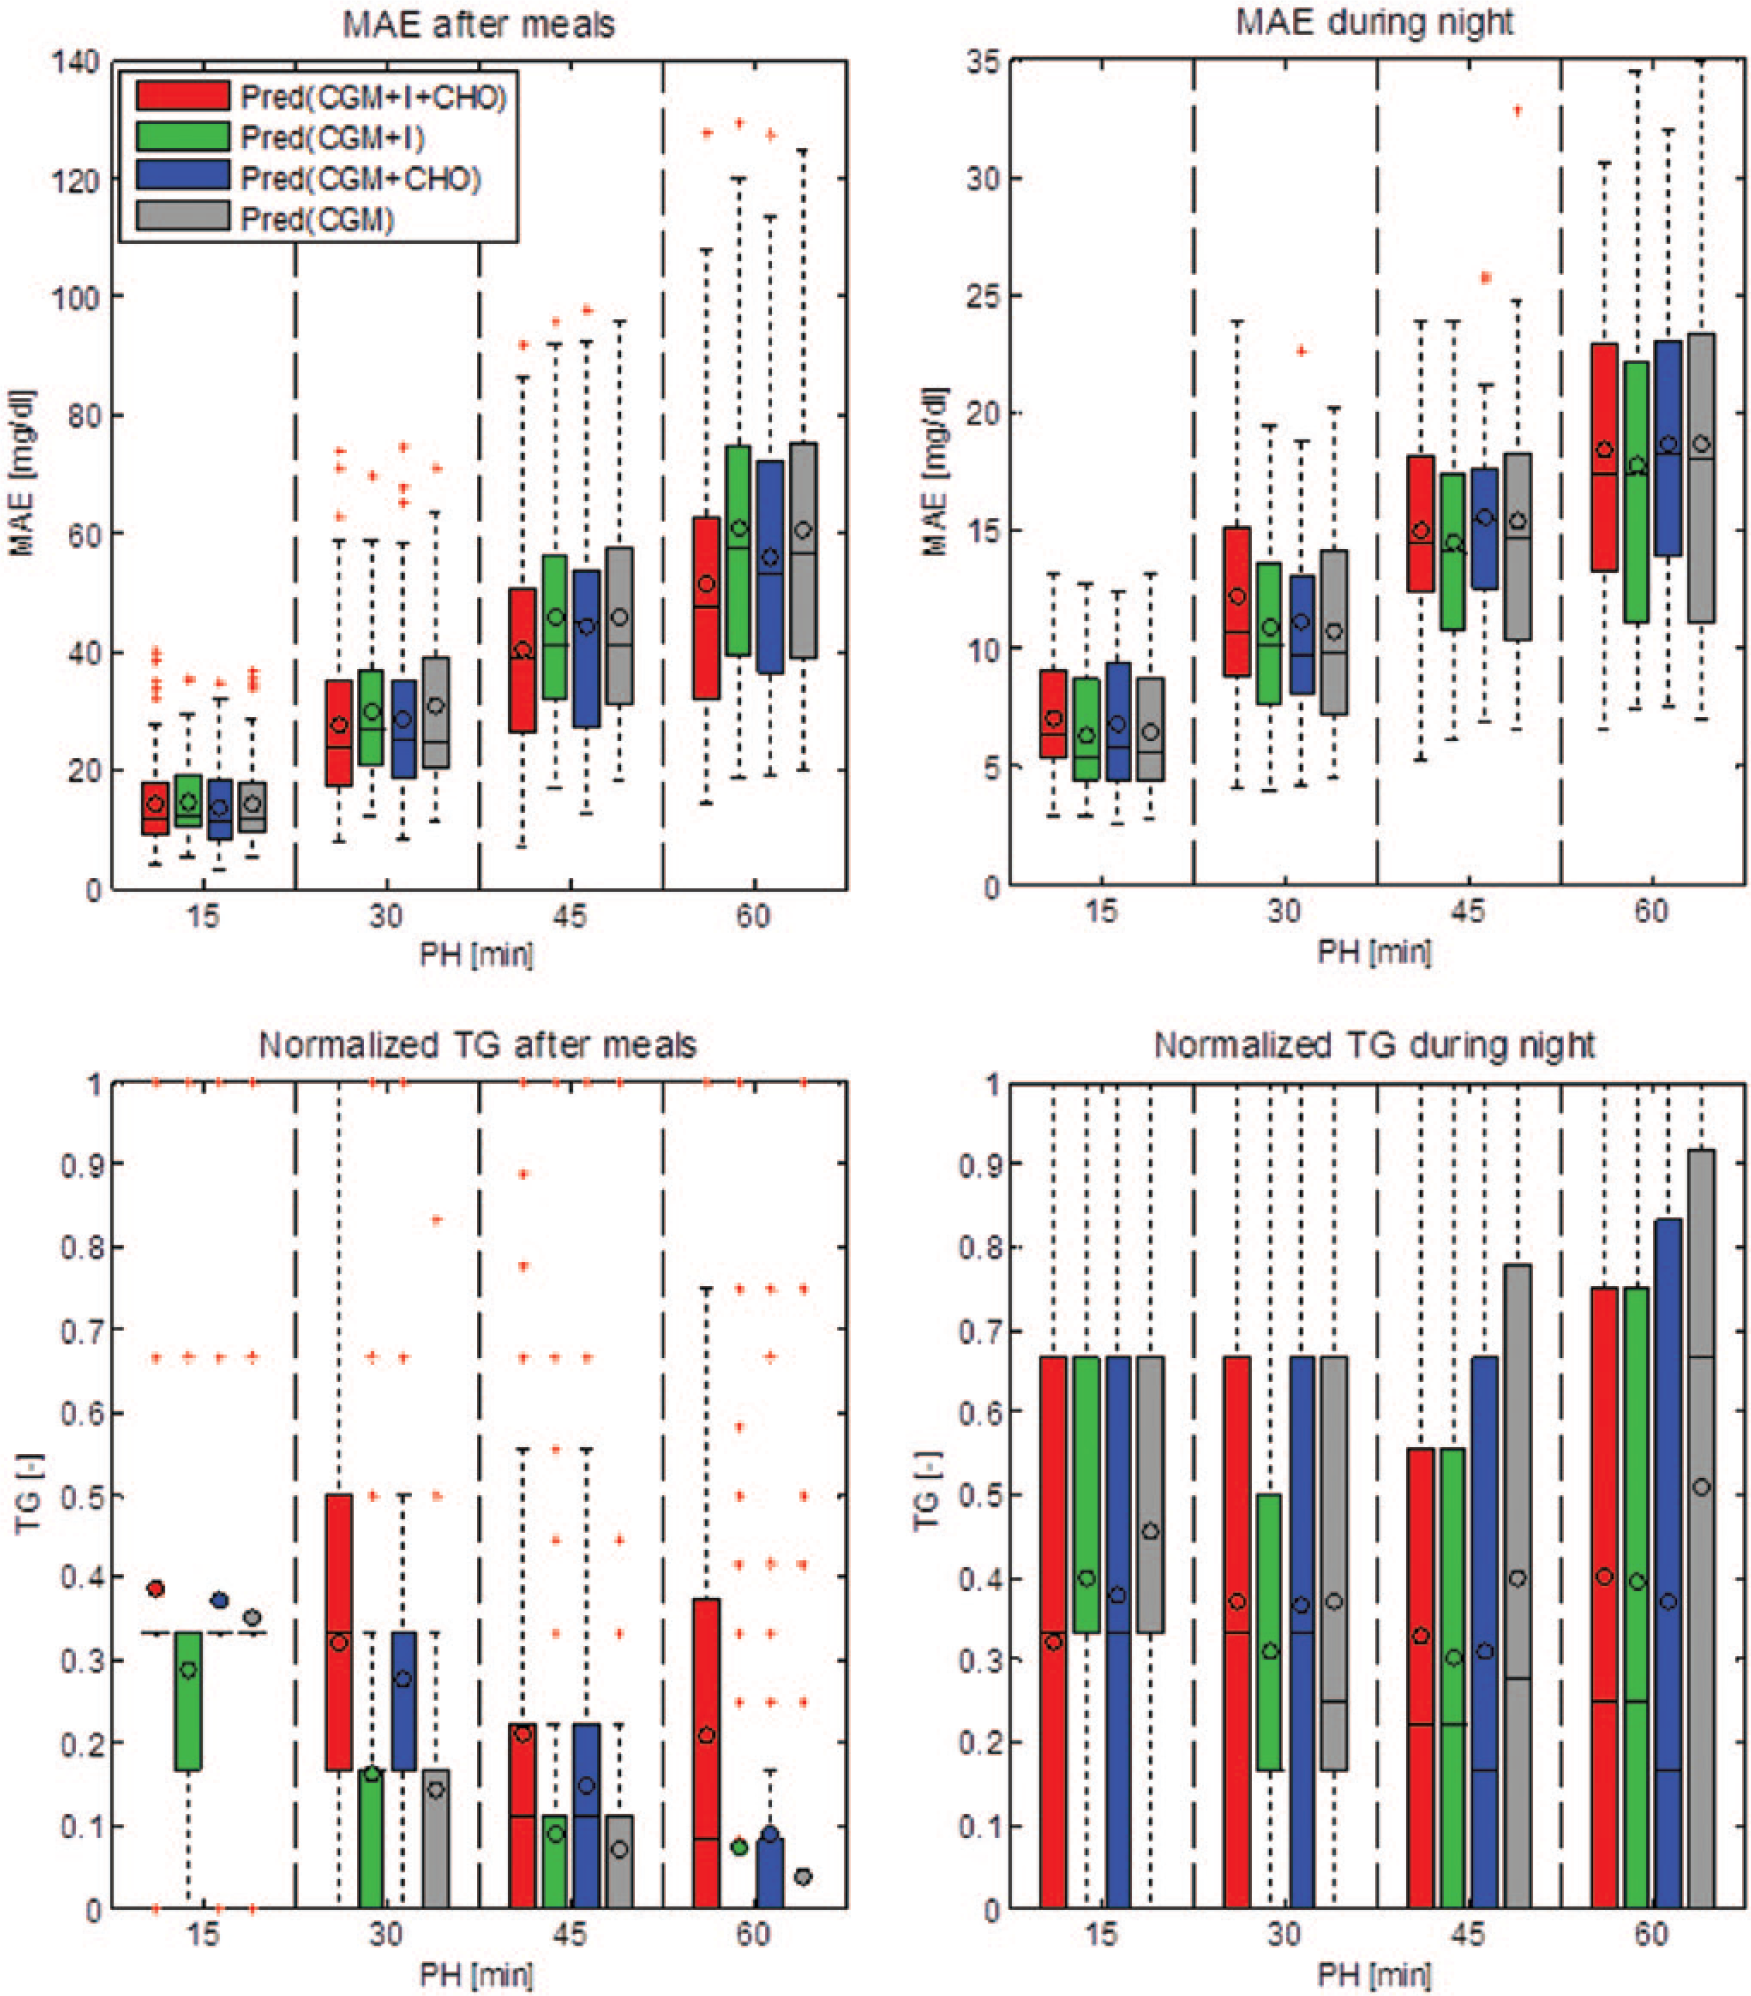
Box plots summarizing mean absolute error (MAE) and average time gain (TG) of the 4 predictors computed on the 2-hour time window following ingestion of CHO and injection of insulin (left column) and during the night (right column). For each box the horizontal lines represent, from bottom to top, the 25th, 50th, and 75th percentiles, respectively; the whiskers extend until the most extreme values; the red crosses represent outliers; and the circle corresponds to the average.
Table 1 summarizes average results obtained by the 4 models on the tested PH. Performance indexes are computed separately, in the 2-hour time window following CHO ingestion and insulin injection and during the night. Statistically significant differences between results obtained with Pred(CGM+I+CHO) and results obtained by the other prediction models are indicated by an asterisk and are computed using the sign test. For what concerns MAE computed on the time window following CHO ingestion and insulin injection, with a PH of 15 minutes Pred(CGM+I) performance is poorer than that of the other models; in addition, Pred(CGM+CHO) performs significantly better than Pred(CGM). With a PH of 30 minutes both Pred(CGM+I+CHO) and Pred(CGM+CHO) significantly improve on Pred(CGM+I) and Pred(CGM). With a PH of 45 minutes Pred(CGM+I+CHO) significantly outperforms all the other predictors and Pred(CGM+CHO) significantly improves on Pred(CGM+I). Finally, with a PH of 60 minutes Pred(CGM+I+CHO) significantly improves on all the other predictors and Pred(CGM+CHO) improves on Pred(CGM+I) and Pred(CGM). Differently, during the night, Pred(CGM+I+CHO) has a MAE significantly higher than the other models for a PH of 15 minutes and significantly higher than Pred(CGM+I) and Pred(CGM) for PH of 30 minutes. For longer PH the differences are no more significant. For what concerns the average normalized TG relative to the time intervals following CHO ingestion and insulin injection, with a PH of 15 minutes the models show similar performance, apart from Pred(CGM+I) whose TG is significantly lower than those of the other predictors. For a PH of 30 minutes Pred(CGM+I+CHO) and Pred(CGM+CHO) significantly improve on Pred(CGM+I) and Pred(CGM). For a PH of 45 minutes Pred(CGM+I+CHO) significantly outperforms all the other predictors and Pred(CGM+CHO) significantly improves on Pred(CGM+I) and Pred(CGM). Finally, for a PH of 60 minutes Pred(CGM+I+CHO) again significantly improves on the other models, Pred(CGM+CHO) is significantly better than Pred(CGM+I) and Pred(CGM), and Pred(CGM+I) performs significantly better than Pred(CGM). During the night, for PH of 15 minutes Pred(CGM+I) and Pred(CGM) have a TG significantly higher than Pred(CGM+I+CHO), while for longer PH no statistically significant difference is observed.
Mean Absolute Error (MAE) and Normalized Time Gain (TG) Average Results (Mean ± SD) for the 15 Test Time Series Computed During the 2-Hour Time Window Following CHO Ingestion and Insulin Injection and During the Night.
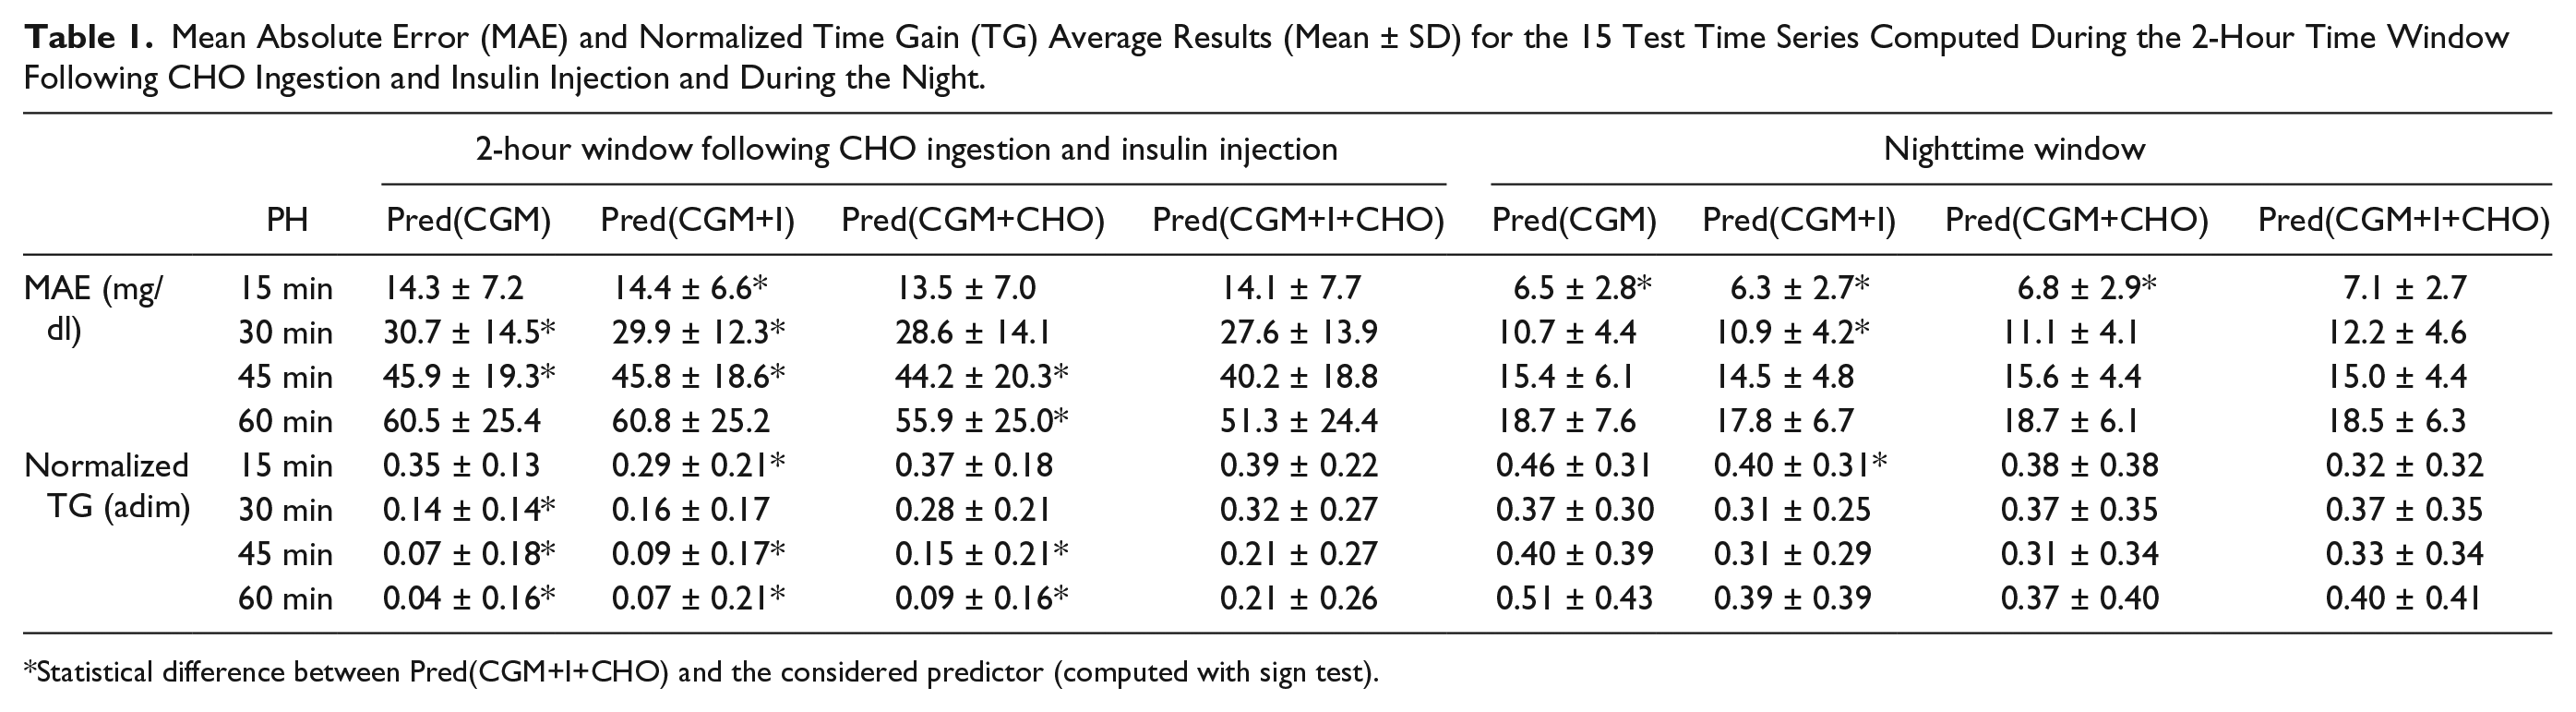
Statistical difference between Pred(CGM+I+CHO) and the considered predictor (computed with sign test).
Numerical results of Table 1 support what observed in Figures 2 and 3 and confirm that when inputs relative to ingested CHO and injected insulin are both added to CGM information, the model ability of predicting glucose concentration after CHO ingestion and insulin injections is significantly improved for PH longer or equal to 30 minutes. The addition to CGM of information on delivered insulin is not as beneficial for the prediction as the addition of information on CHO. However, when both delivered insulin and ingested CHO are added to CGM, the forecast obtained for PH of 45 and 60 minutes is more accurate and have a higher TG than that obtained when using only 1 of the 2 signals. These results suggest that CHO information is correctly associated by the predictor to a rapid increase in glucose concentration. Difficulties of the algorithm in taking advantage of insulin information may be due to many factors, such as the complexity in describing insulin action, the inter- and intraindividual variability of its effect, and its absorption delay, 31 which cannot be captured by the adopted average glucose predictor. In addition, in an open-loop setup meals and insulin boluses are given almost simultaneously and the input signals relative to CHO and insulin are highly correlated. This renders difficult to distinguish the contribution of each individual input on glucose concentration changes. During the night, when effect of both CHO and insulin is minimum (only a quasi-constant basal insulin is present) the predictor using only CGM information is the most accurate. The model that uses only CGM information has less parameters to tune during training, thus it can learn more accurately the relationship between current and future glycemia, when no other disturbance influences glucose time course.
Remark
In the prediction method we considered, possible errors on meal content and insulin delivery information, which may influence the determination of RaG and RaI used within the algorithm, are not explicitly taken into account. Indeed, in the DIAdvisor database these predictor inputs were known very precisely by protocol. In a more general situation, these errors could affect the quality of the prediction. Albeit in a previous study the NN predictor was shown to be robust against errors in the estimation of CHO content and on timing of the meals, 21 an analysis of the quantitative influence of patient behavior and errors is beyond the purpose of the present proof-of-concept study, that is, investigate the potential benefit of short-term glucose prediction from the use of insulin delivery and meal content information in addition to past CGM history.
Sensitivity of Prediction to Inputs
Results show that information on insulin does not improve prediction when used alone and minimally improves prediction when added to information on ingested CHO. Information on CHO and insulin improves prediction when PH ≥ 30 minutes.
This is confirmed by the sensitivity analysis that ranks the relative importance of every input of the predictor. A summary of results is shown in Figure 4. CGM is the most informative input in all models, especially in the short term (15-30 minutes). The prediction sensitivity to CHO information becomes relevant for PH of 45 and 60 minutes, while the influence of insulin information is minimal. We expect insulin and CHO to influence glucose concentration during approximately 2 hours following the injection of insulin and ingestion of CHO. This corresponds to roughly 25% of the day, considering 3 meals and associated injections of insulin per day. This might justify the lower sensitivity of the prediction to signals relative to ingestion of CHO and injection of insulin, with respect to the CGM signal.
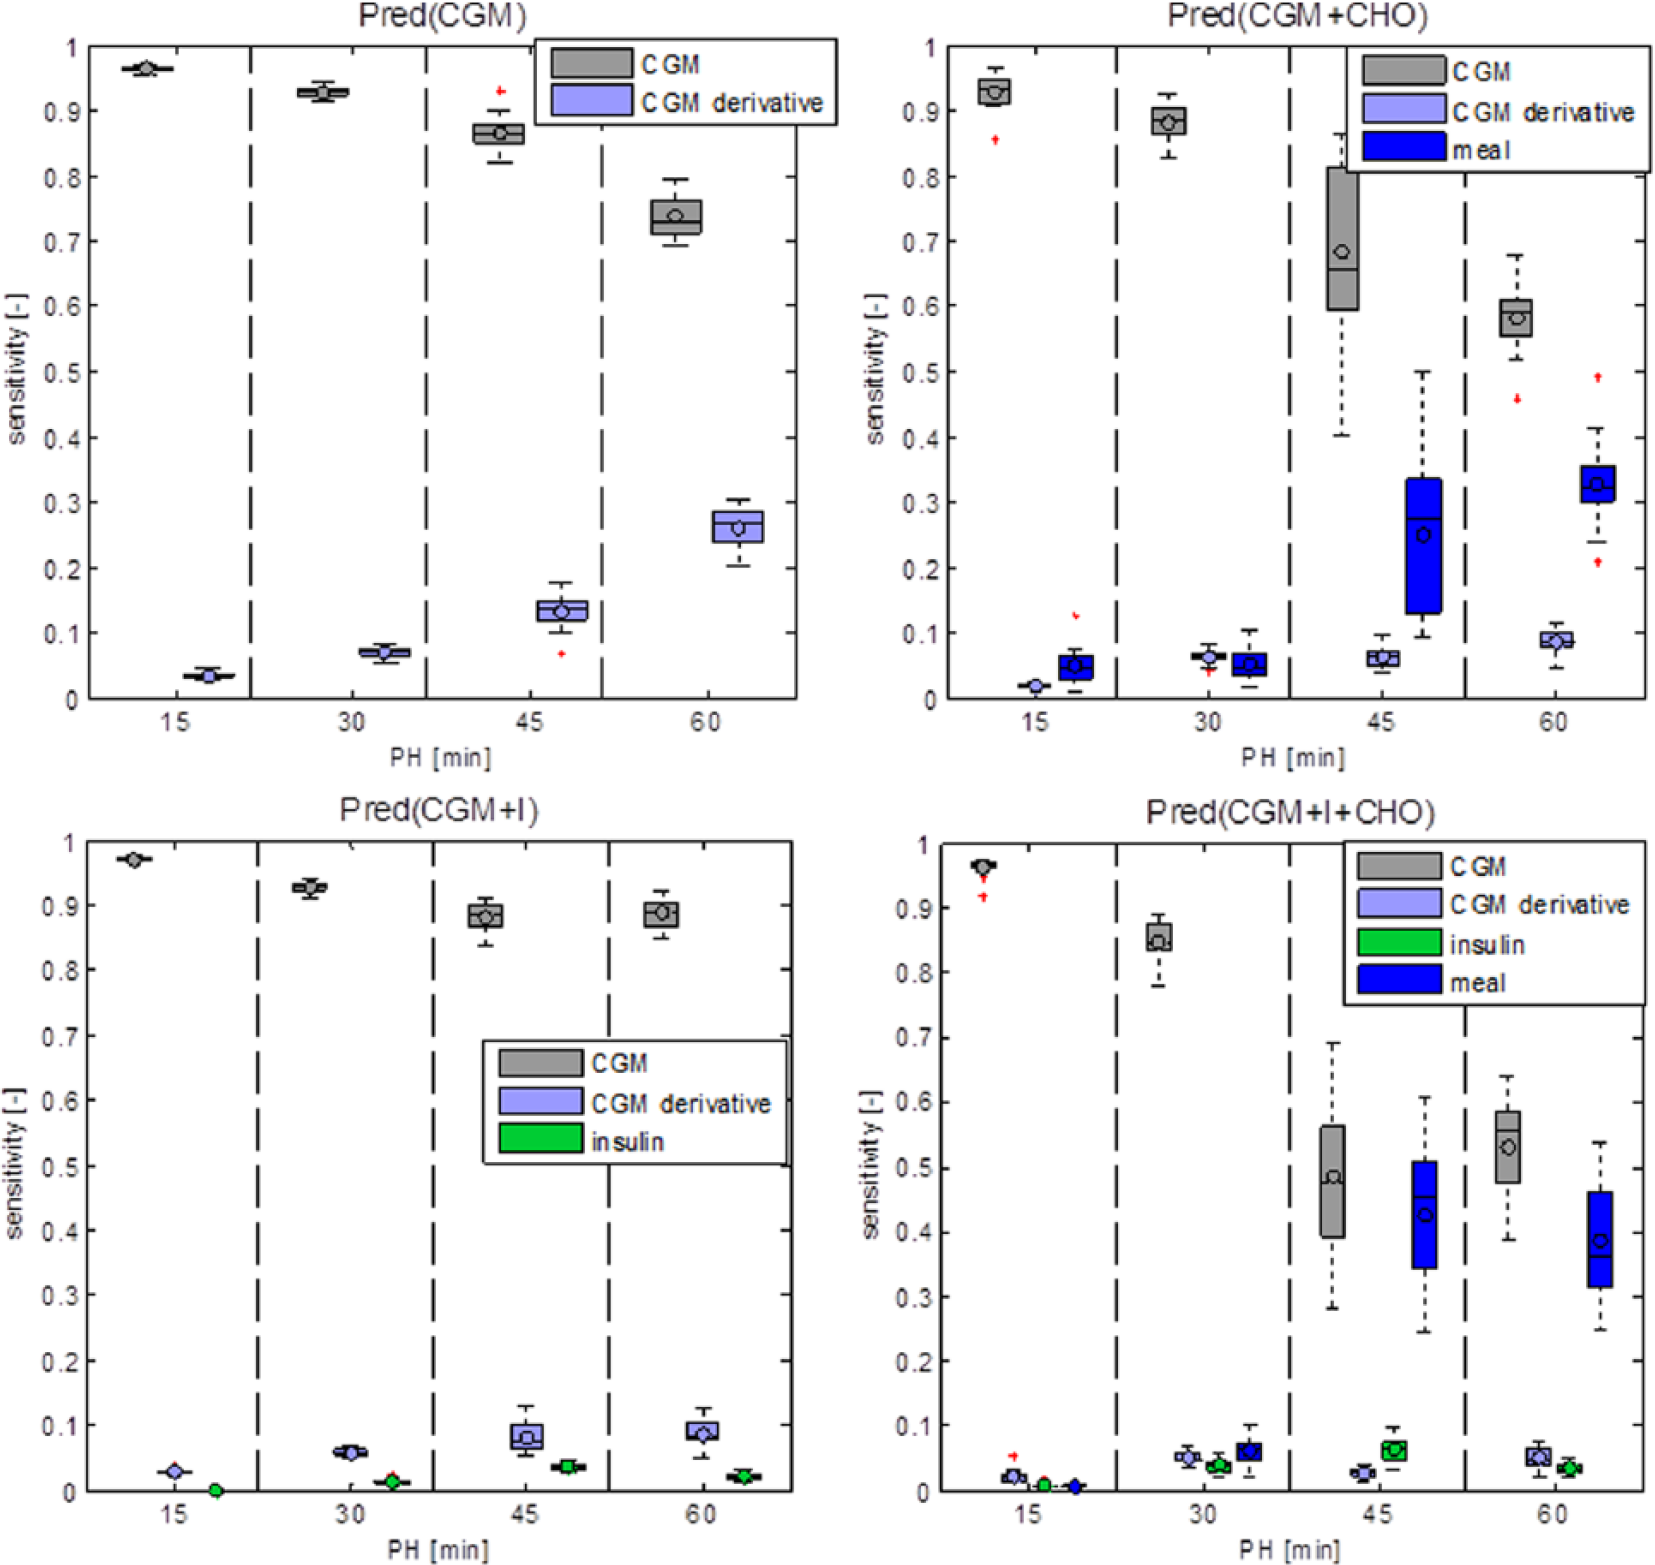
Box plots of output sensitivity to inputs for the 4 predictors.
Conclusions
Short-term prediction of glucose concentration implemented within a portable CGM device might improve open-loop T1D management by generating alerts when hypo or hyperglycemia events are forecasted to happen within a short time interval. Prediction could also help patients to better manage their disease by supplying them with information on the expected future glucose levels.
Most of the methods proposed in the last decade for short-term glucose prediction in an open-loop setting are based on models that use only CGM history as input. Recently, various algorithms using also insulin and/or CHO information have been proposed. Exploiting these additional inputs is difficult since their effects are affected by physiological delays and inter- and intraindividual variability. An analysis of how much each additional input effectively improves prediction is missing in the literature.
In this contribution we considered an open-loop setup and evaluated the improvement in short-term prediction accuracy and time gain associated with inputs relative to injections of insulin, ingestion of CHO, and both injection of insulin and ingestion of CHO. Results show that the information relative to insulin injection and CHO ingestion, or only CHO ingestion, significantly improves prediction when PH ≥ 30 minutes. Information on insulin only does not significantly improve prediction. An analysis of prediction sensitivity to inputs showed that future glucose concentration is mainly sensitive to past CGM history. Information on ingested CHO is relevant for a PH longer than 30 minutes, while the sensitivity to insulin information is negligible. Difficulties in using insulin information can be due to the complexity of its action, the inter- and intraindividual variability of its effect and its absorption delay. 31 In addition, in an open-loop setup, CHO and insulin information are highly correlated and their rates of appearance have similar shape, rendering difficult to distinguish the effect of each signal on glucose concentration.
The results presented in the article do not rule out the possibility of successfully exploiting both insulin and meal information to predict future glucose concentration, but we show how difficult it is to use effectively both information in an open-loop context. We believe that if patient-specific models of CHO absorption and insulin kinetics were available, information on both meal and insulin, preprocessed with such models, could possibly improve prediction more significantly than with the average population models used in this analysis. However, individualized models were not available for the subjects included in the DIAdvisor study, and it is not realistic to believe that similar models could be developed and used for real-life CGM users in an open-loop context.
The use of a data set with CGM recorded by an “old” sensor (the Dexcom Seven Plus) does not represent a limitation of the present study. In fact this data set collected during the DIAdvisor project was among those available to our group the one containing the most accurate and complete information on CHO content of meals and insulin injections, thus resulting the most appropriate for this proof-of-concept analysis. More importantly, we are confident that the use of CGM data collected with newer sensors would have not changed the overall result. Of course, a more accurate CGM sensor would improve prediction, because the capability of obtaining reliable predictions from the past CGM history would be strengthened. However, CGM accuracy does not influence the relative merit of the information related to meals and insulin injections and, in general, their “predictive power,” which, in turn, depends on the models adopted to describe their causal relationships with BG (specifically, the models of equations [1] and [2] employed within the predictor are state of the art).
Finally, despite this work should be considered as a proof-of-concept study, we believe that similar conclusions would have been obtained if the analysis were done using a prediction methodology, different from NN, able to exploit information relative to insulin injection and CHO ingestion. As a matter of fact, we had already obtained qualitatively comparable results in a preliminary analysis performed in the past using autoregressive (AR) and autoregressive with exogenous inputs (ARX) models. 32
Future works could focus on the closed-loop setup, where the injected insulin pattern is more variable than in open-loop setup and less correlated to meals. The role of other inputs for the prediction model could be investigated, such as physical activity related signals, whose correlation with changes in glucose dynamics was demonstrated. 33
Footnotes
Appendix
Abbreviations
CHO, carbohydrate; CGM, continuous glucose monitoring; MAE, mean absolute error; NN, neural network; PaD, partial derivative; PH, prediction horizon; SMBG, self-monitoring of blood glucose; T1D, type 1 diabetes.
Declaration of Conflicting Interests
The author(s) declared no potential conflicts of interest with respect to the research, authorship, and/or publication of this article.
Funding
The author(s) disclosed receipt of the following financial support for the research, authorship, and/or publication of this article: The authors would like to thank Prof A. Avogaro and Dr A. Maran (Department of Medicine, University of Padova, Italy) for providing them with a set of data collected under the DIAdvisor project, cofunded by the EU through the IST program under FP7 (IST FP7-216592).
References
Supplementary Material
Please find the following supplemental material available below.
For Open Access articles published under a Creative Commons License, all supplemental material carries the same license as the article it is associated with.
For non-Open Access articles published, all supplemental material carries a non-exclusive license, and permission requests for re-use of supplemental material or any part of supplemental material shall be sent directly to the copyright owner as specified in the copyright notice associated with the article.