
Abstract
Background:
Simulated data are a powerful tool for research, enabling benchmarking of blood glucose (BG) forecasting and control algorithms. However, expert created models provide an unrealistic view of real-world performance, as they lack the features that make real data challenging, while black-box approaches such as generative adversarial networks do not enable systematic tests to diagnose model performance.
Methods:
To address this, we propose a method that learns missingness and error properties of continuous glucose monitor (CGM) data collected from people with type 1 diabetes (OpenAPS, OhioT1DM, RCT, and Racial-Disparity), and then augments simulated BG data with these properties. On the task of BG forecasting, we test how well our method brings performance closer to that of real CGM data compared with current simulation practices for missing data (random dropout) and error (Gaussian noise, CGM error model).
Results:
Our methods had the smallest performance difference versus real data compared with random dropout and Gaussian noise when individually testing the effects of missing data and error on simulated BG in most cases. When combined, our approach was significantly better than Gaussian noise and random dropout for all data sets except OhioT1DM. Our error model significantly improved results on diverse data sets.
Conclusions:
We find a significant gap between BG forecasting performance on simulated and real data, and our method can be used to close this gap. This will enable researchers to rigorously test algorithms and provide realistic estimates of real-world performance without overfitting to real data or at the expense of data collection.
Keywords
Introduction
Continuous glucose monitors (CGMs) have revolutionized care for individuals with type 1 diabetes (T1D), 1 as CGMs allow continuous insight into blood glucose (BG) and are essential components of artificial pancreas (AP) systems that automate BG management. Blood glucose simulators have enabled testing new BG control algorithms 2 and benchmarking BG forecasting performance. For simulations to be predictive of real-world performance, though, the data must contain the properties that make BG forecasting and control challenging.
Most BG simulations use domain knowledge to create generative models that capture the dynamics between BG, insulin, meals (eg, UVA/PADOVA model),
3
and physical activity.
4
However, there is a significant BG forecasting performance gap between simulations and real data (root mean square error [RMSE] simulated: 9.38; real: 21.07)
5
with similar gaps reported elsewhere.6
-8 Part of this is due to the incompleteness of the simulation system, as it does not include factors affecting BG such as stress
9
and the influence of fats and protein on glycemic profile of a meal.
10
Adding intra-subject variation via model parameters can improve simulations but does not close the performance gap even with
In most BG simulations, a CGM error model12,13 is used to capture sensor error. However, these models: (1) focus only on sensor-related properties and do not capture variations in data sets like demographics that affect BG values differently14,15; (2) require subjects to wear multiple sensors and have frequent finger-stick BG readings, which are impractical for routine use13,16; and (3) do not capture factors like motion artifacts 17 and other forms of error like pressure-induced sensor attenuations.18,19 Missing data are often simulated using random dropout 20 where a percentage of observations is deleted.21,22 However, this assumes data are missing completely at random, which is not true for CGM. Drecogna et al 23 modeled gaps in CGM data using a two-state Markov model, but only replicated statistics (eg, number of gaps) and did not account for gaps due to other observed variables (eg, a person’s vigorous exercise causing a CGM sensor to be disconnected).
One way to overcome these challenges is to learn a simulation model directly from data. Recent work using this approach has simulated CGM using generative adversarial networks (GANs) conditioned on HbA1C 24 or the presence of hypo/hyperglycemia.25,26 However, GANs have privacy issues as individuals can be re-identified, 27 and in addition, they are black-box models, which means ablation studies (eg, BG forecasting with or without missing data) cannot be performed.
To address the challenges of creating realistic simulated BG, we propose data-augmented simulation (DAS), a hybrid approach that is modular (like knowledge-based methods) and realistic (like data-driven methods) by augmenting simulated data with real data properties. We focus on BG simulation for individuals with T1D and incorporate data set–specific errors and missingness patterns. We apply DAS to real-world data sets collected from different populations (varied age, race) with different protocols (data duration and sampling frequency).
Methods
We first discuss how we learn data properties from CGM data, and then how we augment simulated BG with these properties (see Figure 1 for an overview).
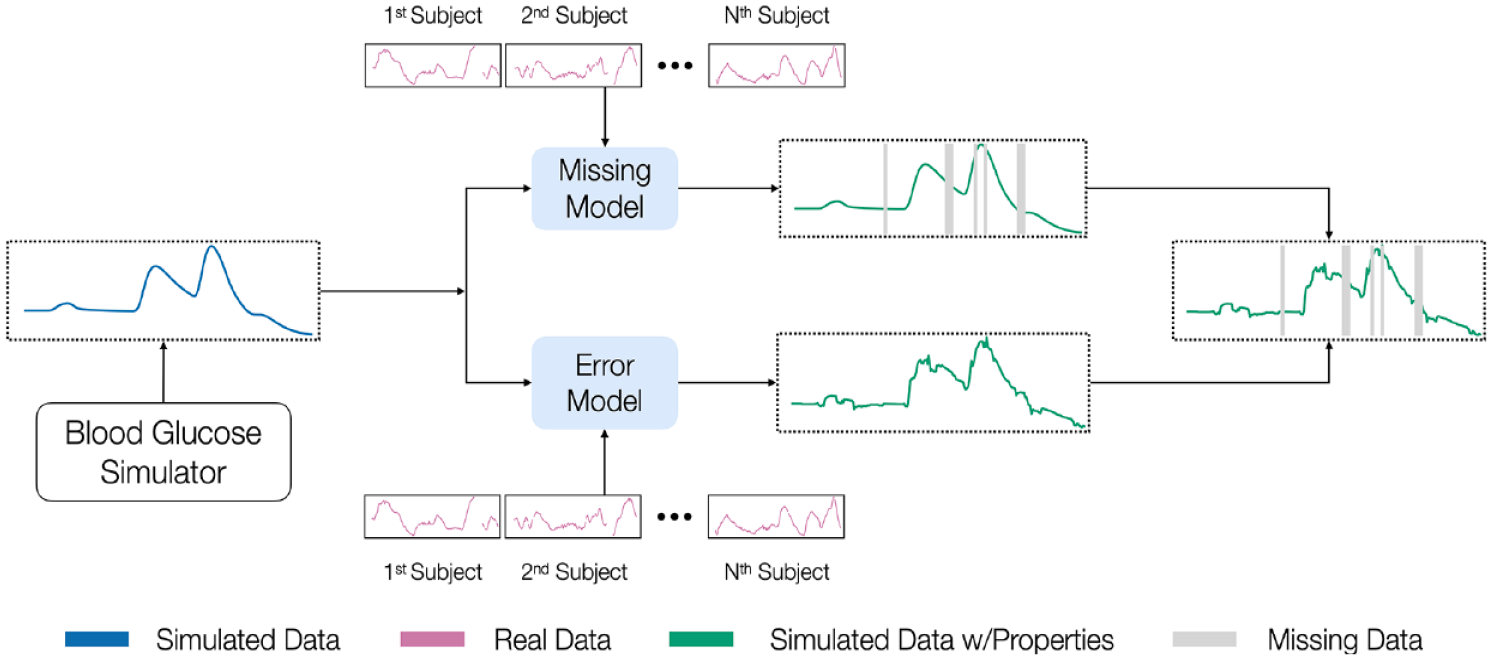
An overview of our methods for making simulated BG data more realistic. We begin with a simulation model that generates simulated BG, learns missing data and error patterns from real diabetes data sets, and finally augments simulated BG data with these learned properties.
Learning Data Properties From Real Data
We define a multivariate time series as
Missing data model
To learn the patterns of missingness, we frame it as a two-part problem where we predict the start and then duration of a missing interval. Predicting the start of a missing interval at time
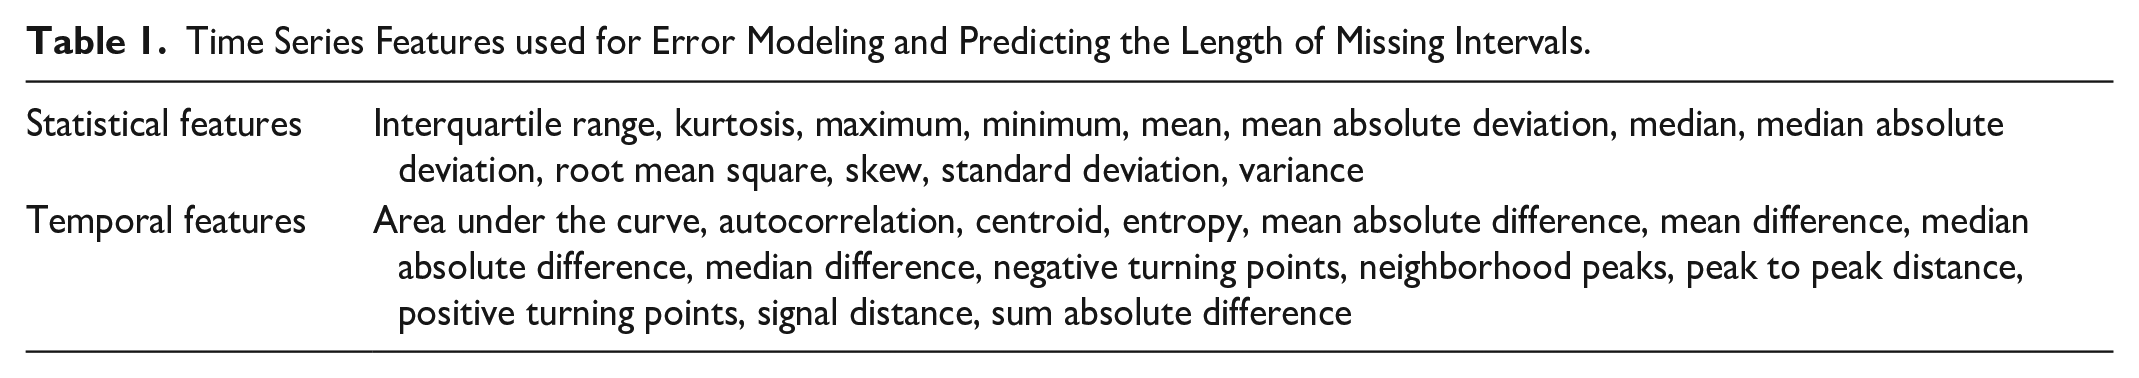
To predict the duration of a missing interval z, we learn a second function. As there is no established feature set for learning the duration of missing intervals, we examined many features (Table 1) extracted from a window wl of CGM data from the start of the missing interval. While the duration z can vary in length, we restrict the maximum value because: (1) larger missing intervals are often not representative of actual missing intervals and (2) there are typically fewer samples to learn from. The maximum duration, zmax, set based on domain knowledge, is two hours here.
Time Series Features used for Error Modeling and Predicting the Length of Missing Intervals.
Error model
We first discuss how to learn an error model when we have both finger-stick and CGM data, before discussing the case when only CGM is available. When BG is available, we align CGM and BG values using the Poincaré plot approach
30
on the entire data set. This is necessary as CGM values are delayed relative to finger-stick BG and this delay may vary across individuals. When BG is absent, we approximate it using smoothed CGM data as our reference. While we cannot identify errors such as all CGM readings being shifted higher or lower than finger-stick BG due to errors in sensor calibration, smoothing allows us to identify outlying values and erroneous spikes. Given an observation
Augmenting Simulated Blood Glucose Data With Real Data Properties
To add the learned properties to simulated BG, we use a post-processing step. The input is simulated BG and the outputs are a missingness vector
Augmenting simulated blood glucose with missing data
To predict when missing data occur, we begin by extracting windows of length w
min
to w
max
and iteratively performing prediction until a window is classified as missing. To determine whether to accept these predictions, we use the precision P from the learning phase as the probability of correctly predicting the start of a missing interval using a binomial trial
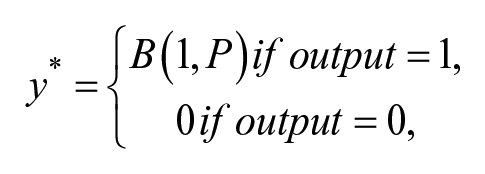
where
Augmenting simulated blood glucose with error
To add error to simulated data, we extract history windows of size
Experiments
Data Sets
We first describe the real data sets (see Table 2) and then simulated data sets generated to match the features of each. To avoid leakage, we divide real data sets into a 70/30% subset for learning data properties and forecasting except for OhioT1DM where it is six weeks/two weeks due to its size (see Supplemental Appendix D for details on data subsets).
OhioT1DM 31 : It has been used for benchmarking BG forecasting methods. As it is relatively small and controlled, results may not be representative of performance on other data sets. 11
OpenAPS 32 : It is from people using an open-source AP who elect to donate their data. It is patient generated; so, it provides a useful comparison with highly controlled data sets.
RCT 33 : It was collected during a randomized trial testing the use of CGM without BG confirmations. It is larger than OhioT1DM and thus provides a better comparison for data collected in a controlled setting.
Racial-Disparity 34 : It was collected in a study testing if there is a difference between mean glucose and HbA1c in non-Hispanic black and white people with T1D. It has a higher proportion of black participants (54%) and a larger age range (5-72 years) compared with other data sets, which allows us to test with a different population. Note that the CGM sampling interval is 15 minutes compared with 5 minutes in other data sets.
Simulated Data: It is generated to match the characteristics (average days of data, meal information, age group) of real data sets. For example, Sim-OpenAPS is generated for 10 adults with 308 days of data per subject (see Supplemental Appendix B for details on simulation).
Characteristics of Real T1D Data Sets.
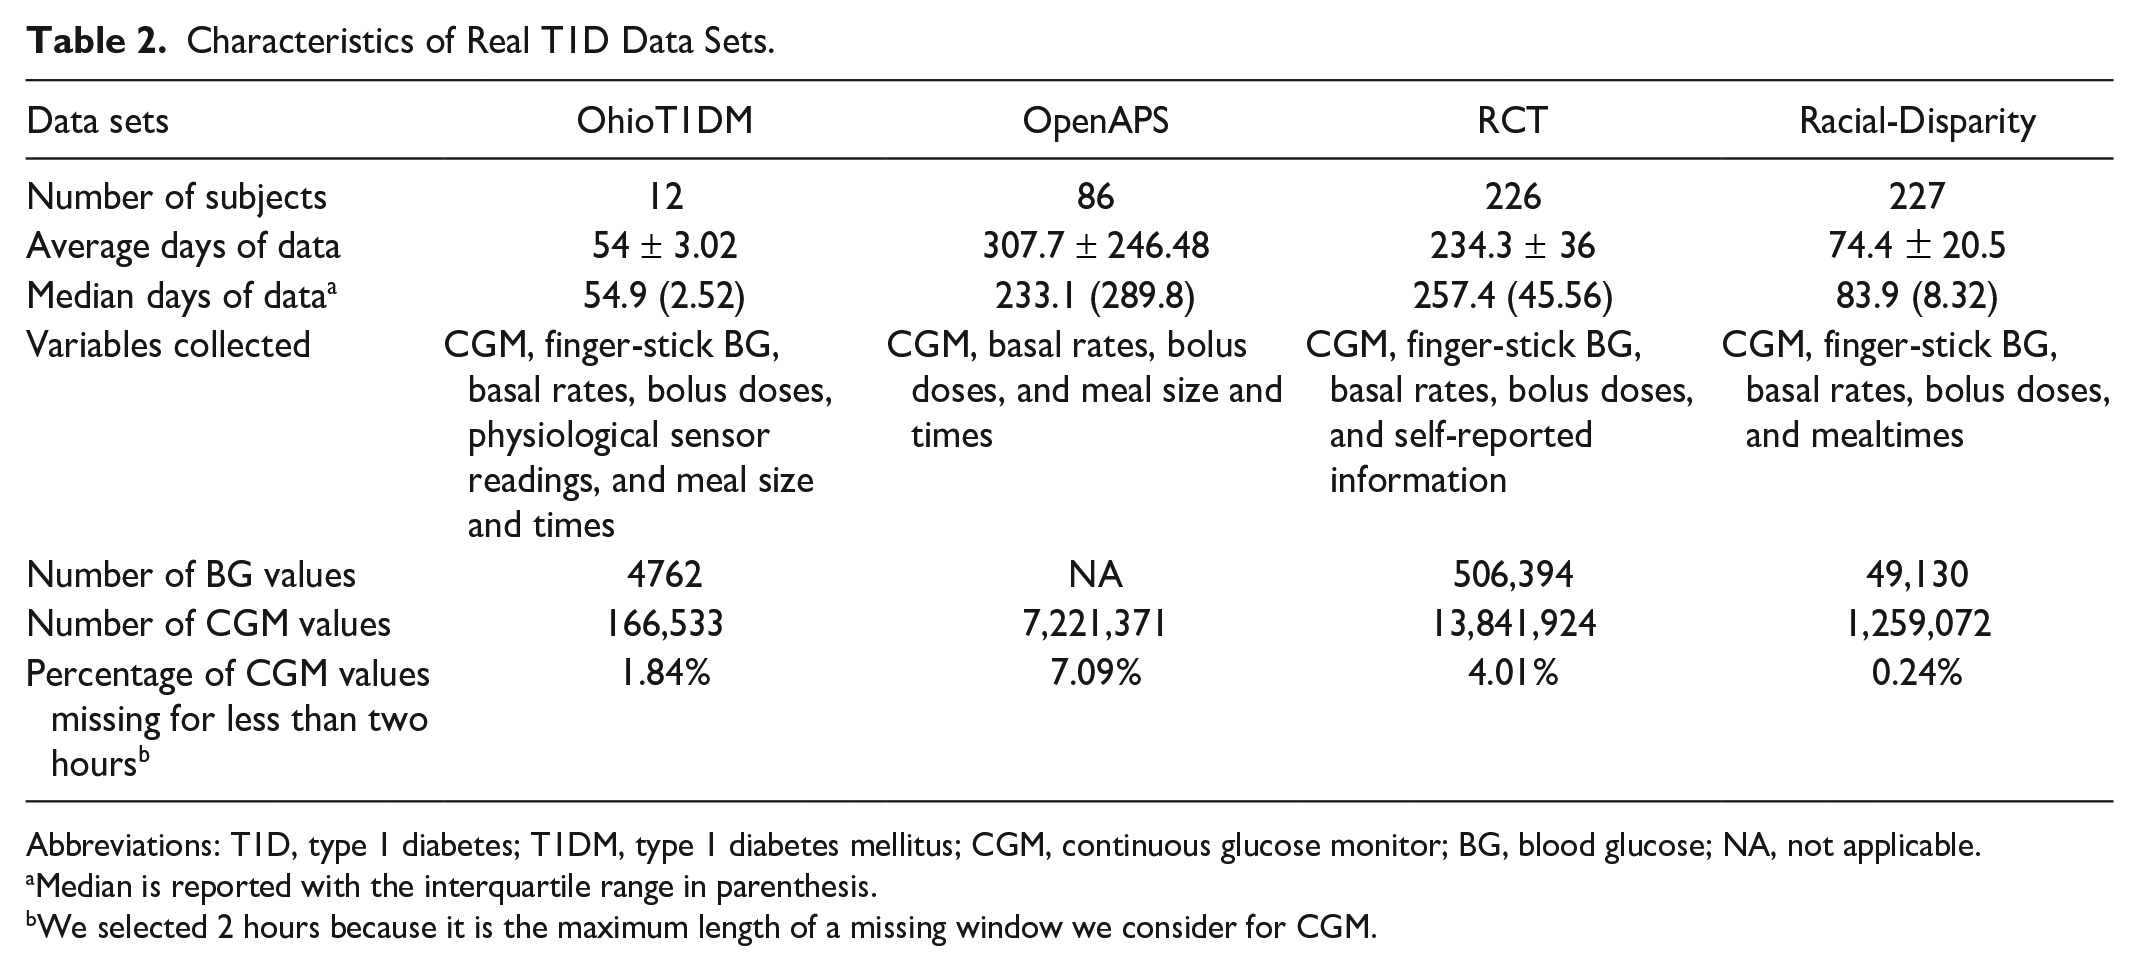
Abbreviations: T1D, type 1 diabetes; T1DM, type 1 diabetes mellitus; CGM, continuous glucose monitor; BG, blood glucose; NA, not applicable.
Median is reported with the interquartile range in parenthesis.
We selected 2 hours because it is the maximum length of a missing window we consider for CGM.
Experiments for learning data properties
To predict the start of missing intervals, we train a recurrent neural network (RNN) with a hidden layer of 32 units, batch size of 128, maximum epochs of 100, and early stopping of 15 epochs. We use a fivefold cross-validation split across patients (a further split of the 70%) and report performance using the area under the receiver operating curve (AUROC) and the area under the precision-recall curve (AUPRC). For predicting the length of missing intervals, we train a random forest (RF) regressor. For predicting errors, we train an Xgboost regressor except for Racial-Disparity, where RF was used as this provided better performance. We evaluate the performance of predicting the length of missing intervals and errors using the RMSE (RMSE is defined as:
Experiments for blood glucose forecasting on simulated data
We aim to test whether our method for augmenting simulated BG (Dropout-predicted and Error-predicted) brings performance closer to real CGM compared with current practice. We compare against current BG simulation practices:
Dropout-random: We delete a percentage of observations based on the average percent of missing data (up to the maximum gap size of two hours from missing data experiments) in each real data set. These are 1.71% for OhioT1DM, 7.40% for OpenAPS, 4.12% for RCT, and 0.27% for Racial-Disparity.
Error-Gaussian: We add Gaussian noise of N(0.4mg/dL) within the 15% required error range for CGM sensors.
Error-CGM: We add noise using a CGM error model 12 that is not specific to any data set.
For forecasting, we use the same set of models as Hameed & Kleinberg,
11
including linear regression (REG), RF, RNN, and long short-term memory (LSTM). We report the difference in the mean RMSE (over ten runs) between real and simulated data as
Results
We now discuss results on learning data properties and BG forecasting to test improved simulated data performance.
Results on Learning Data Properties of Missing Data and Error
Table 3 shows results for missing data and error prediction on all real data sets. For predicting the start of missing intervals, a prediction is only correct if the first timepoints in a sequence of missing datapoints are predicted. While this is a strict evaluation (as the time identified may be slightly early or slightly late), our method performs better than the AUROC baseline of 0.5. Our method has the best improvements over the mean baseline for the AUPRC on OpenAPS and RCT compared with OhioT1DM and Racial-Disparity. For OhioT1DM, the performance is likely due to its smaller size, while for Racial-Disparity, its heterogeneous population coupled with a lower sampling rate (which may not be the right timescale for observing patterns) makes learning challenging. These challenges also likely apply when predicting the duration of missing intervals as our method performs better for OpenAPS and RCT compared with OhioT1DM and Racial-Disparity, which have a higher RMSE.
Results for Predicting the Start of Missing Intervals, Duration of Missing Intervals, and the CGM Error for Real Data Sets.
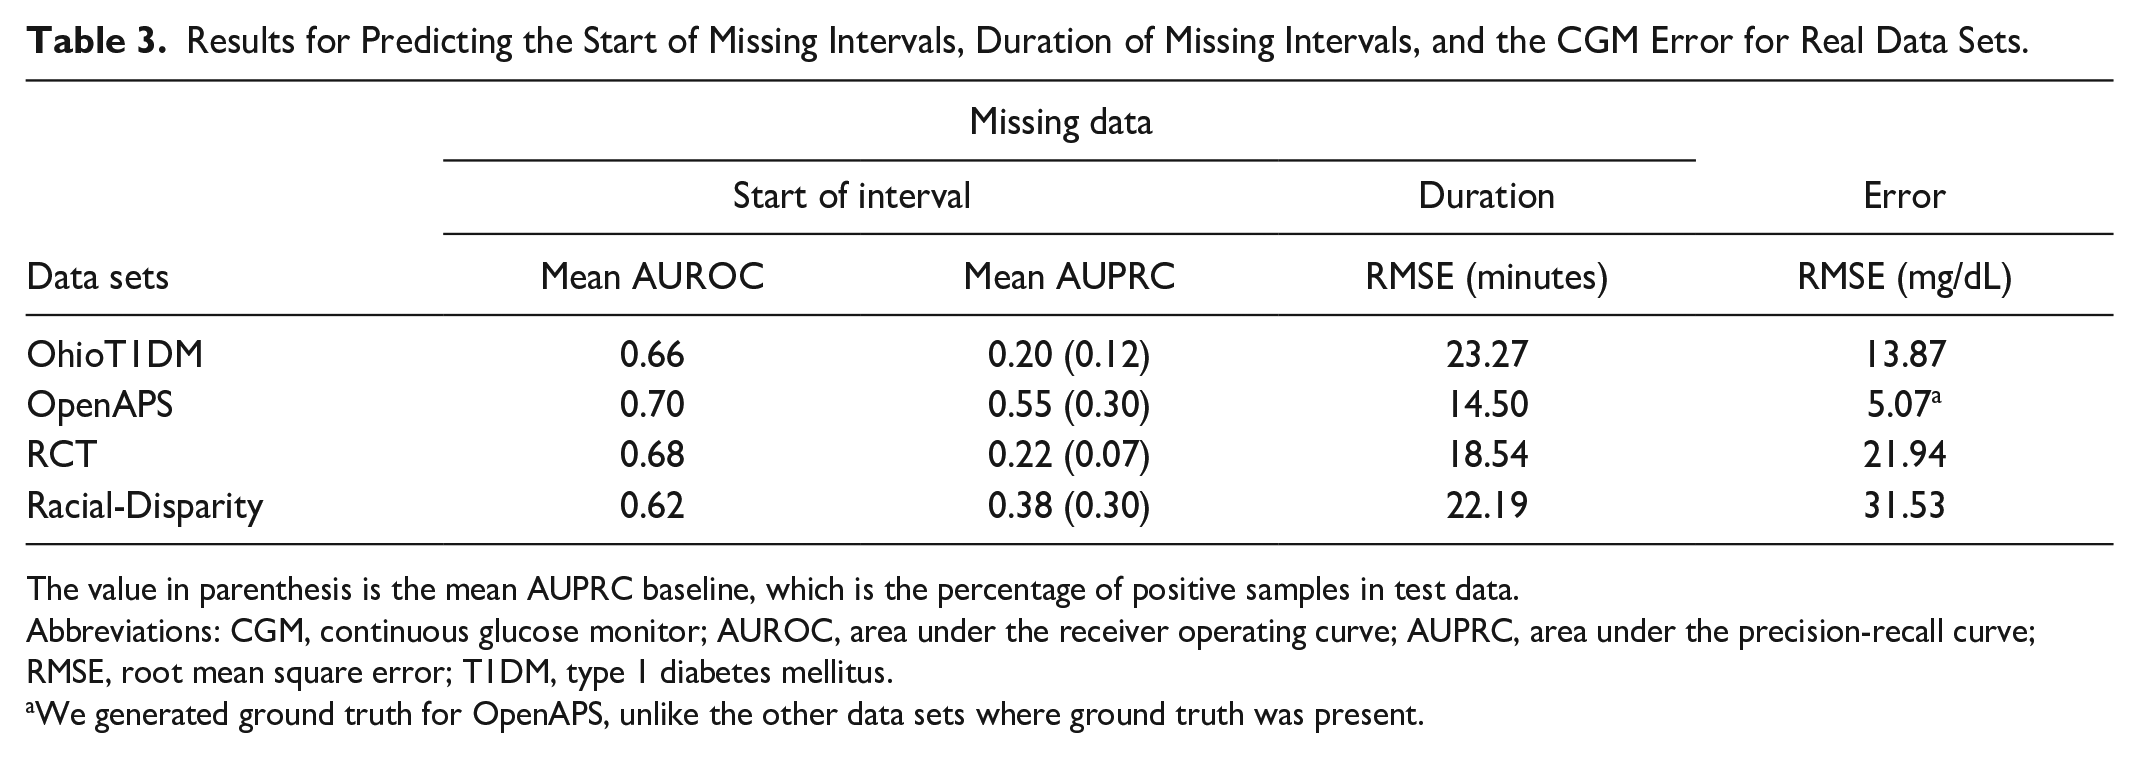
The value in parenthesis is the mean AUPRC baseline, which is the percentage of positive samples in test data.
Abbreviations: CGM, continuous glucose monitor; AUROC, area under the receiver operating curve; AUPRC, area under the precision-recall curve; RMSE, root mean square error; T1DM, type 1 diabetes mellitus.
We generated ground truth for OpenAPS, unlike the other data sets where ground truth was present.
Similarly, when predicting error, we had the worst performance on Racial-Disparity which suggests that its heterogeneity makes learning challenging. We performed best on OpenAPS due to the use of synthetic ground truth which creates error values closer to CGM data compared with other data sets where actual ground truth is present.
Results for Blood Glucose Forecasting on Simulated Data
We now turn to the task of BG forecasting, comparing our approach to baseline methods for adding error and dropout. To understand how dropout and error individually affect performance, we test them separately. For each property (eg, error), we compare our approach (Error-predicted) to baselines and raw simulated data. As shown in Figure 2, raw simulated data have the largest
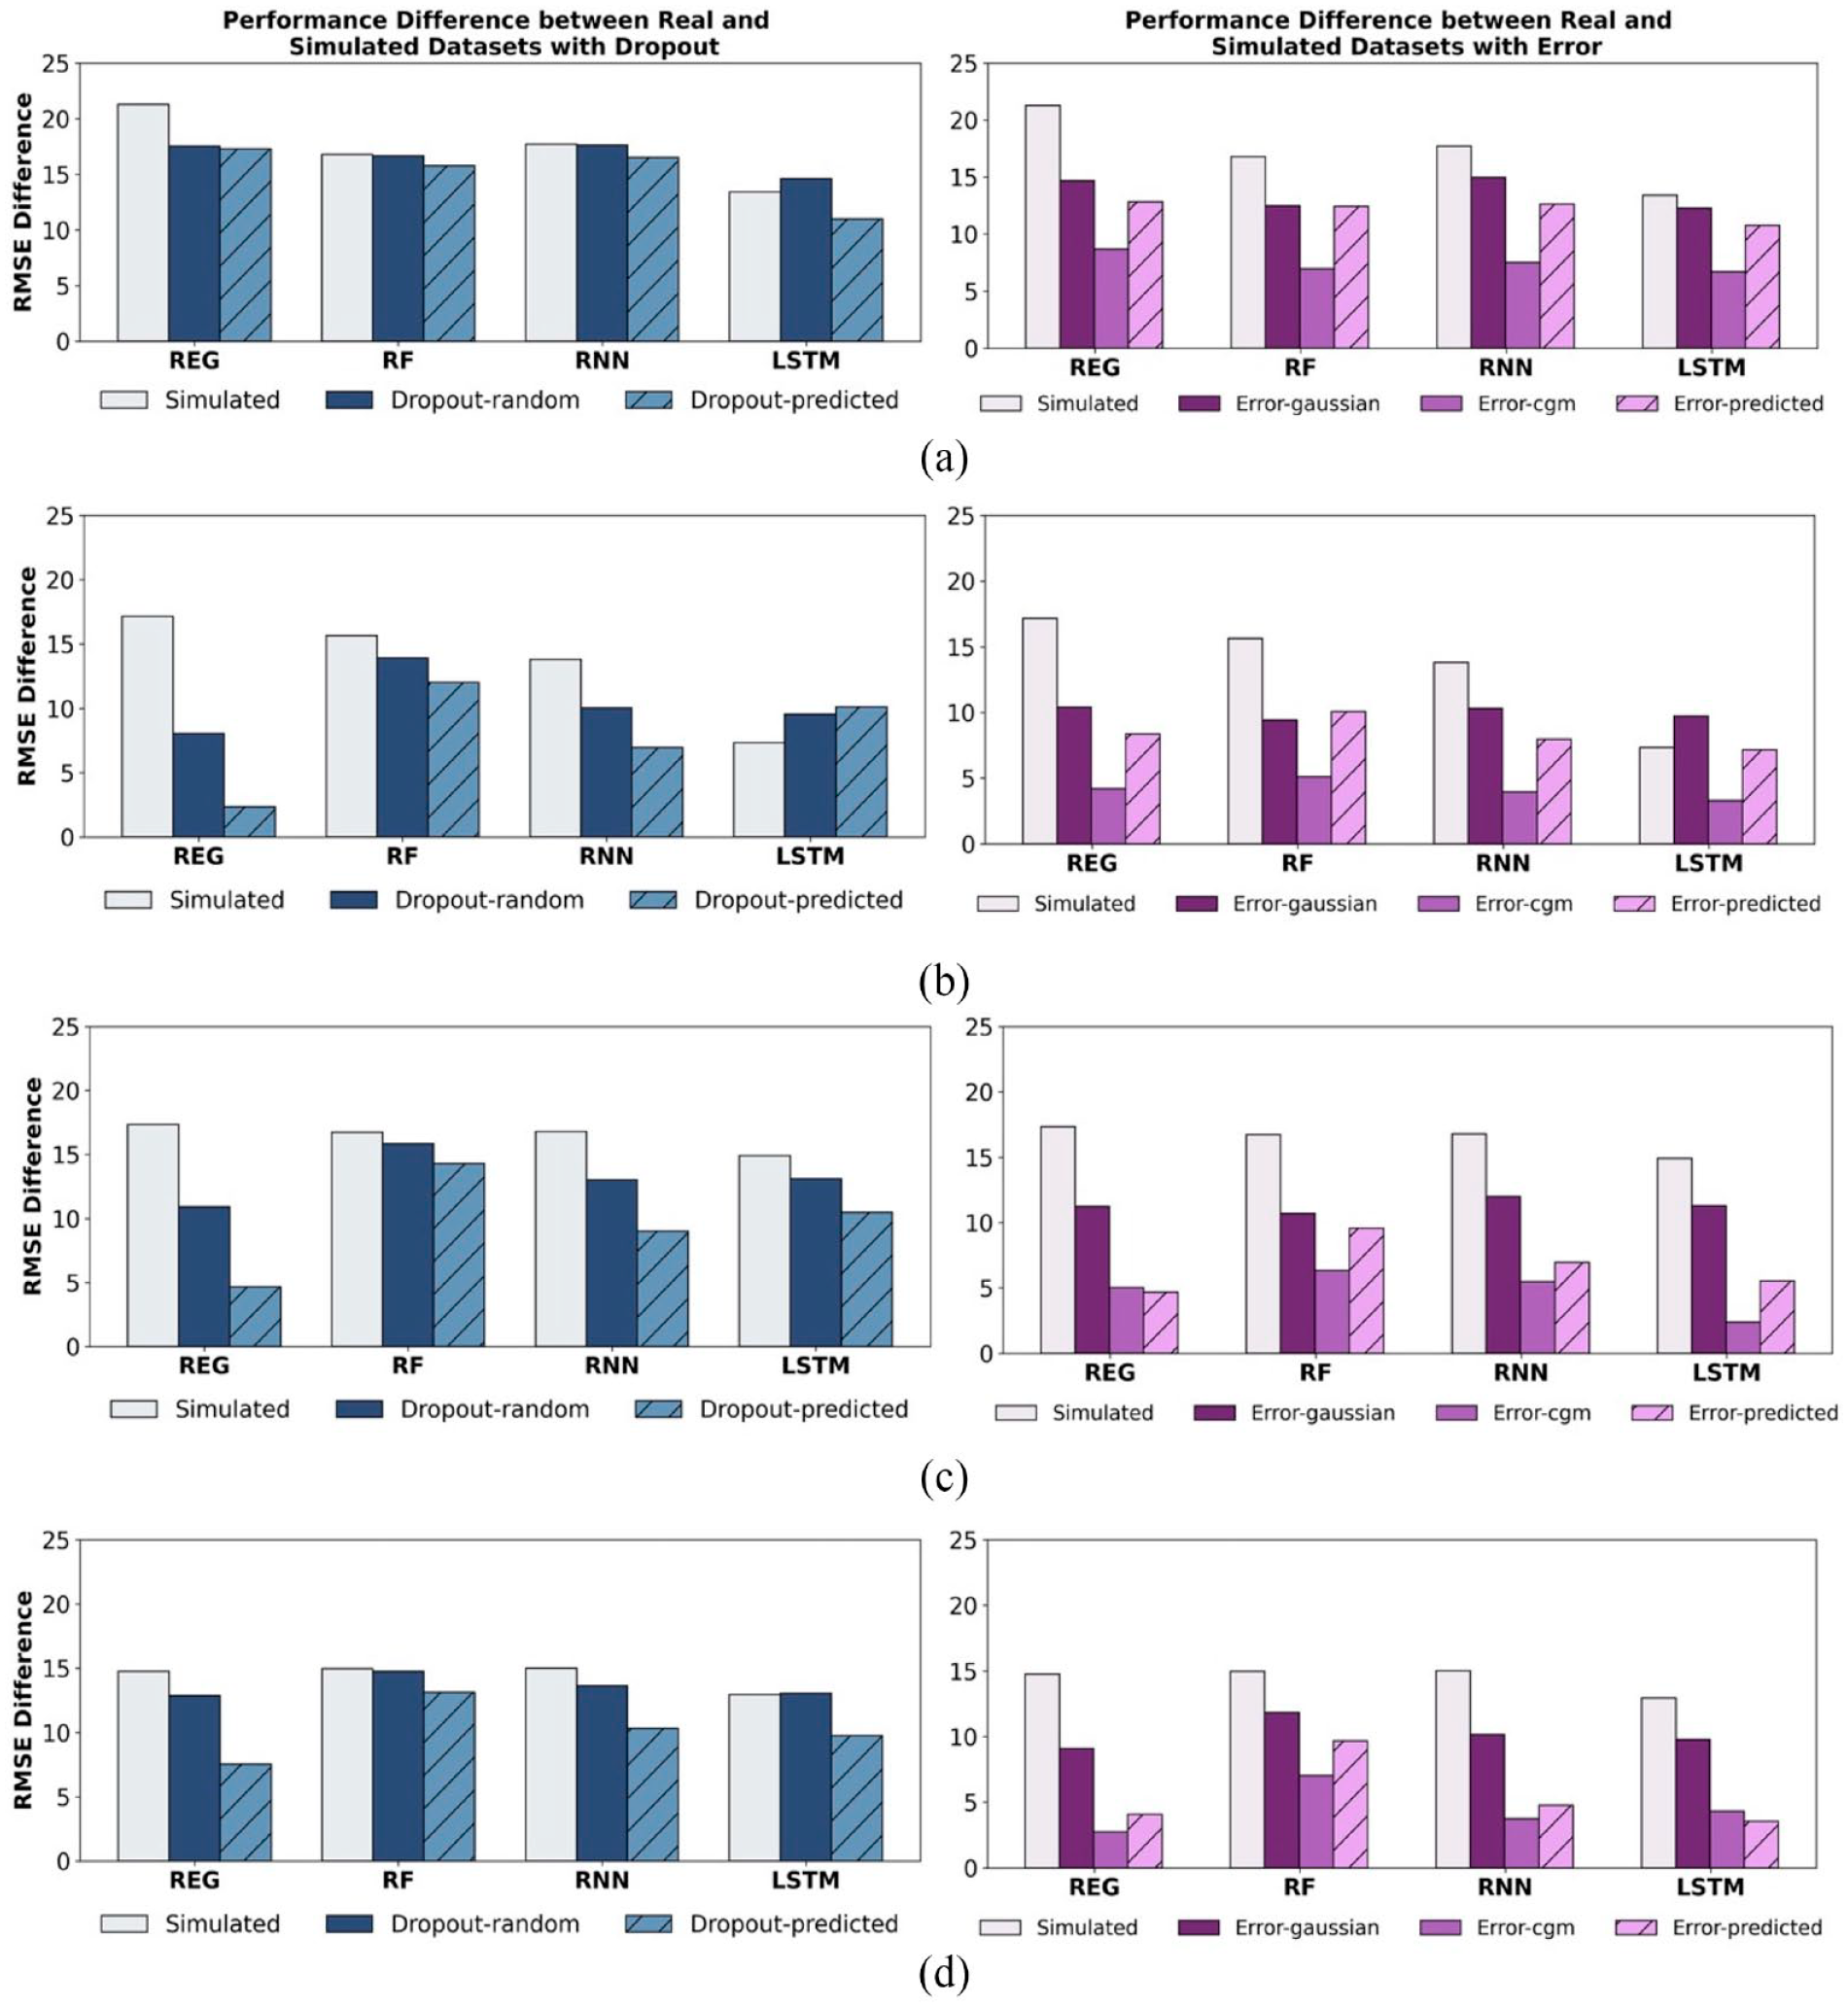
Mean RMSE difference between real and simulated data sets (
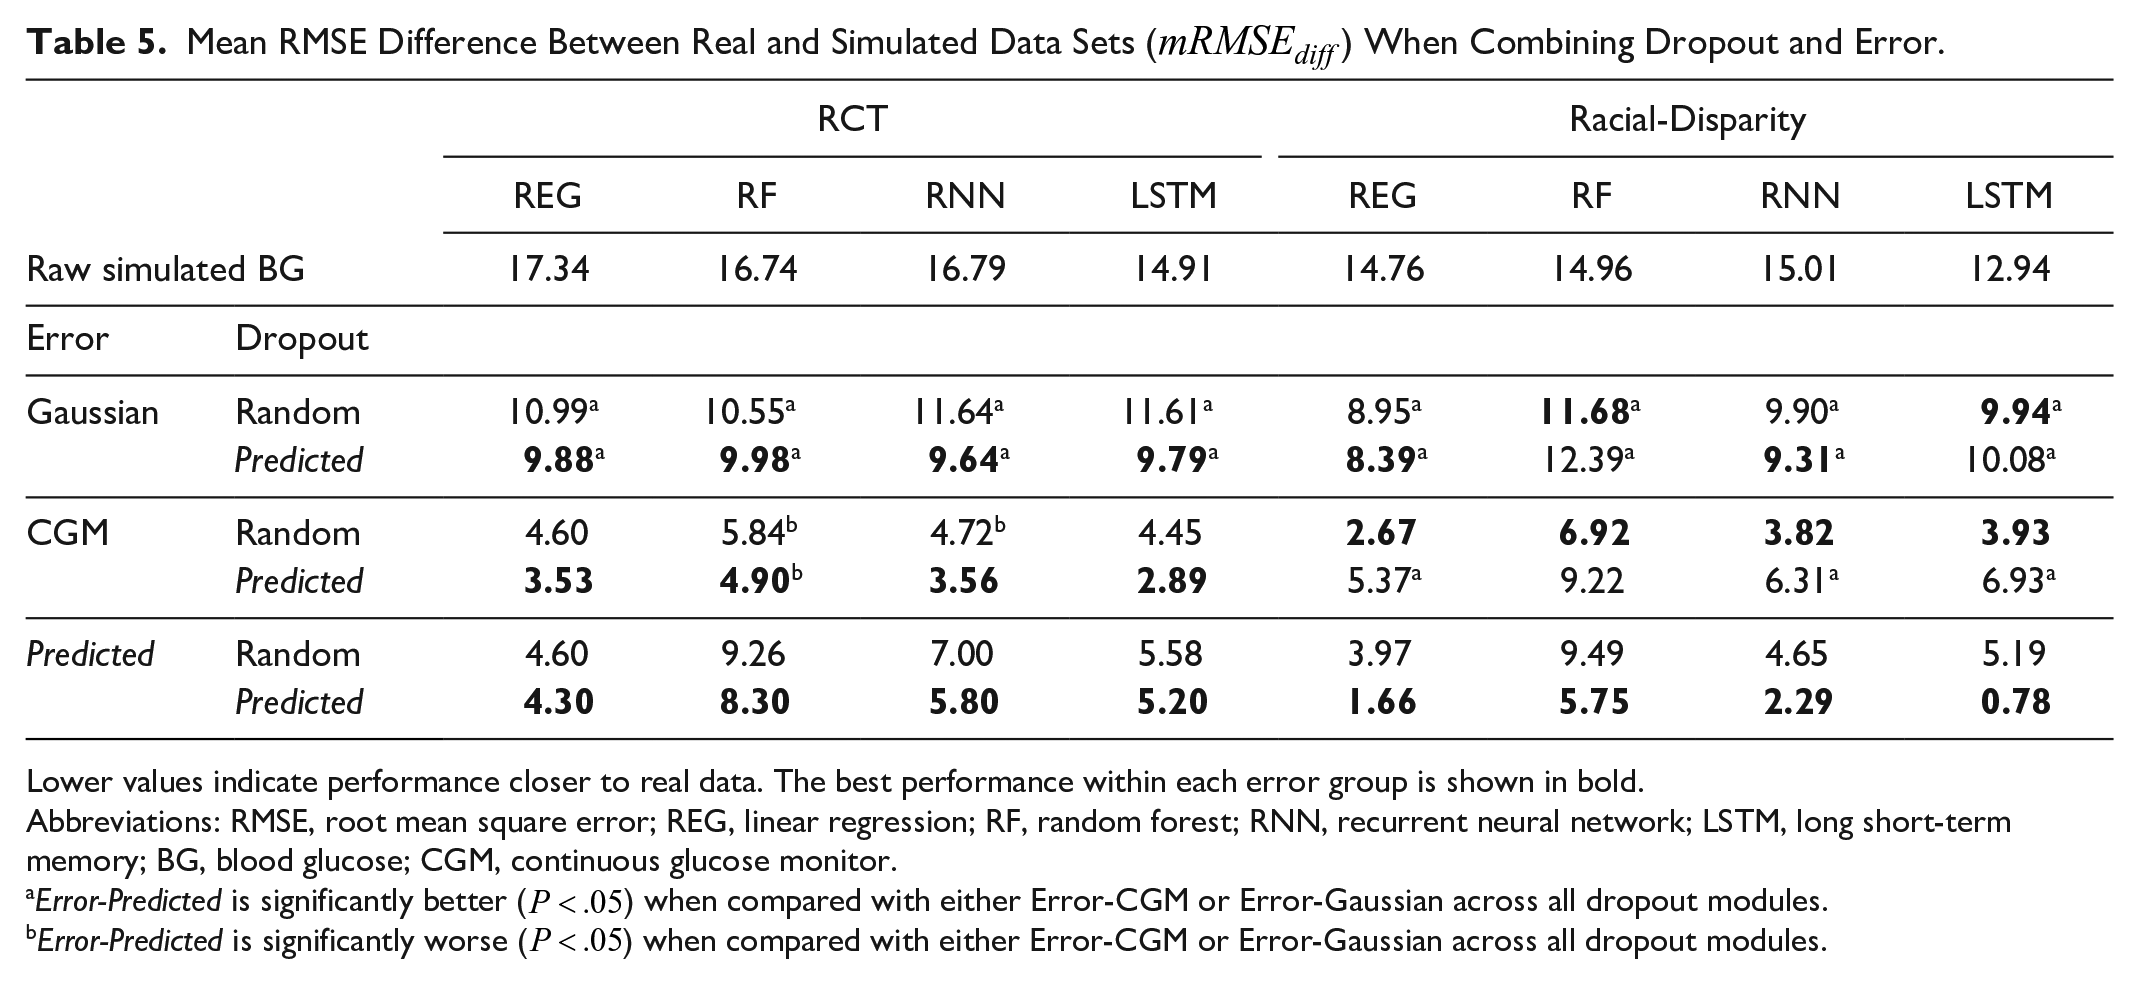
Next, we test BG forecasting performance when our methods for dropout and error are combined, showing that both are needed to further bring simulated data performance closer to real data. For each error module, we vary the dropouts applied to it and report the
Mean RMSE Difference Between Real and Simulated Data Sets (
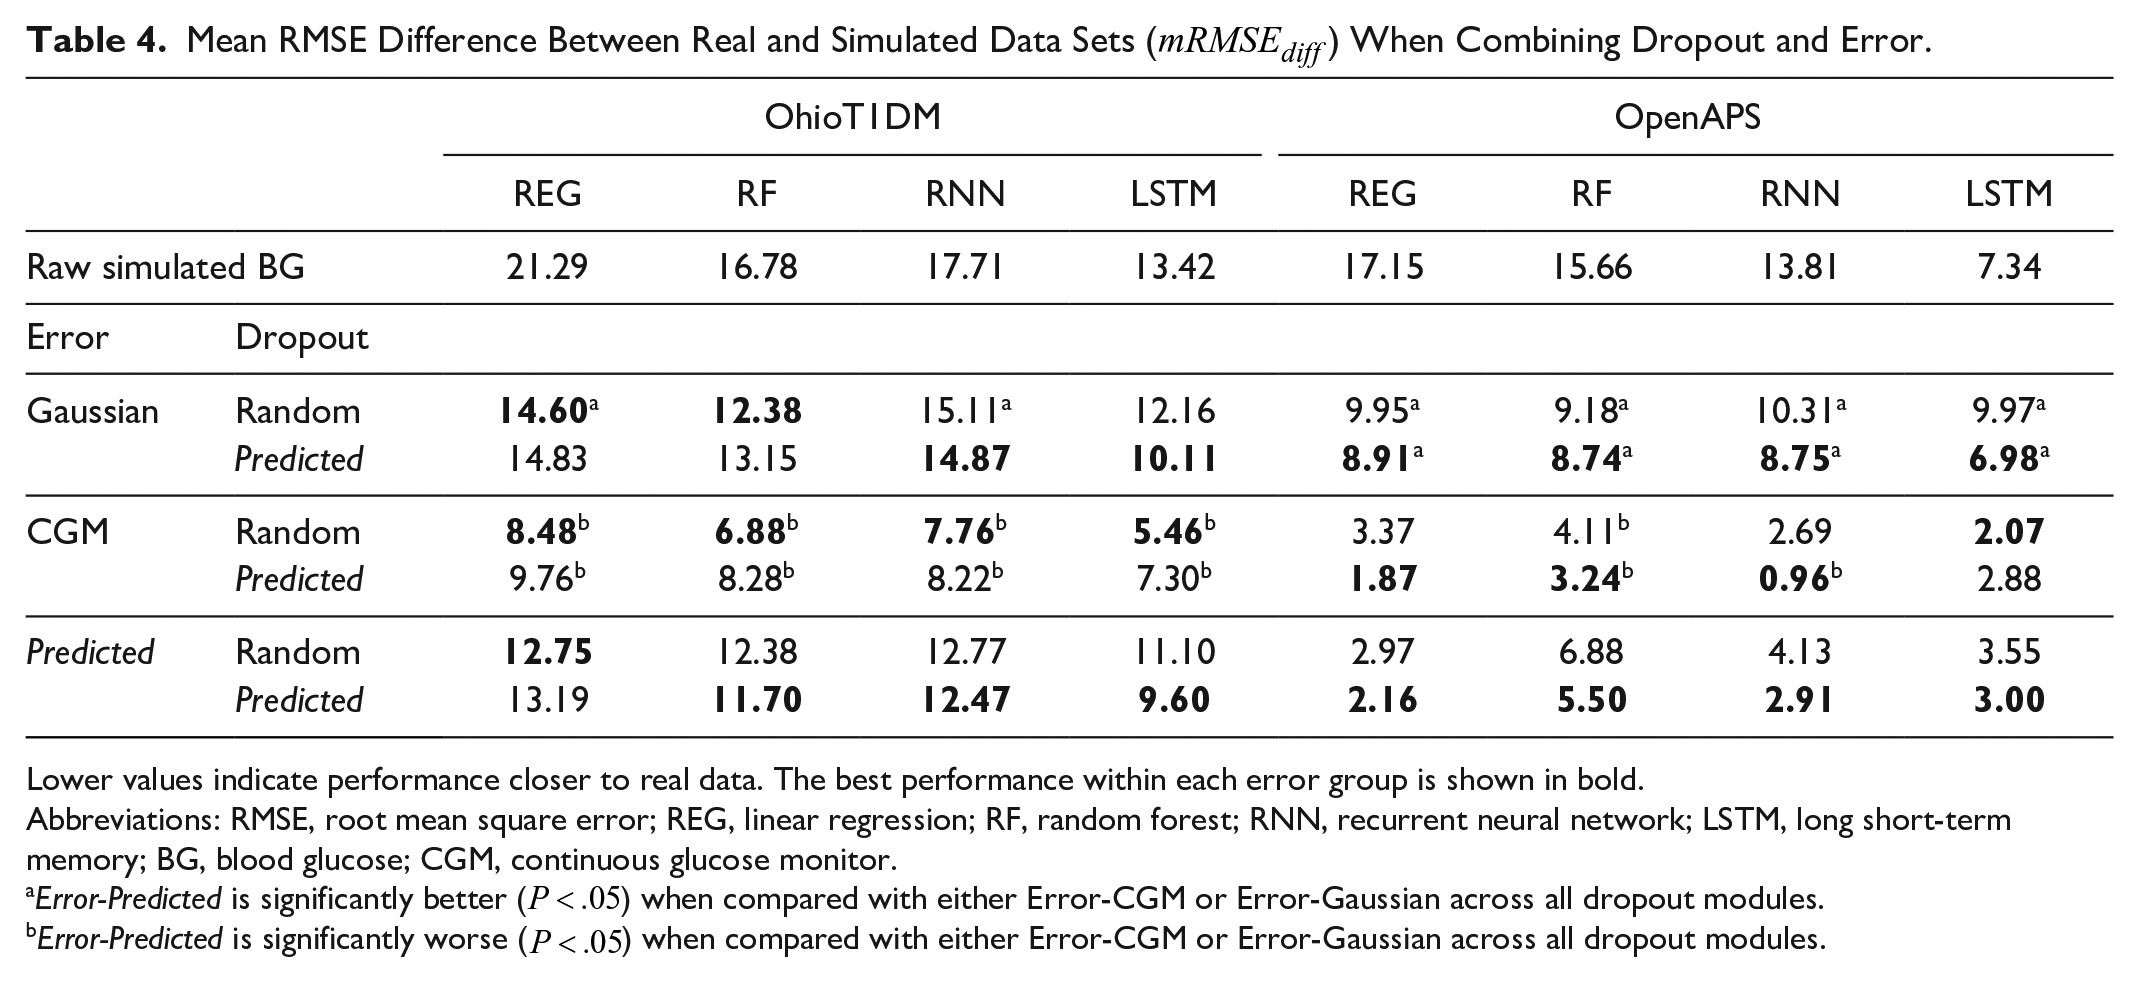
Lower values indicate performance closer to real data. The best performance within each error group is shown in bold.
Abbreviations: RMSE, root mean square error; REG, linear regression; RF, random forest; RNN, recurrent neural network; LSTM, long short-term memory; BG, blood glucose; CGM, continuous glucose monitor.
Error-Predicted is significantly better (
Error-Predicted is significantly worse (
Mean RMSE Difference Between Real and Simulated Data Sets (
Lower values indicate performance closer to real data. The best performance within each error group is shown in bold.
Abbreviations: RMSE, root mean square error; REG, linear regression; RF, random forest; RNN, recurrent neural network; LSTM, long short-term memory; BG, blood glucose; CGM, continuous glucose monitor.
Error-Predicted is significantly better (
Error-Predicted is significantly worse (
Our combination of methods reduced
Discussion
Simulated BG data are vital for evaluating the performance of BG control and forecasting algorithms as it enables testing under varied conditions (eg, different meal schedules and exercise). However, current simulation methods require prior knowledge and do not guarantee the same performance as real data or replicate data without understanding how data properties affect performance. To address this gap, we introduce DAS, a modular data-driven approach to simulation that allows us to learn specific properties of CGM data and encode them into simulated BG data sets to bring performance closer to real data. All code will be made available on publication. A limitation of our work is the need for ground truth for learning error models. While we use finger-stick BG as ground truth, these values are also subject to error.28,29 This in turn affects our error estimates as our model learns how CGM differs from finger-tick measurements rather than actual BG. In future work, we plan to explore other ways of learning error models without requiring ground truth. Second, as in many ML applications, our approach requires sufficient data to learn reliable models for missingness and error. OhioT1DM was significantly smaller than the others tested, and performance gains on it were thus correspondingly smaller.
Conclusions
We demonstrate that DAS learns the patterns of missing data and errors in several real diabetes data sets. On BG forecasting, adding these properties brings performance on simulated data closer to real data compared with other baselines in most of our real data sets. This has real-world implications as it allows researchers to test algorithms with simulated BG that provides realistic estimates of performance and better understand how different features of the data contribute to performance on ML tasks. Our results motivate a hybrid approach for simulating time series data sets to enable greater control over the types of properties encoded in them. Future work will involve adding more properties like non-stationarity to further aid in simulating more realistic BG values and helping researchers debug their algorithms. Code is available at: https://github.com/health-ai-lab/Data-Augmented-Simulation
Supplemental Material
sj-docx-1-dst-10.1177_19322968231181138 – Supplemental material for Simulating Realistic Continuous Glucose Monitor Time Series By Data Augmentation
Supplemental material, sj-docx-1-dst-10.1177_19322968231181138 for Simulating Realistic Continuous Glucose Monitor Time Series By Data Augmentation by Louis A. Gomez, Adedolapo Aishat Toye, R. Stanley Hum and Samantha Kleinberg in Journal of Diabetes Science and Technology
Footnotes
Abbreviations
AUPRC, area under the precision-recall curve; AUROC, area under the receiver operating curve; BG, blood glucose; CGM, continuous glucose monitor; DAS, data-augmented simulation; GAN, generative adversarial network; LSTM, long short-term memory; REG, linear regression; RF, random forest; RMSE, root mean square error; RNN, recurrent neural network; T1D, type 1 diabetes.
Declaration of Conflicting Interests
The author(s) declared the following potential conflicts of interest with respect to the research, authorship, and/or publication of this article: RSH works as a health care data science consultant for US Retina and has equity in CapsicoHealth, Inc, which are both health care data science firms, but they do not work in the glucose simulation field. SK, LG, and AAT do not have any conflicts of interest.
Funding
The author(s) disclosed receipt of the following financial support for the research, authorship, and/or publication of this article: This work was supported in part by the NLM of the NIH under award umber R01LM011826 with SK as the grant recipient. The funding agency had no involvement in the study or paper preparation.
Supplemental Material
Supplemental material for this article is available online.
References
Supplementary Material
Please find the following supplemental material available below.
For Open Access articles published under a Creative Commons License, all supplemental material carries the same license as the article it is associated with.
For non-Open Access articles published, all supplemental material carries a non-exclusive license, and permission requests for re-use of supplemental material or any part of supplemental material shall be sent directly to the copyright owner as specified in the copyright notice associated with the article.