
Abstract
Background:
In this work, we leverage state-of-the-art deep learning–based algorithms for blood glucose (BG) forecasting in people with type 1 diabetes.
Methods:
We propose stacks of convolutional neural network and long short-term memory units to predict BG level for 30-, 60-, and 90-minute prediction horizon (PH), given historical glucose measurements, meal information, and insulin intakes. The evaluation was performed on two data sets, Replace-BG and DIAdvisor, representative of free-living conditions and in-hospital setting, respectively.
Results:
For 90-minute PH, our model obtained mean absolute error of 17.30 ± 2.07 and 18.23 ± 2.97 mg/dL, root mean square error of 23.45 ± 3.18 and 25.12 ± 4.65 mg/dL, coefficient of determination of 84.13 ± 4.22% and 82.34 ± 4.54%, and in terms of the continuous glucose-error grid analysis 94.71 ± 3.89% and 91.71 ± 4.32% accurate predictions, 1.81 ± 1.06% and 2.51 ± 0.86% benign errors, and 3.47 ± 1.12% and 5.78 ± 1.72% erroneous predictions, for Replace-BG and DIAdvisor data sets, respectively.
Conclusion:
Our investigation demonstrated that our method achieved superior glucose forecasting compared with existing approaches in the literature, and thanks to its generalizability showed potential for real-life applications.
Keywords
Introduction
Over the past 40 years, major efforts have been undertaken in the field of diabetes technology to develop decision support systems and automated insulin delivery systems for blood glucose (BG) management in individuals with type 1 diabetes (T1D). These systems are generally built around a model of glucose-insulin metabolism that is used to forecast future BG levels utilized to compute therapy interventions.
In such contributions, past glucose values, typically recorded by a continuous glucose monitoring (CGM) device, along with various physiological data including carbohydrate (CHO) intakes, fast-acting and slow-acting insulin doses, 1 or recorded physical activity (PA) and daily routines 2 are considered to predict future BG levels for different prediction horizons (PHs).
Numerous approaches have been taken in the diabetes technology literature to propose glucose predictive models, the majority being based on polynomial and state-space models.3-10 Thanks to the increased availability of real-life data collected for long-period trials, machine learning (ML) techniques have become increasingly popular and have been successfully employed to solve the BG prediction problem. In particular, early prior studies exploited random forest, multivariate adaptive regression splines, 11 k-nearest neighbor, 12 decision tree, 13 gradient-boosted regression tree, 14 and support vector regression (SVR).15,16 However, the primary shortcoming of these classic ML methods is that they all require human feature extraction, and their success is highly dependent on the quality of feature engineering and statistical analysis of the data used to train them. 17
More recently, the diabetes technology community has witnessed a booming interest in the application of Artificial Neural Networks to the purpose of BG prediction, mainly due to their ability to perform automatic feature extraction, and hence eliminating the need of feature engineering. For example, Zhu et al 18 proposed a convolutional neural network (CNN)-based model and Li et al 19 introduced GluNet, a deep neural network (DNN) framework, leveraging dilated convolutional layers, to improve the CNN performance and demonstrated that GluNet outperformed rival models, including autoregressive with exogenous inputs (ARX), SVR, and neural network for predicting glucose on in silico patients. Mirshekarian et al 20 proposed a recurrent neural network (RNN) architecture with long short-term memory (LSTM) units trained and evaluated on a data set of five patients containing approximately 400 days’ worth of data, for predicting BG up to 60-minute PH. They claimed that an LSTM trained on raw data from real patients may outperform SVR and polynomial models that were trained using manually derived features from the same data set. Li et al 21 introduced a convolutional recurrent neural network (CRNN) to estimate the BG level for up to 60-minute PHs based on prior CGM data and information on meal and insulin intakes, presenting results for both simulated and real patients.
Some of these studies have used simulated data for the evaluation of their proposed methodologies, which although are important for evaluating the feasibility of the models, they lack some challenges that are in real-life data, such as missing points in data, extreme or unusual environmental conditions, and medication interferences outliers. Moreover, in cases where data from real T1D patients were used, the sample size was small, which, albeit good for initial evaluation, precludes application to a large number of T1D patients due to the high rate of intersubject variability in glucose trends.
That said, our objective in this research is to build on our past work 22 to develop a new forecasting model for BG, built using a CNN-LSTM stacked architecture, overcoming the limitation of manual feature engineering, and evaluate its effectiveness on real patients’ data collected both in-hospital and in the outpatient setting for predicting future BG after 30, 60, and 90 minutes of PH.
The remainder of the article is structured in the following manner. The "Experimental Condition" section describes the details and preprocessing of the data sets. The "Methods" section goes into the details about our proposed architecture and prediction approach. Then, the obtained results are presented in the "Experimental Results" section and discussed in detail in the "Discussion" section . Finally, the "Conclusion and Future Work" section summarizes this study.
Experimental Conditions
Two distinct data sets of patients with T1D were used in this study, each of which contained information about meals, insulin boluses (slow and fast acting), and CGM values:
Replace-BG data set: 23 The data were collected from 168 adults (93 males/75 females), aged 47.2 ± 13.1 years, with a history of T1D ranging from 1 to 40 years, who were using an insulin pump, had HbA1c <8.5%, participating in a 26-week clinical trial in free-living conditions. We used three features from this data set: interstitial glucose (mg/dL) measured by Dexcom G4 Platinum, insulin boluses (U), and CHO content (mg).
DIAdvisor data set: In the research project DIAdvisor, 24 data were collected from 59 T1D patients (37 males/22 females), aged 43.4 ± 11.7 years, disease duration 18.8 ± 10.7 years, BMI 23.9 ± 2.4 kg/m2, HbA1C 7.8 ± 1.6%, 27 multiple daily injections, and 32 continuous subcutaneous insulin infusion participating in a three-day in-hospital study. We considered seven features from this data set: interstitial glucose (mg/dL) measured by Abbott Freestyle; self-reported insulin intakes (U) for basal, bolus, and correction doses; and meal nutrients content (g) for CHO, protein, and lipids.
Data Preprocessing
Missing CGM data points in the Replace-BG data set, for gaps less than 60 minutes, were estimated using linear interpolation. 25 No interpolation was attempted in circumstances when the interval between two consecutive points was greater than 60 minutes, as this could cause the model to learn the estimated sequence rather than the genuine values, and when this was the case the entire corresponding day of the missing data was discarded. 26 Following that, the CGM variable was uniformly resampled every 15 minutes in both data sets, and insulin and meal characteristics were averaged within each 15-minute time interval. Next, we normalized each time series with regard to its own lowest and maximum values, resulting in the entire data set being in the range (0,1), to improve the prediction accuracy. 27 In the output of the model, an inverse transform was used to map the features back to their actual values.
Train-Test Splitting: Forward Chaining (FC)
In timeseries prediction problems, conventional cross-validation, that is typical random train/test splitting strategies, cannot be used because there is a temporal dependency between the data samples. Hence, to account for this temporal dependency as well as to avoid data leakage from training to test sets, we employ FC, a technique to split the data on a rolling basis, well-suited for sequential and timeseries data sets. For this purpose, the model is trained on an 80% subset of patients and forecast for the remaining 20% which are test patients. Through a rolling basis process, the same forecasted patients are then included as part of the next training data set and model is tested on a new 20% subset of patients. It should be noted that, in each splitting scenario, the model is trained/tested independently on each subset, and the final result is computed by averaging over all split subsets to obtain a robust estimate of the model’s performance. 28 It should be emphasized that for each train-test partition created by FC, preprocessing steps are performed only to the train set; the test set is excluded from the preprocessing steps because it is presumed to be unseen data.
To train the model, the train-set is divided into 80/20 training and validation subsets, using FC algorithm, which allows for an unbiased evaluation of a model’s fit to the training data set during the training process and helps ensure consistent performance.
Methods
Figure 1 depicts the proposed CNN-LSTM model. Windowed Samples of past data with length three times the PH (
where N is the total number of windowed samples and are the actual and predicted glucose concentration (GC) values at time.
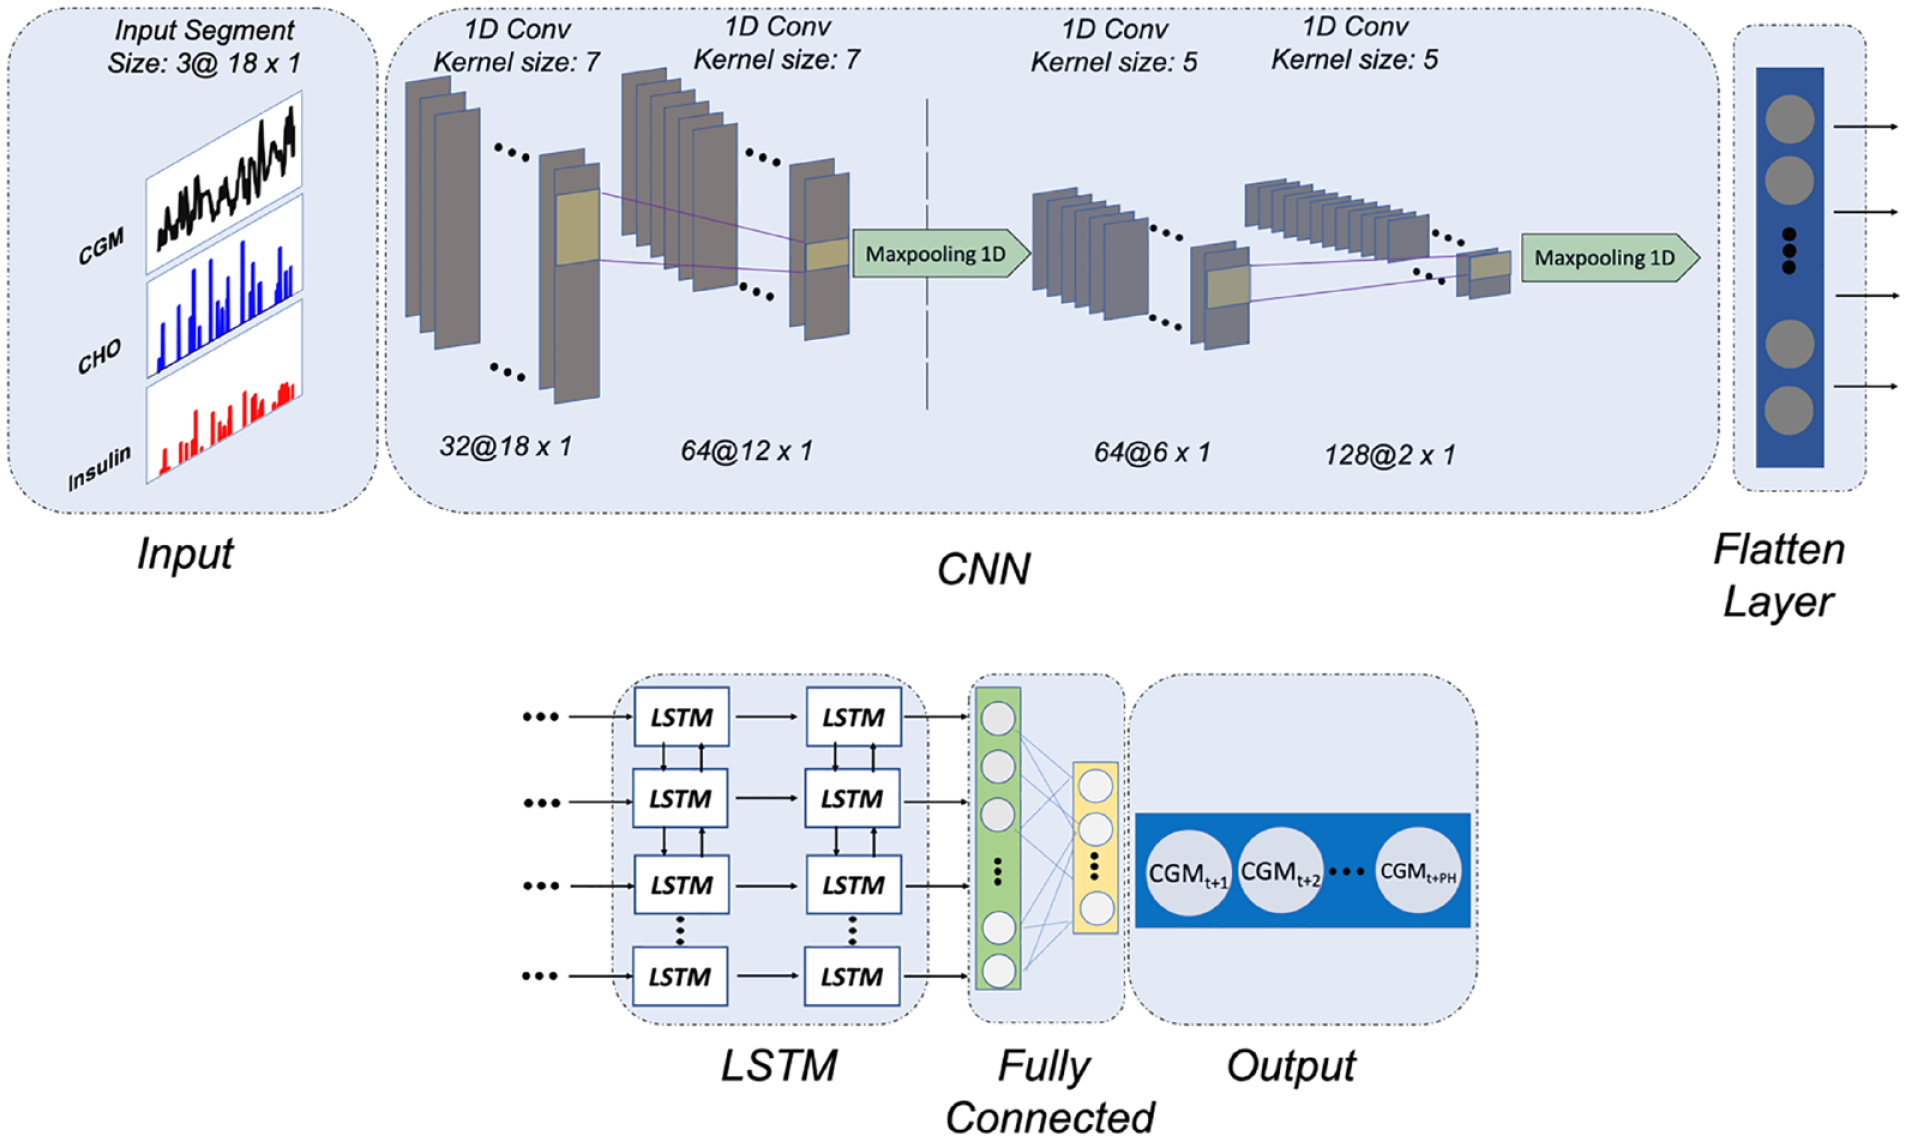
The proposed CNN-LSTM architecture for 90-minute PH BG prediction.
To avoid overfitting the model to the training data set and obtain a more generalizable model, dropout layers are used between each LSTM layer. Also, after each convolutional layer, a batch normalization operation is performed to re-center and rescale the layer’s input to reduce the internal covariance shift.
Training Hyperparameters
We use the TensorFlow 2.0 framework 29 to implement the proposed CNN-LSTM model. Manual hyperparameter tuning with expert knowledge was performed such that more than 20 different sets of hyperparameters, including number of neurons, activation functions, optimizers, learning rates, and batch sizes, were tested to have more control over the process and see how different hyperparameter scenarios may affect the model performance. Due to the length differences between the two data sets, batch sizes of 32 and 256 are used to optimize the parameters using the root mean square propagation method with an initial learning rate of 0.0001 and a moving average value of 0.9. Training is carried out for 500 epochs with an early stop point by monitoring changes in validation loss throughout a 50-epoch period.
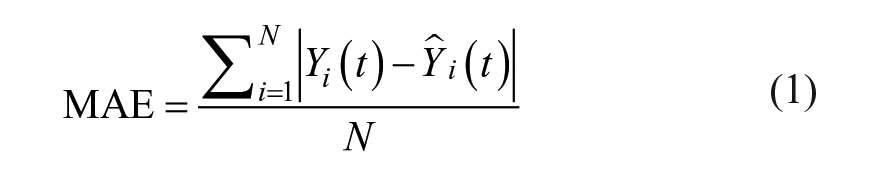
To evaluate the accuracy of the prediction, three metrics were employed: MAE, the root mean square error (RMSE), and the coefficient of determination (R2), given in Equations (1-3):
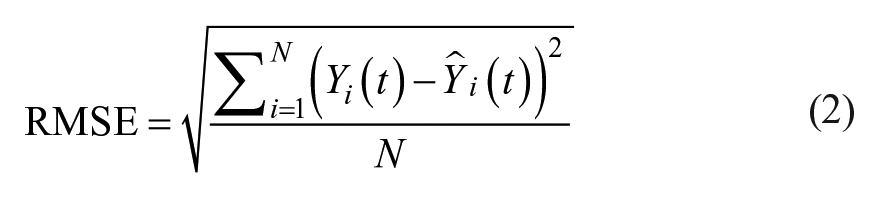
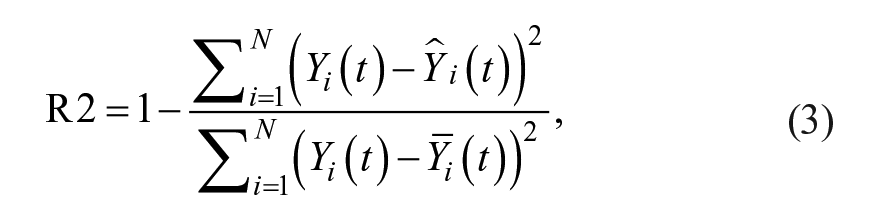
where N is the total number of windowed samples and denotes the actual and predicted GC values at time, respectively, and in R2 is the average of all samples.
The choice of the abovementioned metrics enables us to compare our suggested predictor to previously published methods. In addition, to assess the suggested algorithm’s clinical acceptability, we used the continuous glucose-error grid analysis (CG-EGA).30,31
Comparison With Other Methods
The predictive performance of our proposed CNN-LSTM model was compared against the ARX in, 6 the SVR model proposed in, 32 the LSTM model and the CRNN model proposed in. 21 Autoregressive with exogenous inputs is a good reference model since it has been used in many studies in the diabetes literature. Moreover, the choice of SVR models was motivated by the fact that among ML methods SVR has demonstrated promising clinical acceptability, 33 whereas LSTM, designed with the same architecture as the LSTM section of the proposed CNN-LSTM model, allows us to demonstrate the advantage of the added convolutional layers for prediction. In addition, since CRNN, which is comprised of three convolutional and one LSTM layer, and its modifications has shown promising results in various studies,21,34 we implemented it based on the code repository provided in. 34 For the SVR model, we use the radial-basis function as the activation function, with a value of 0.0002 and C = 0.5, while for the LSTM we use a two-layered LSTM architecture with 100 memory units per layer, followed by two fully connected layers with [32, 2], [32, 4], and [64, 6] number of neurons for 30-, 60-, and 90-minute PH, respectively. Exponential linear unit and tangent hyperbolic activation functions were used for LSTM and fully connected layers, respectively, the same as the LSTM block of the proposed CNN-LSTM model.
Experimental Results
Population-Wise Analysis
One of the major challenges for the glucose predictive models is the intersubject variability of the effect of insulin intake, meals, and other events on glucose dynamics. In this study, given the two data sets with large sample size, we can investigate the robustness of our model in dealing with this challenge. Table 1 shows population mean and standard deviation (STD) values of MAE (mg/dL), RMSE (mg/dL), and R2 (%) metrics when predicting future BG level for all T1D patients in both data sets. The highlighted values show the best performing algorithm for each PH. We observe that the performance of the proposed CNN-LSTM model is comparable with that of the LSTM for 30-minute PH for both data sets; however, for longer PHs, our method consistently outperforms all the other models by significantly reducing MAE and RMSE and increasing R2 values, in both data sets.
Population Mean ± (Standard Deviation) of Accuracy Metrics (MAE, RMSE, and R2) of Forecasting the BG Level for 30-, 60-, and 90-Minute PH for the Replace-BG and DIAdvisor Data sets.
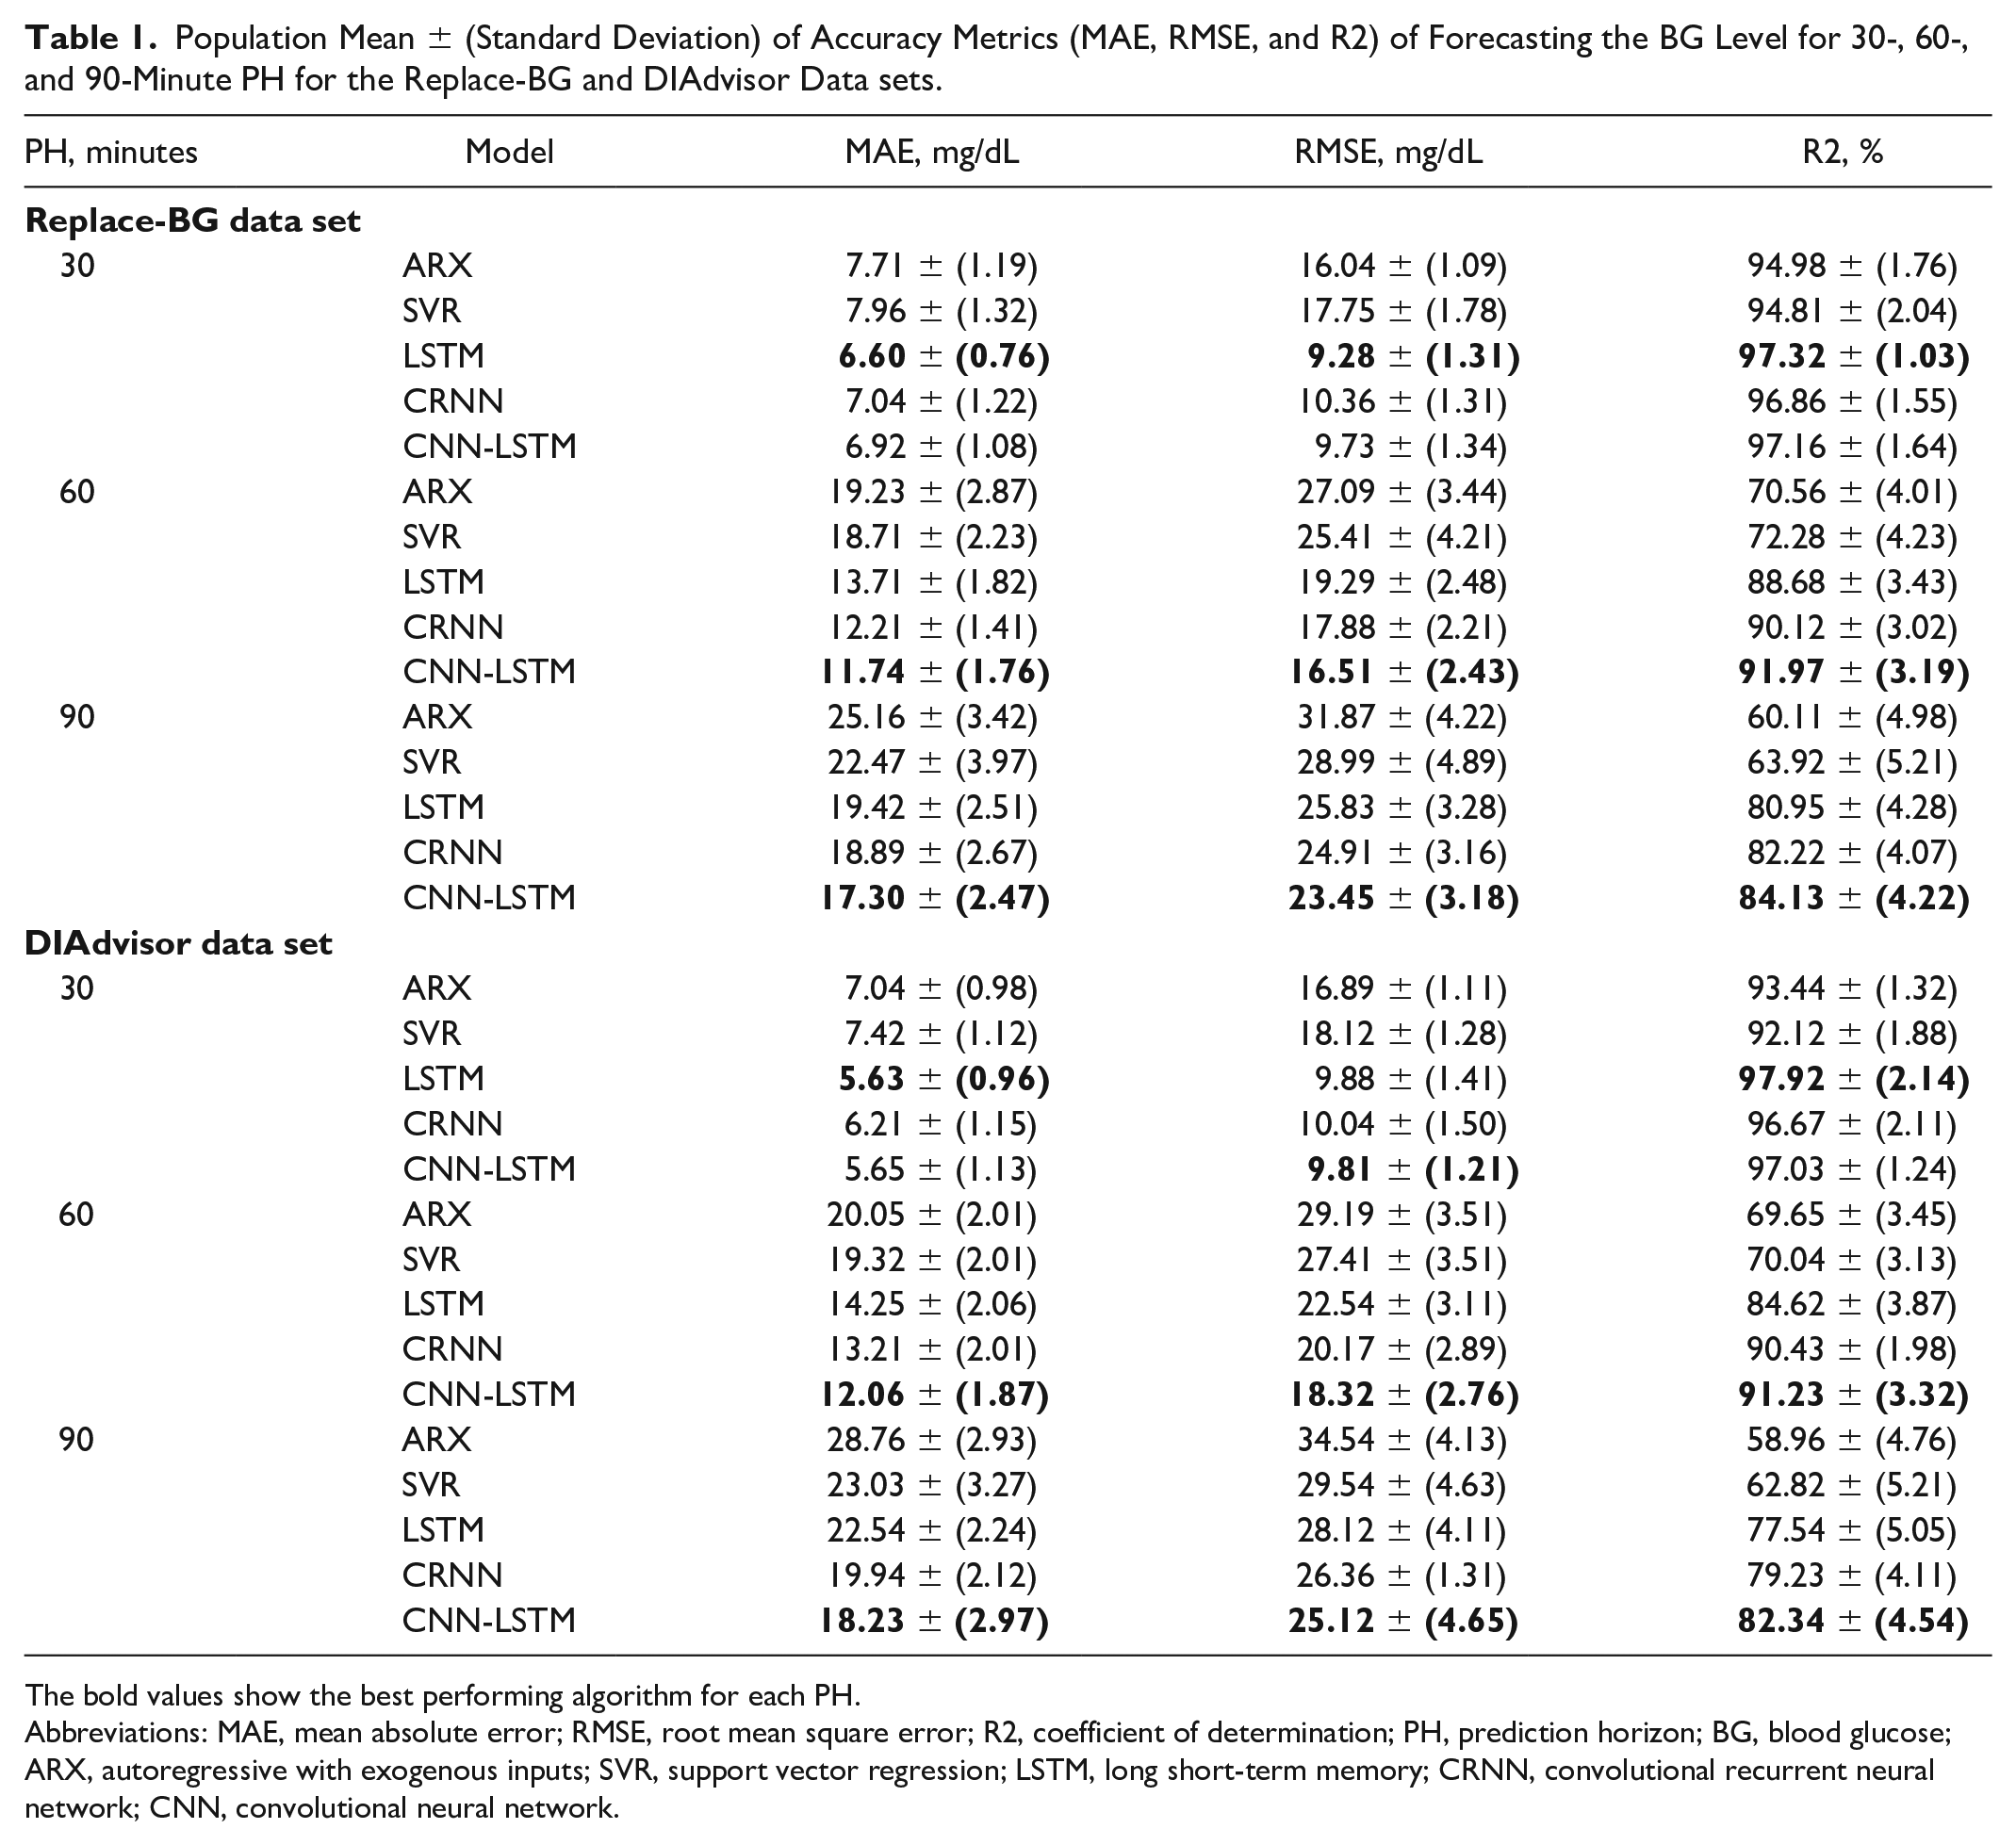
The bold values show the best performing algorithm for each PH.
Abbreviations: MAE, mean absolute error; RMSE, root mean square error; R2, coefficient of determination; PH, prediction horizon; BG, blood glucose; ARX, autoregressive with exogenous inputs; SVR, support vector regression; LSTM, long short-term memory; CRNN, convolutional recurrent neural network; CNN, convolutional neural network.
Table 2 summarizes the results in terms of the CG-EGA. The CNN-LSTM model that we propose outperforms the reference models across all PHs, with a higher percentage of accurate predictions (notice for instance 94.71 ± 3.89% for Replace-BG data set and 91.71 ± 4.32% for DIAdvisor data set, on the 90-minute PH) and less erroneous predictions (3.47 ± 1.12% for Replace-BG and 5.78 ± 1.72% for DIAdvisor data set, on the 90-minute PH) making it acceptable for clinical applications. Figure 2 illustrates an example of the CG-EGA plot of a representative patient from Replace-BG data set. It is observable that a significant proportion of predicted samples fall within the range A of both P-EGA and R-EGA, when compared with the associated true glucose values.
Predictions for 30-Minute PH by the ARX, SVR, LSTM, CRNN, and CNN-LSTM Models for a Representative Patient From the Replace-BG Data set, for a Three-Day Duration.
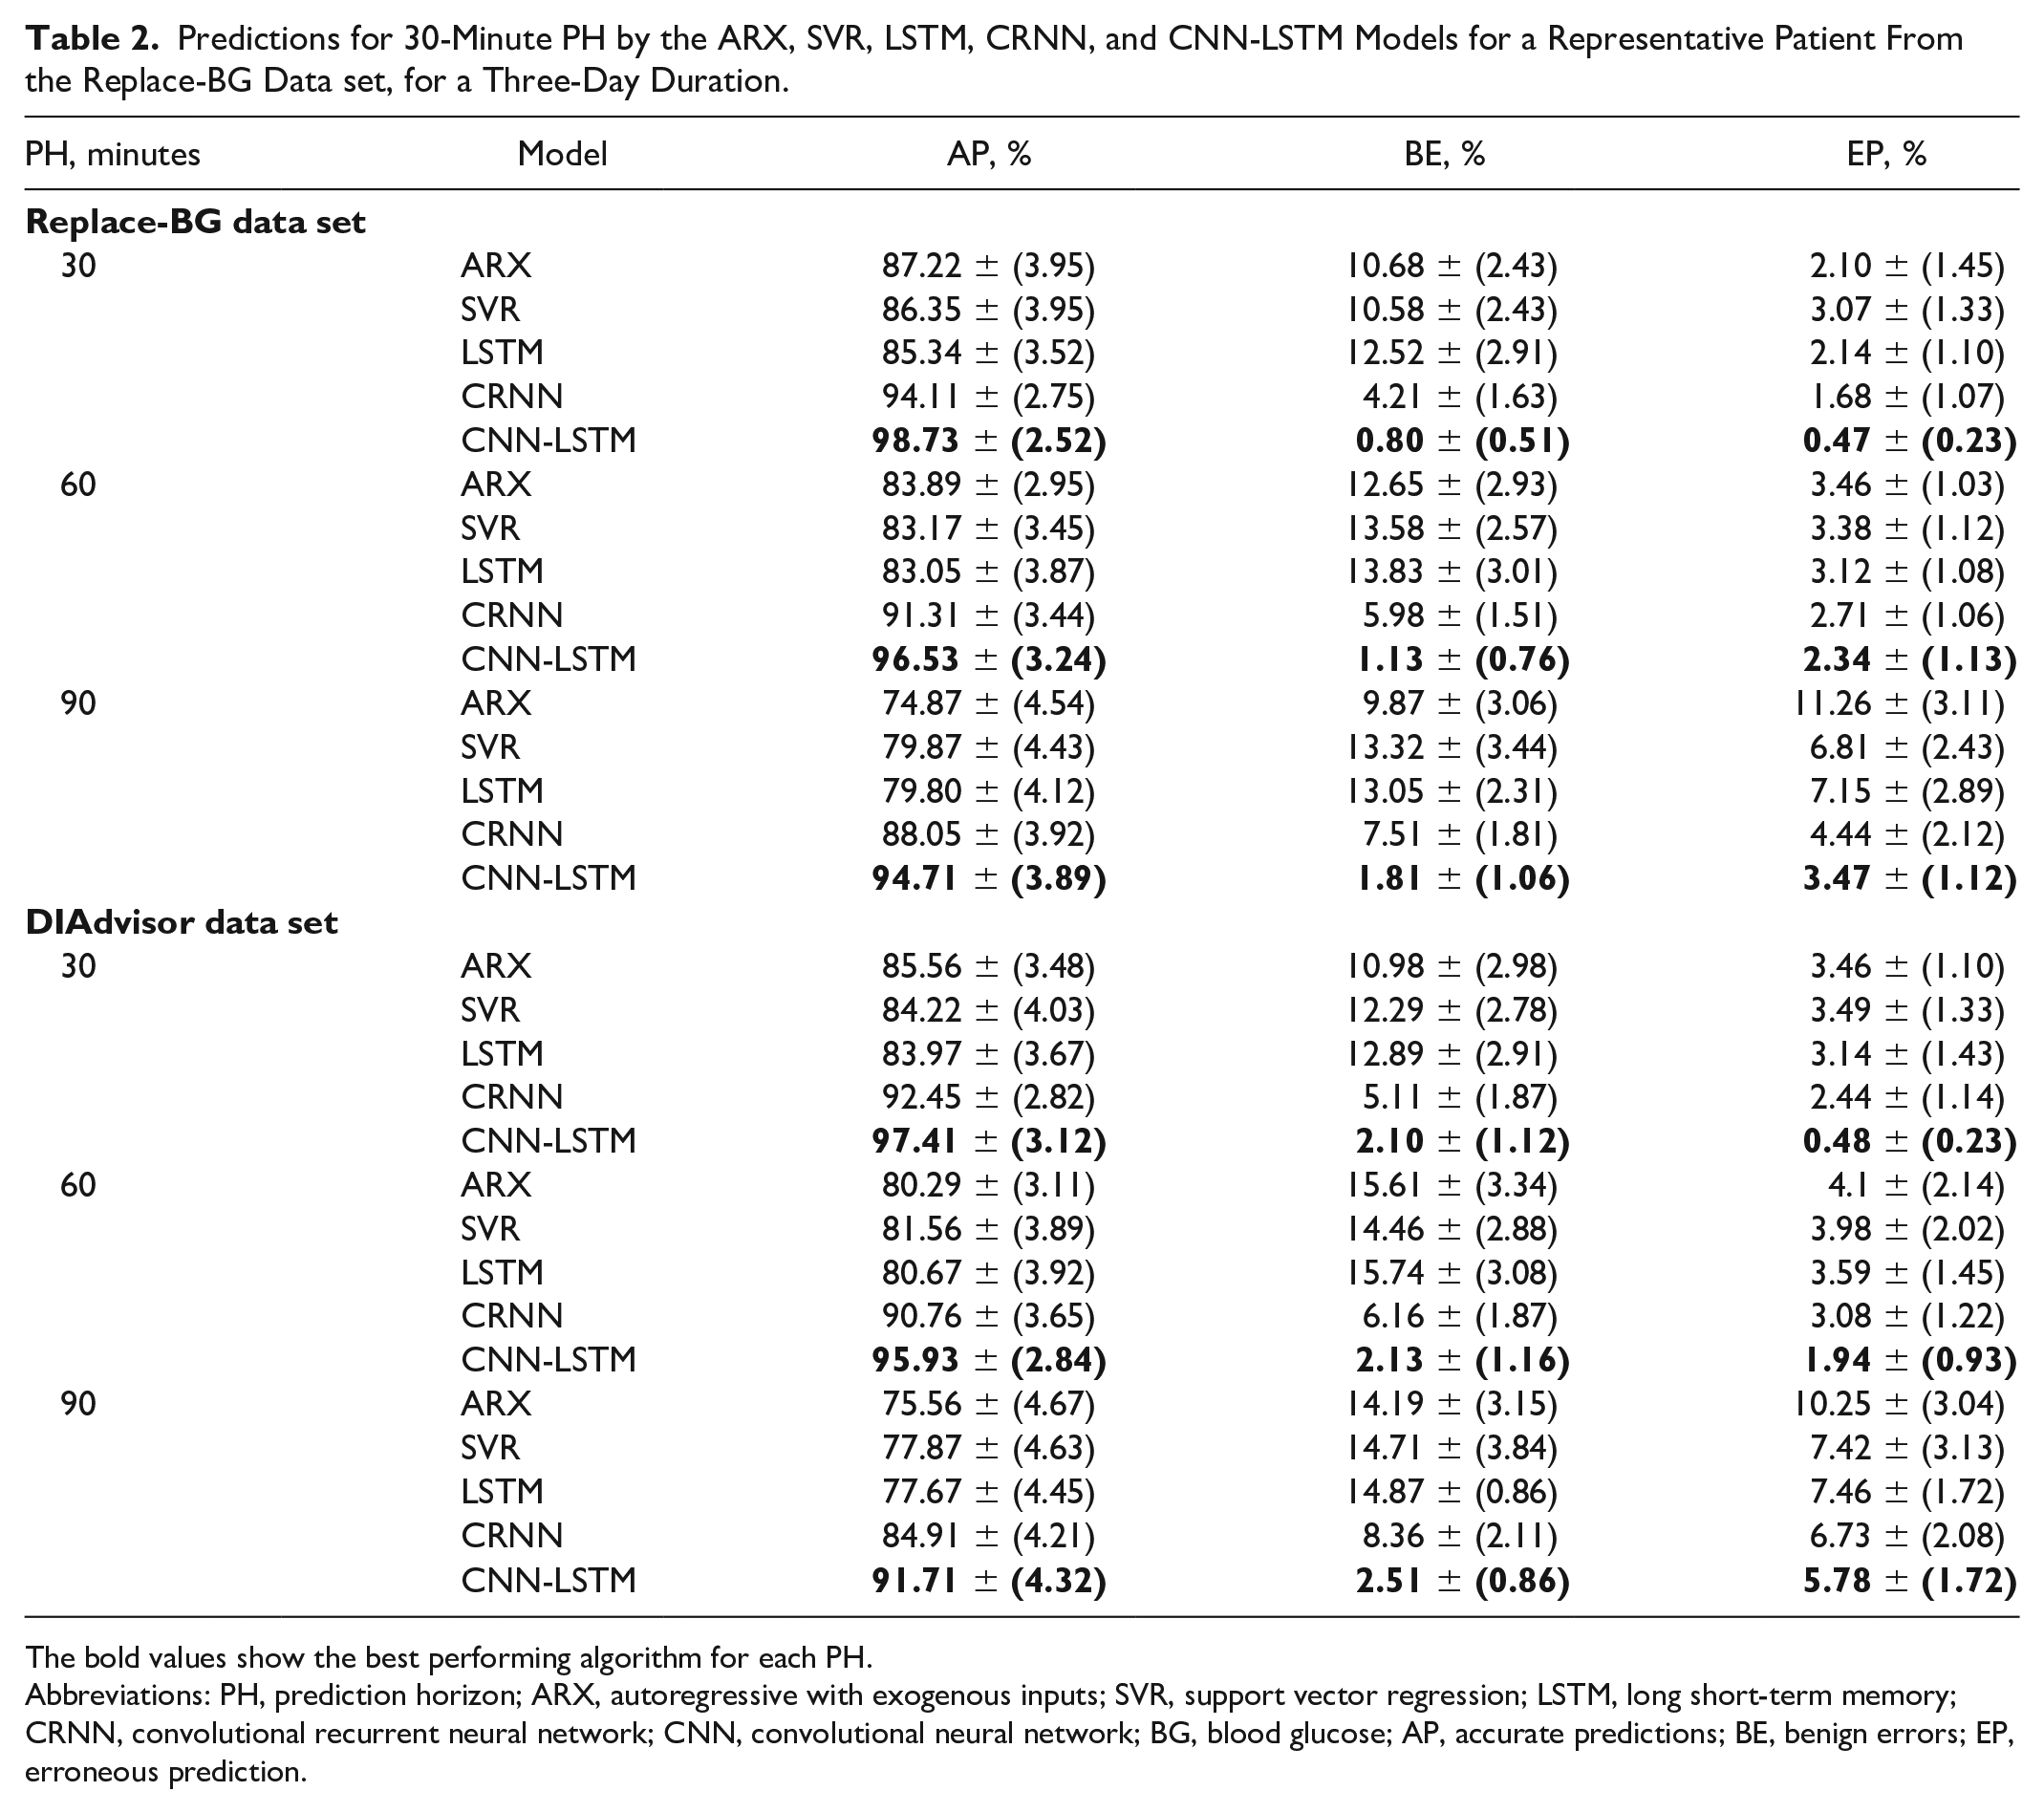
The bold values show the best performing algorithm for each PH.
Abbreviations: PH, prediction horizon; ARX, autoregressive with exogenous inputs; SVR, support vector regression; LSTM, long short-term memory; CRNN, convolutional recurrent neural network; CNN, convolutional neural network; BG, blood glucose; AP, accurate predictions; BE, benign errors; EP, erroneous prediction.
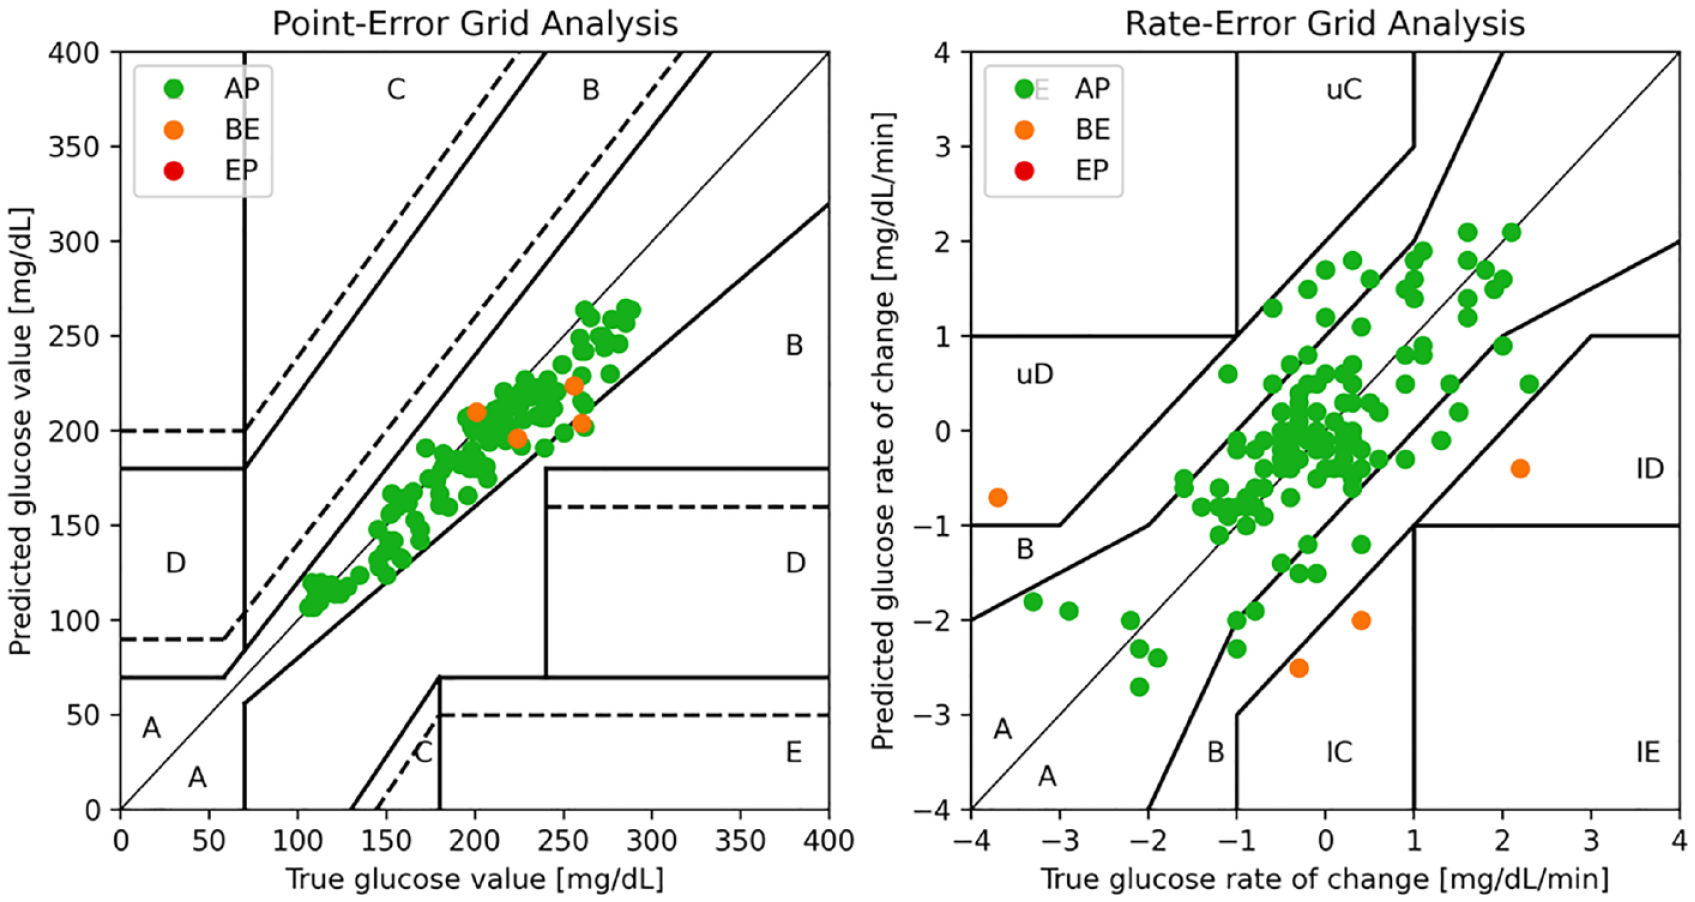
A representative example of CG-EGA with P-EGA (left) and R-EGA (right) components.
Our results demonstrate that our suggested strategy outperforms the polynomial, ARX, and conventional ML-based techniques, SVR as well as the LSTM model, acknowledging the advantage of adding up the CNN to the LSTM network. In addition, due to the optimized model structure and hyperparameter selections, our model performs better in terms of both the prediction accuracy and the clinical acceptability comparing with CRNN, which comprised CNN and RNN.
Figure 3 depicts a three-day period of recorded data for a representative participant from the Replace-BG data set, compared against the 60-minute-ahead predictions obtained with the considered models. It is observable that CNN-LSTM outperforms all the other methods in capturing the trends and fluctuations with greater accuracy, which is congruent with the corresponding MAE, RMSE, and R2 values. We would like to remind readers that inference results are generated by testing each model on data from previously unseen patients.
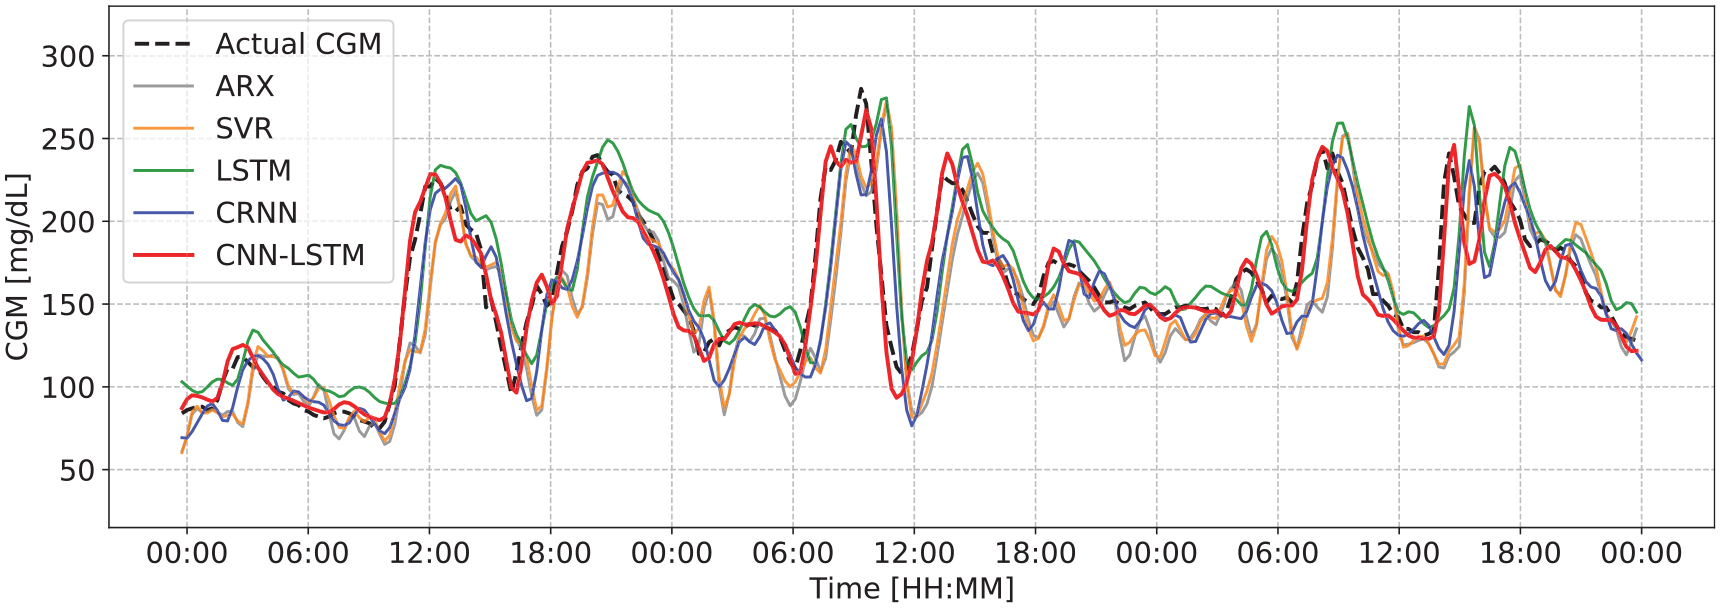
Actual CGM value compared with the predictions for 60-minute PH by the ARX, SVR, LSTM, CRNN, and CNN-LSTM models for a representative patient from the Replace-BG data set, for a three-day duration.
The boxplots in Figure 4 depict results obtained from our proposed model for each metric across all patients in the Replace-BG (top) and DIAdvisor (bottom) data sets, respectively. Although degrading for longer PHs, predictions remain within a somewhat reasonable range, demonstrating the robustness of the proposed model against intersubject variability of glucose dynamics in both data sets.
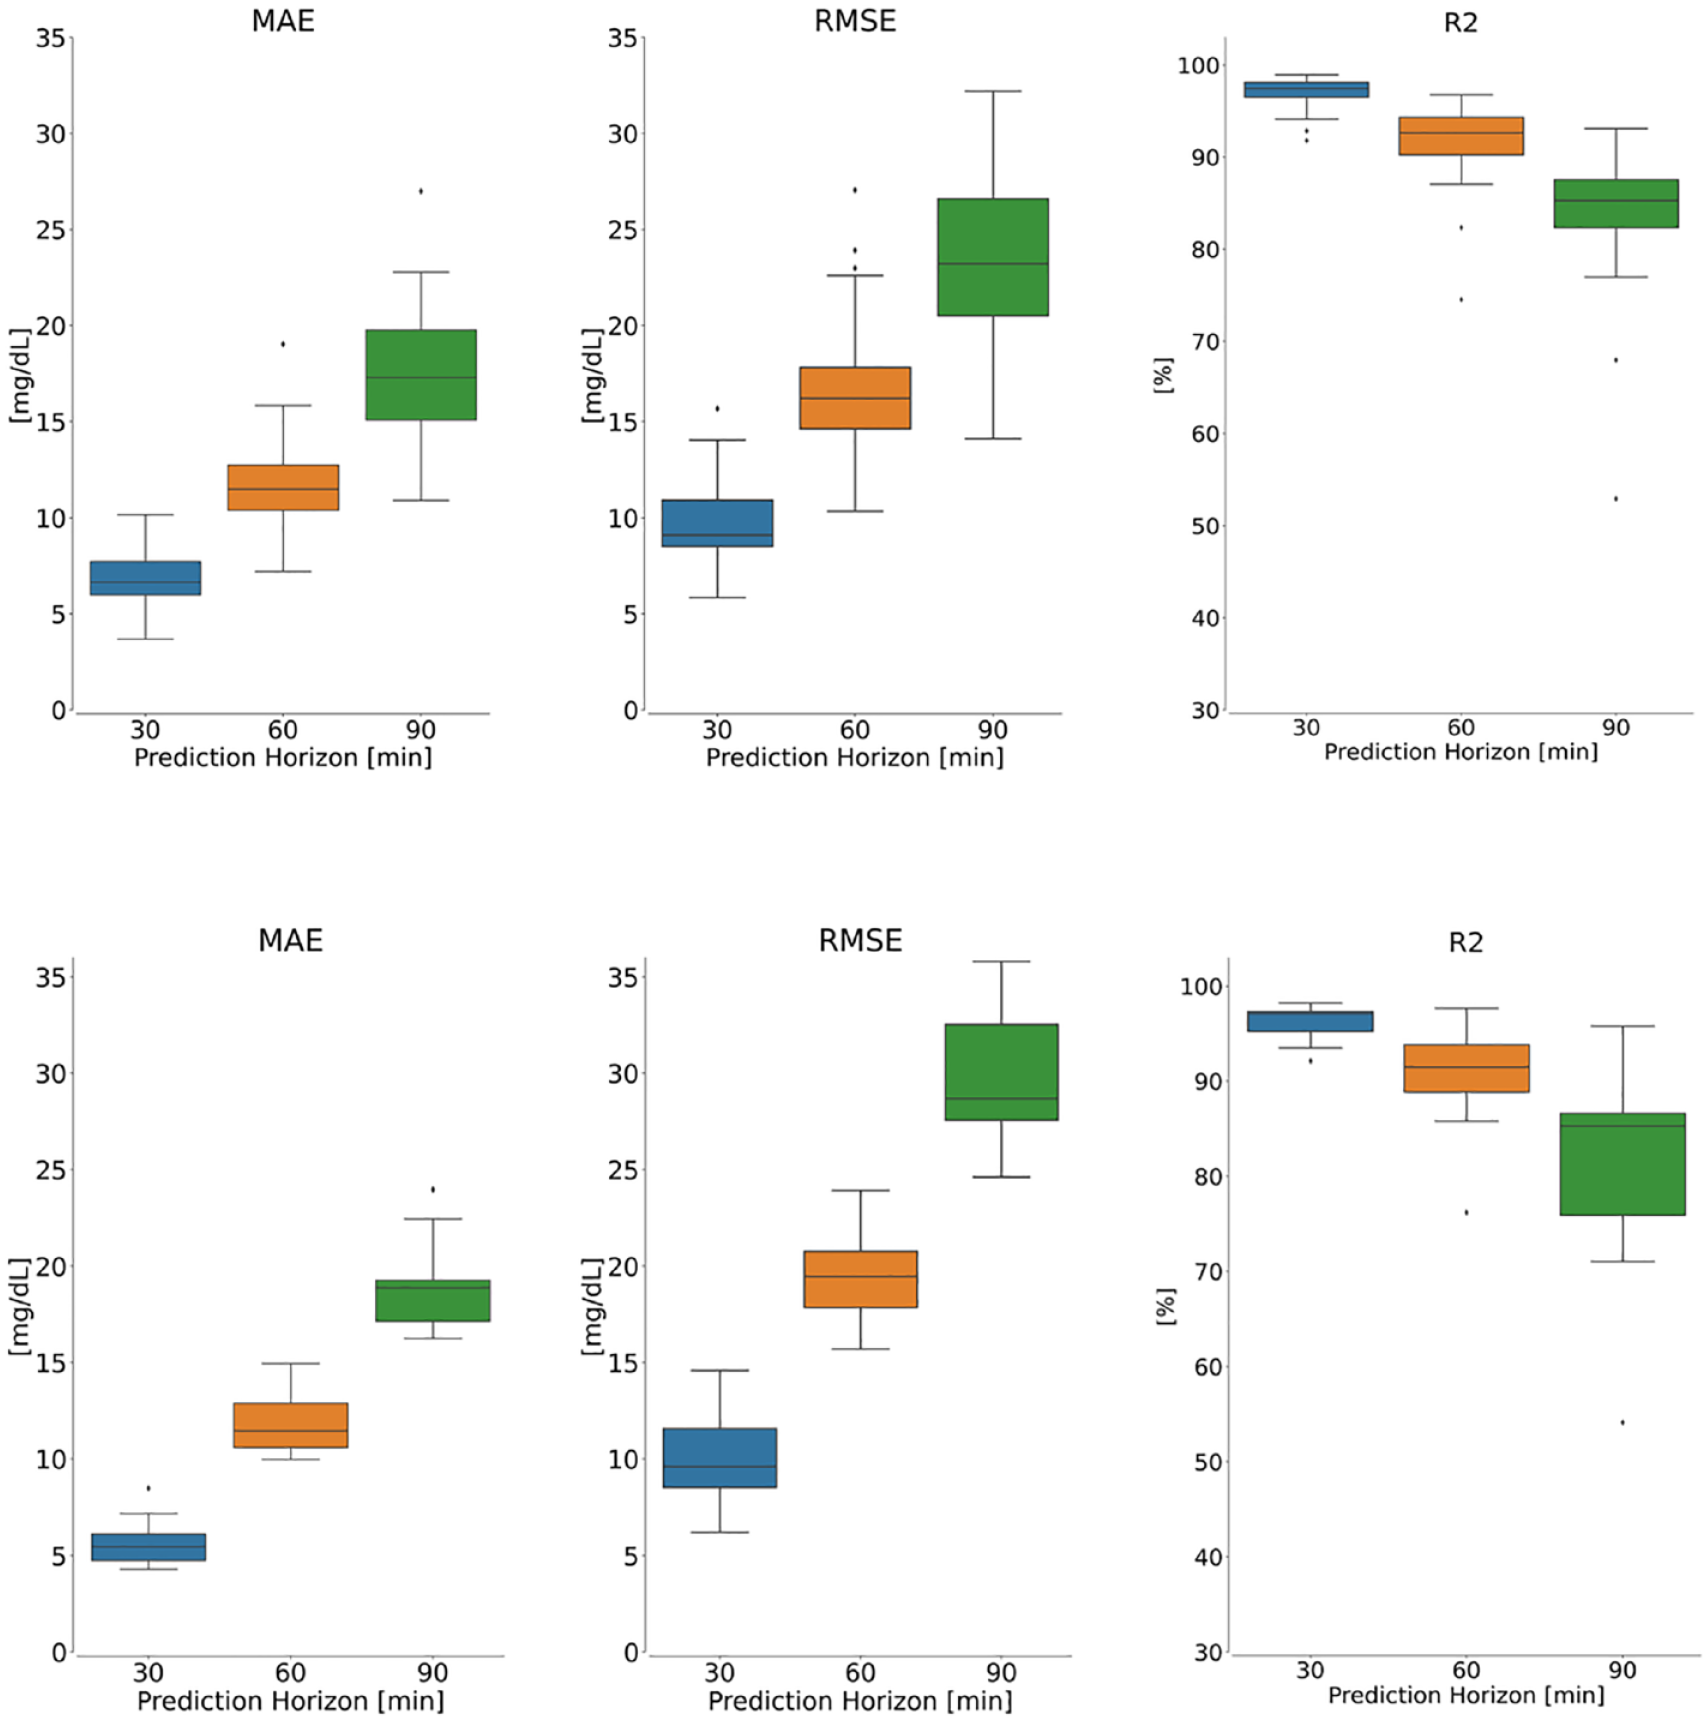
Performance evaluation of the proposed model on the Replace-BG (top panel) and DIAdvisor (bottom panel) data sets for three different PHs over test patients. Left: MAE, middle: RMSE, and right: R2.
To assess the performance of the proposed model for different PHs, Figure 5 demonstrates examples of CGM prediction using CNN-LSTM with different PHs for six representative patients. In each case, the solid red line represents the historical window, while the blue, orange, and green lines represent CNN-LSTM-estimated forecast time series for 30-, 60-, and 90-minute PH, respectively. While the model for 30-minute PH clearly outperforms the others, the models for longer PHs continue to perform well by forecasting the rapid increases and decreases in ground truth (dashed red line), which may result in hyperglycemia or hypoglycemia, respectively, which is in our best interest.
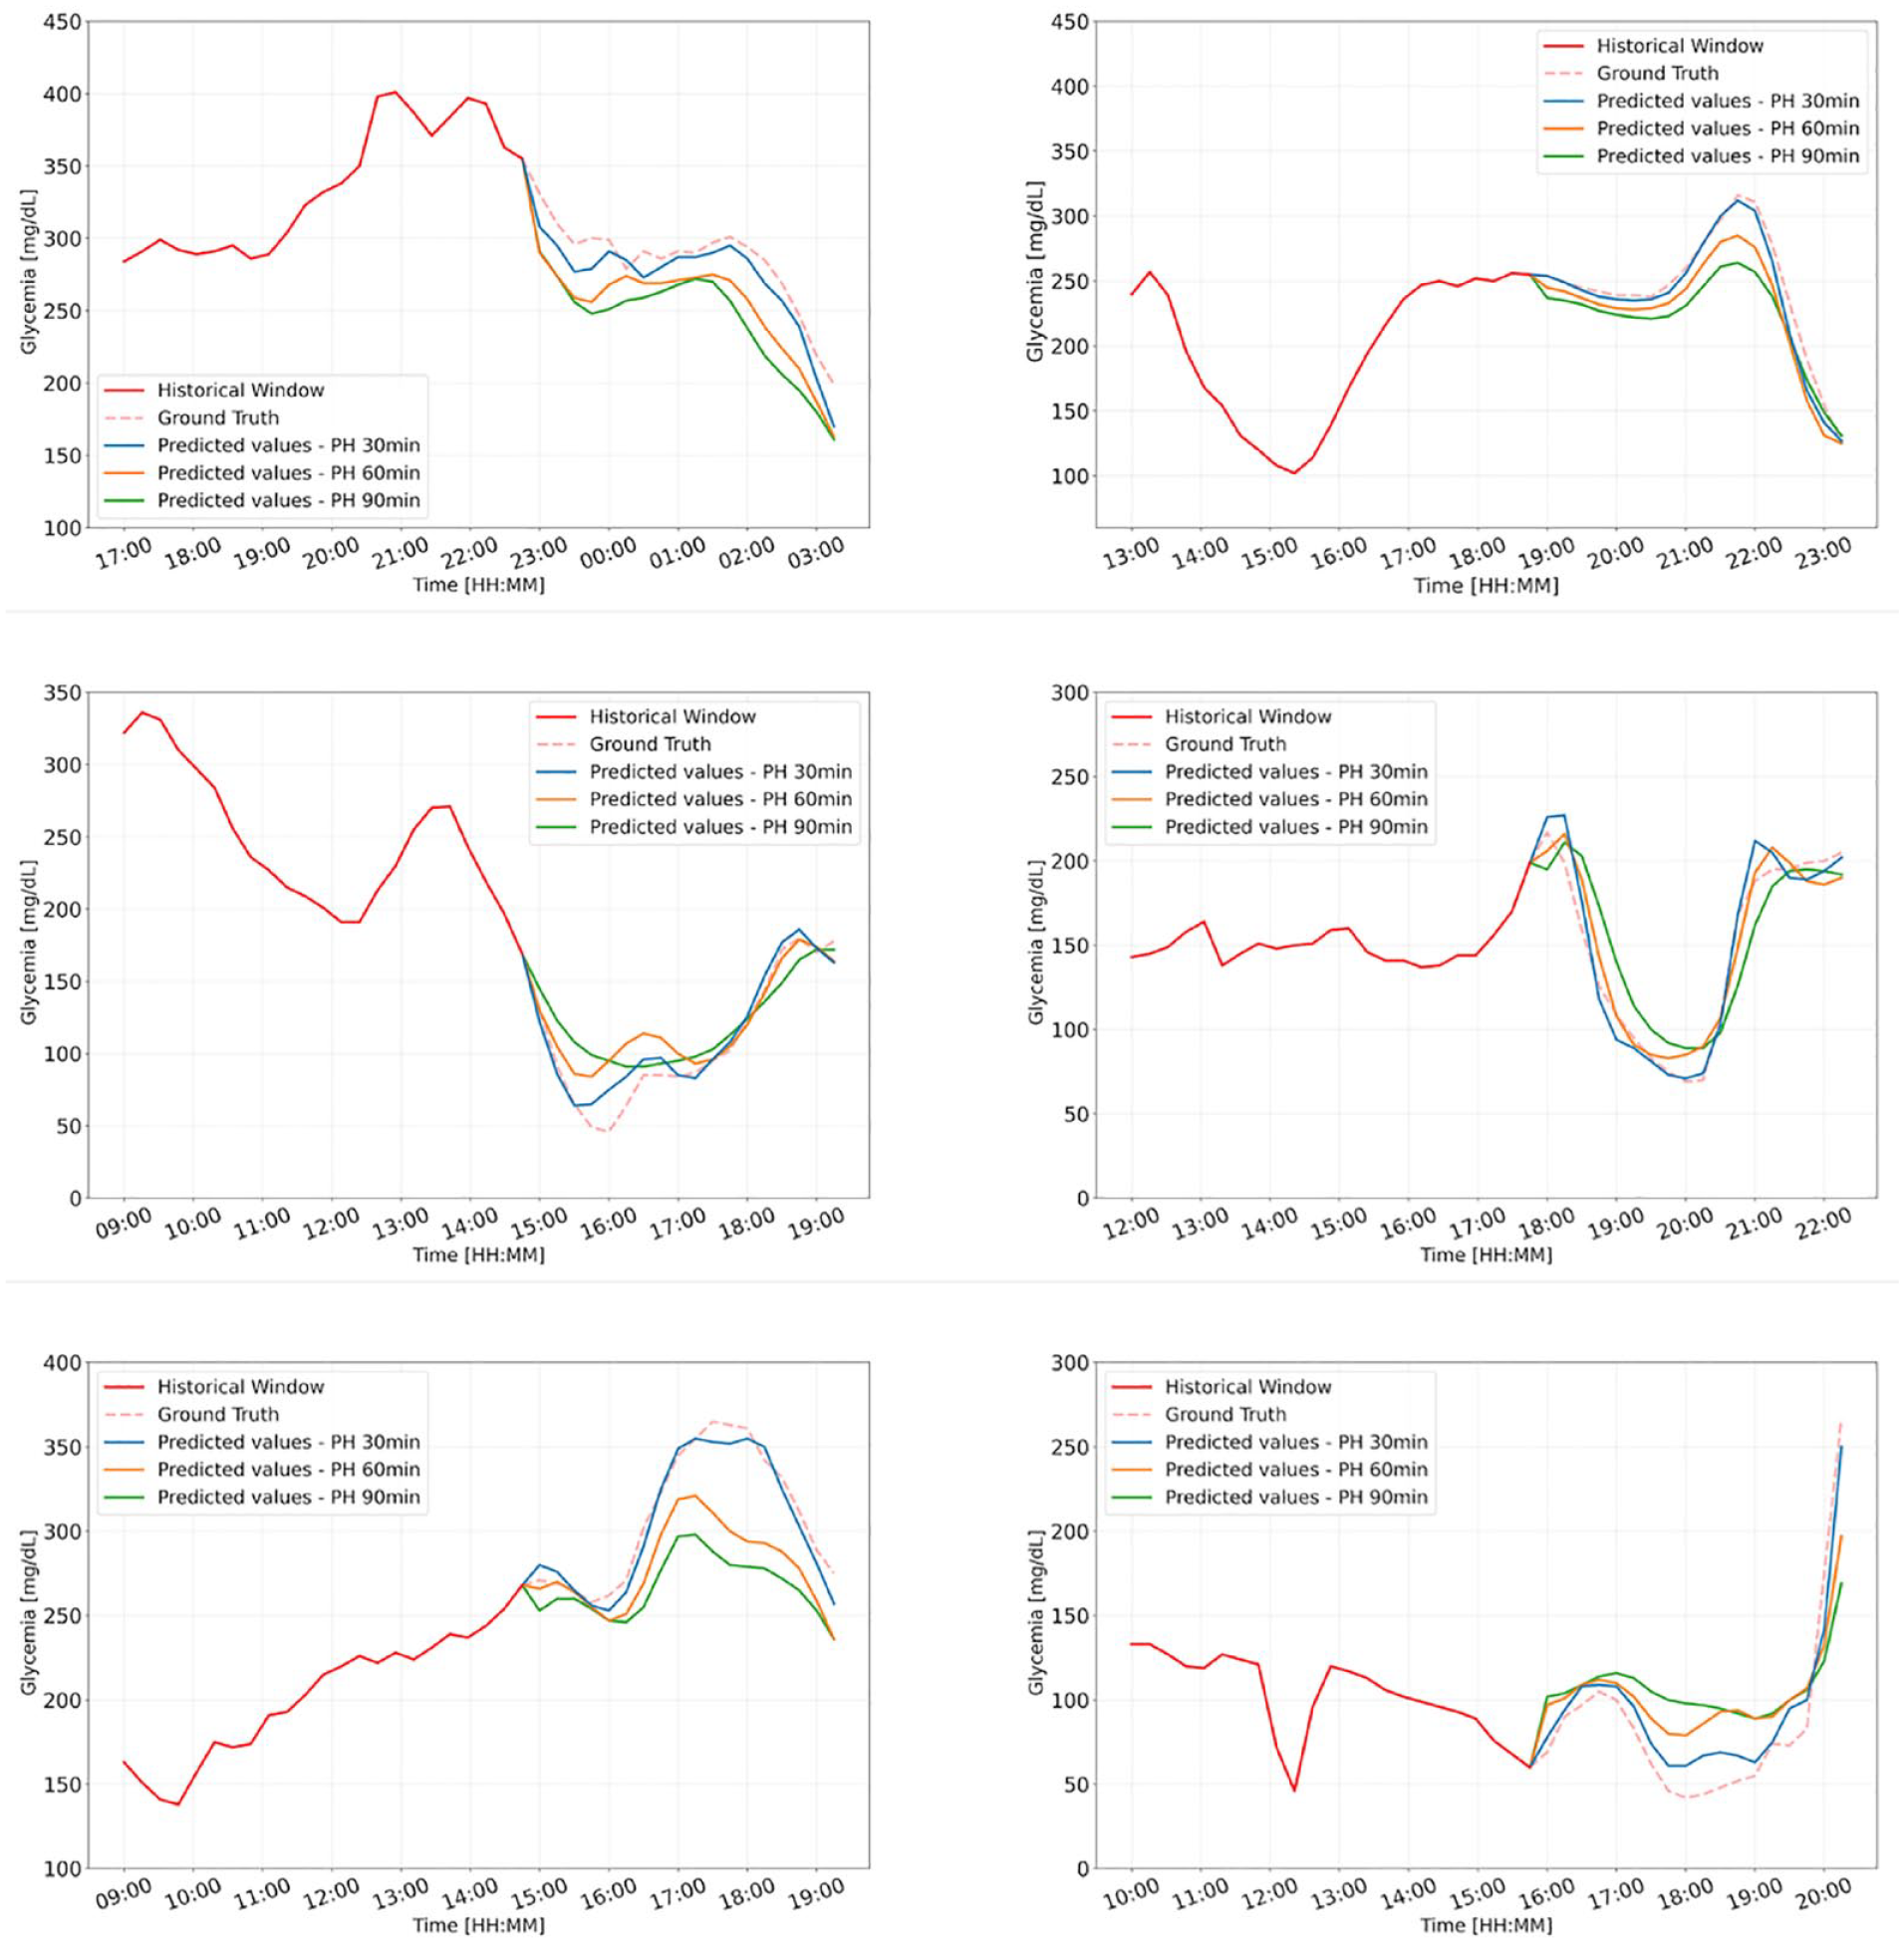
Representative examples of the CGM prediction by the proposed CNN-LSTM for different PHs, for six patients from Replace-BG data set.
For completeness, Supplemental Table 1 in Online Appendix provides the range of RMSE (mg/dL) obtained by applying other methodologies proposed in the literature to different data sets collected from real subjects.
Patient-Wise Analysis
To account for the intra-subject variability of BG dynamics, we train and test the proposed method with each patient’s data set separately, that is the model is trained, evaluated, and tested on each patient’s data using an 80/20 split between the train and the test data sets. Table 3 illustrates the results in terms of mean and STD values of MAE (mg/dL), RMSE (mg/dL), and R2 (%) metrics while predicting the future BG level of each patient given the training set data for the same patient. Figure 6 exhibits the distribution of metrics acquired for each patient in the Replace-BG and DIAdvisor data sets. It is noticeable that, although the model performance deteriorates comparing with the population-wise metrics, it still produces encouraging results, particularly for short-term PH. However, as the PH increases, the distribution of the results increases as well, which makes sense given the small data set utilized for patient-wise training.
Patient-Wise Mean ± (Standard Deviation) of Accuracy Metrics (MAE, RMSE, and R2) of Forecasting the BG Level for 30-, 60-, and 90-Minute PH for the Replace-BG and DIAdvisor Data sets.
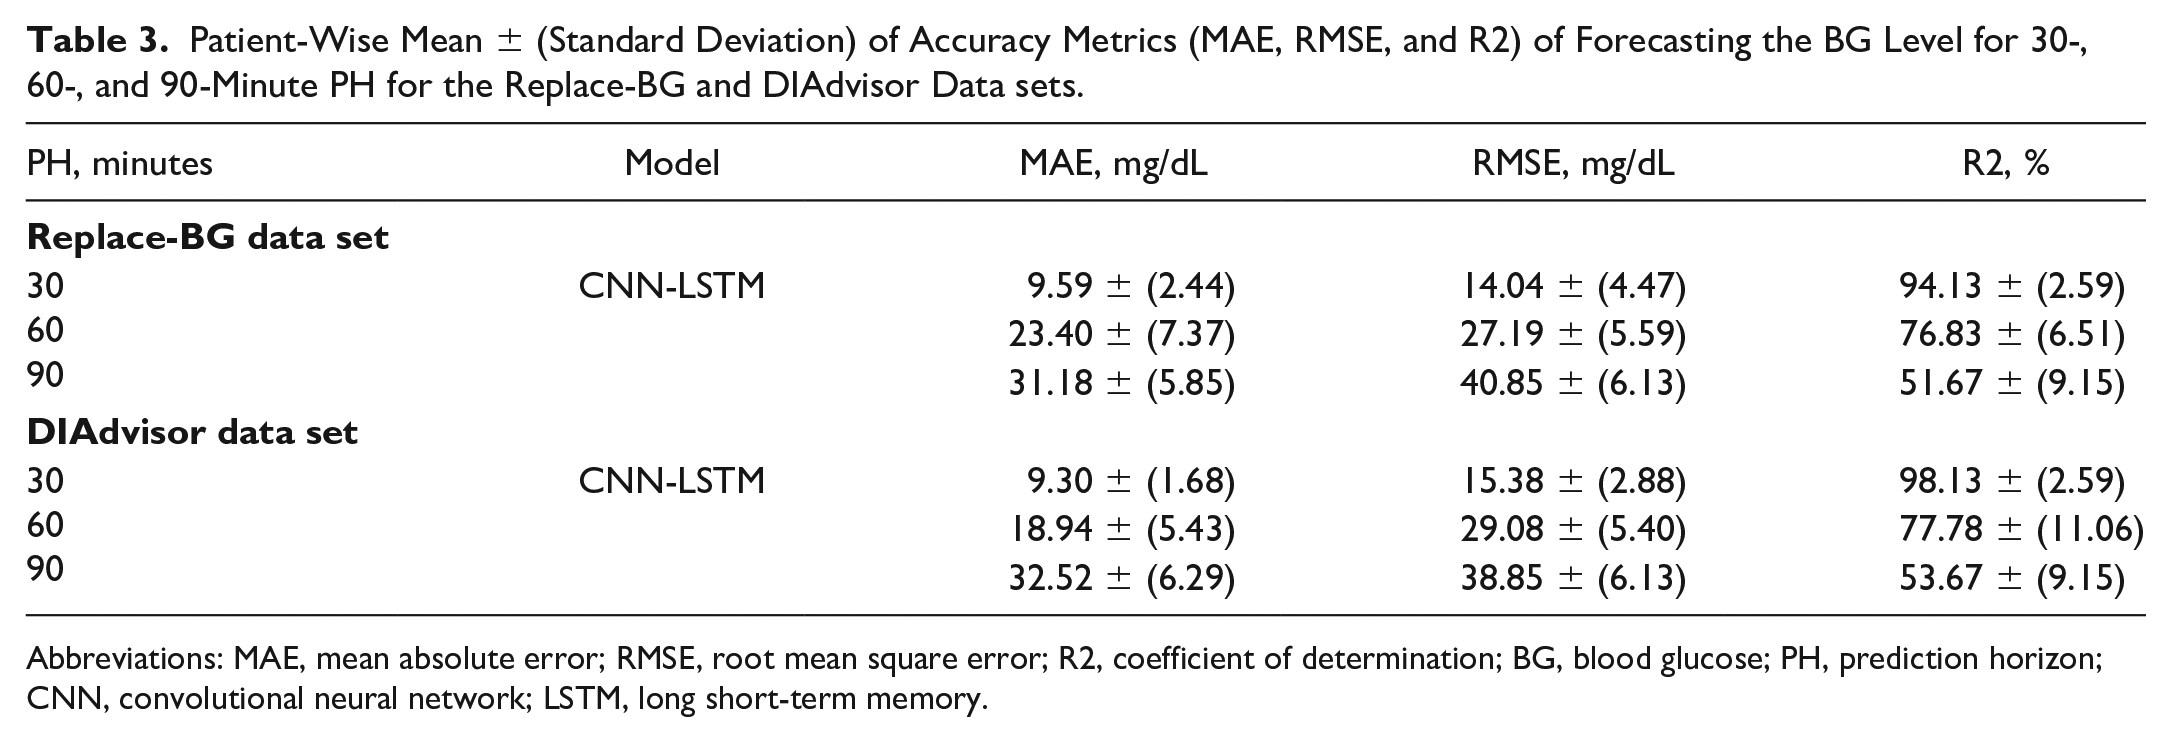
Abbreviations: MAE, mean absolute error; RMSE, root mean square error; R2, coefficient of determination; BG, blood glucose; PH, prediction horizon; CNN, convolutional neural network; LSTM, long short-term memory.
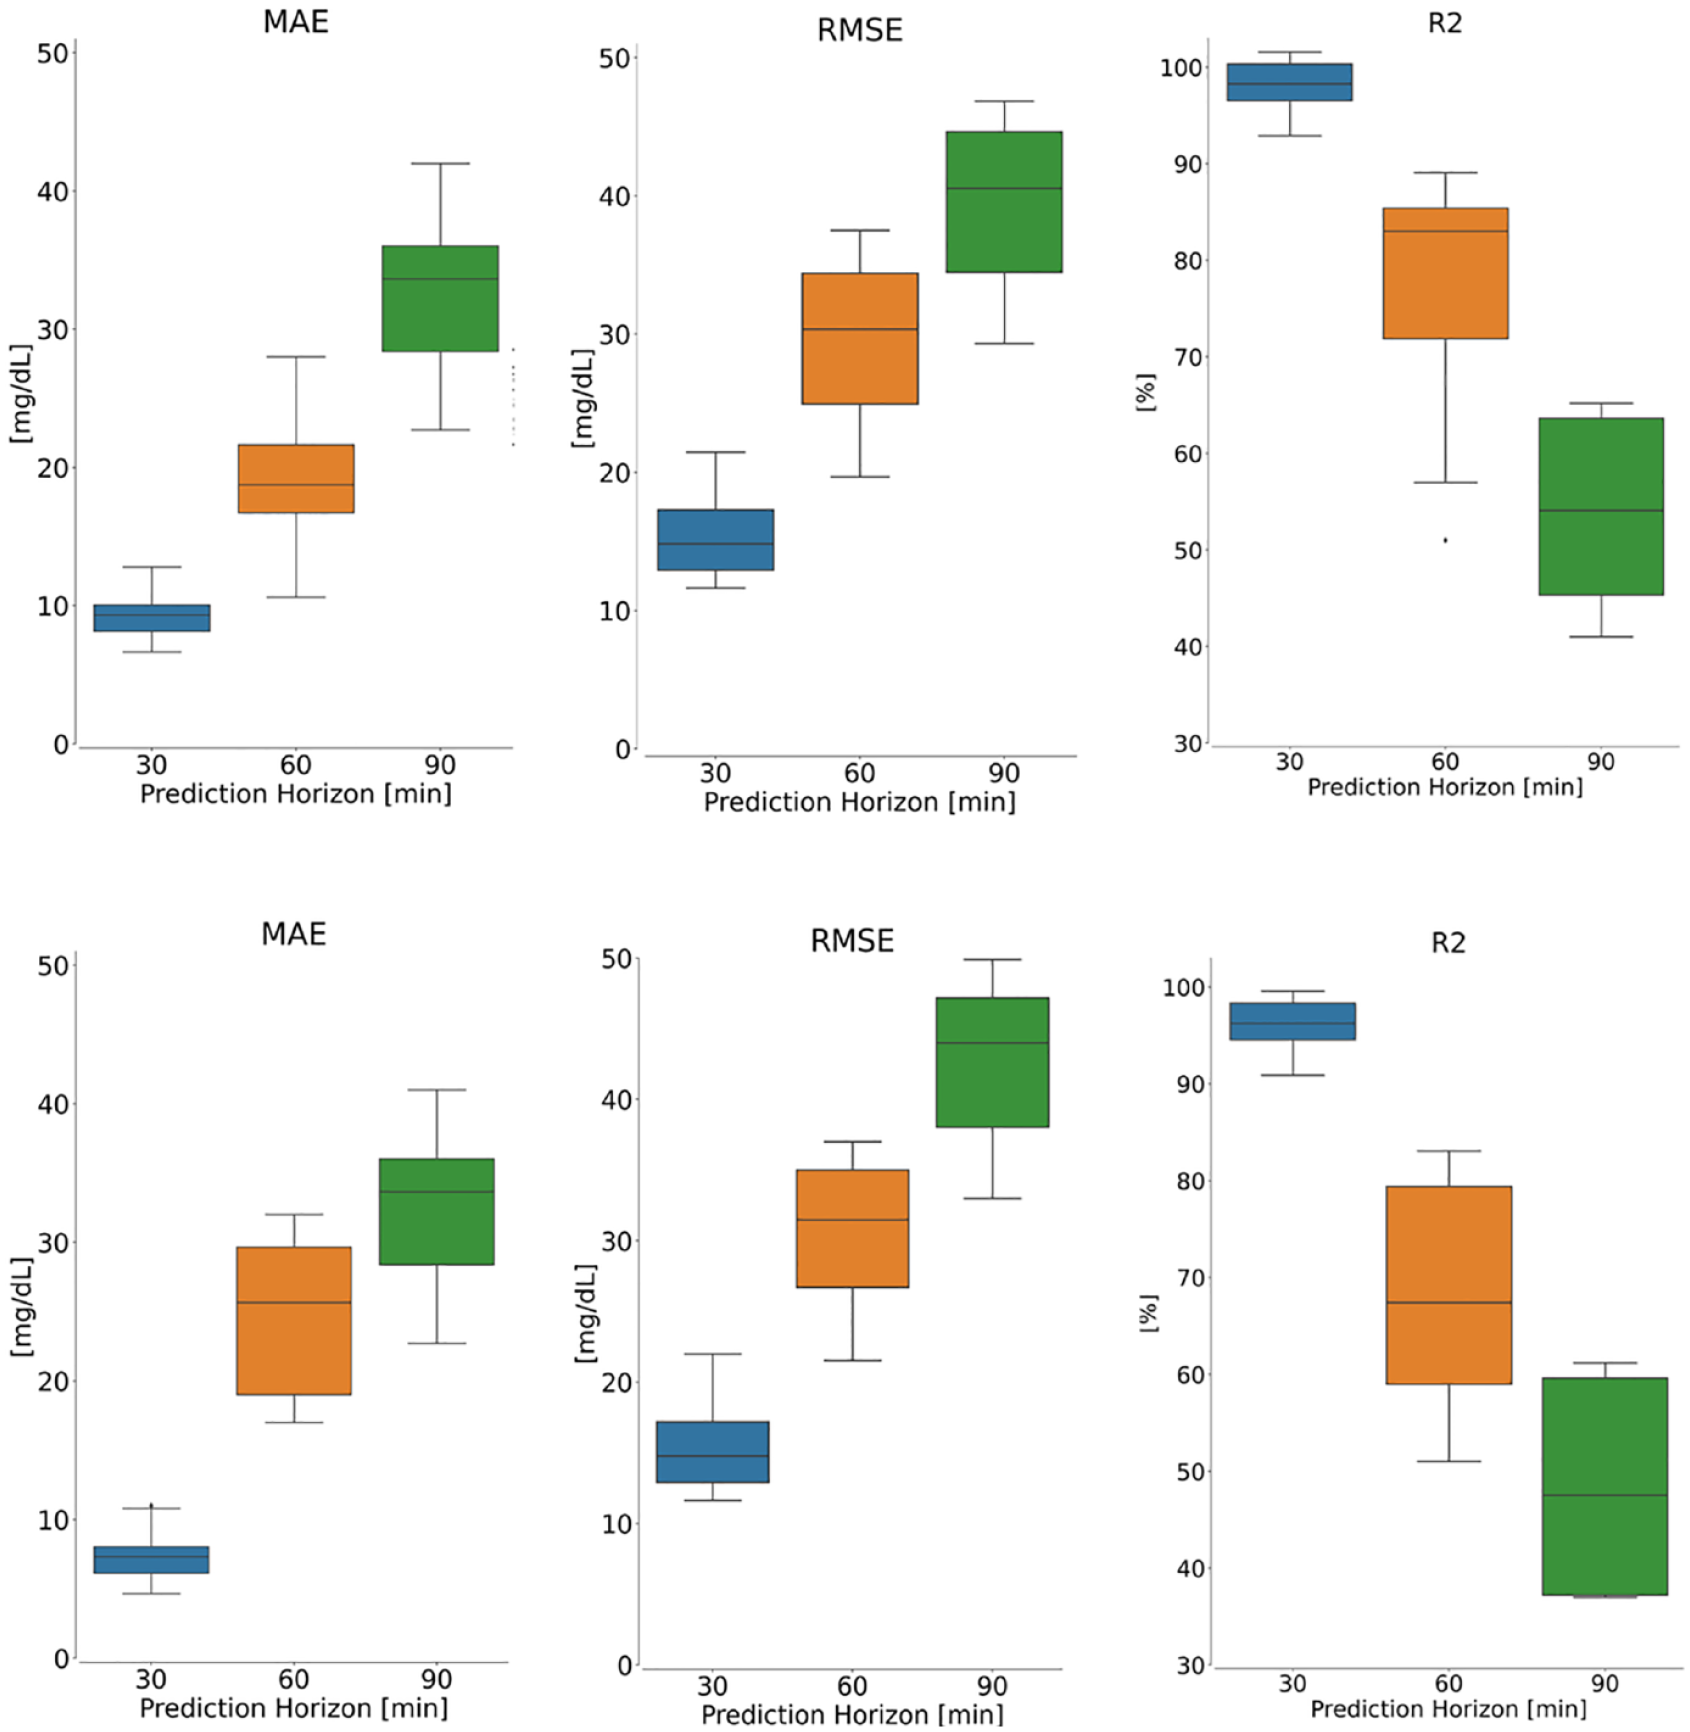
Patient-wise performance evaluation of the proposed model on the Replace-BG (top panel) and DIAdvisor (bottom panel) data sets for three different PHs over the test data set. Left: MAE, middle: RMSE, and right: R2. In each boxplot, the central mark is the median.
Discussion
Advantages and Limitation of the Proposed CNN-LSTM Model
In this article, we proposed a hybrid CNN-LSTM algorithm, for the prediction of BG concentration in people with T1D. Consisting of an automatic feature extraction component, CNN, and a sequence learner part, LSTM, our proposed CNN-LSTM demonstrated superior performance in extracting hidden features and correlations between various physiological variables, as well as learning their causal effect, to be used for forecasting future BG values.
Nonetheless, as seen in the “Patient-Wise Analysis” subsection, to obtain acceptable performance, CNN-LSTM, like all other DNN-based architectures, needs to be trained on a large enough data set. That is why the model generally performs better on the Replace-BG than the DIAdvisor data set. On the other hand, one of the primary drawbacks of dealing with physiological data sets is the large number of missing data points, which can have a substantial impact on model performance. As noted in the “Data Preprocessing” subsection, we used linear interpolation on the training set to address this issue when gaps in CGM data were shorter than 60 minutes; however, it would be more efficient to have a data set with fewest possible missing data points.
Comparison With Existing Algorithms
This study demonstrated the superiority of our proposed CNN-LSTM model over the ARX, SVR, LSTM, and CRNN models, in terms of both predictive accuracy metrics and clinical acceptability. This higher performance is due to a more sophisticated architecture comprised of stacks of convolutional and LSTM layers, which results in a more robust method for learning complex and hidden features in multivariate data sets as well as learning to predict abrupt changes in the CGM level caused by alteration in other variables, like food or insulin intakes. In addition, as illustrated in Figure 3, our proposed CNN-LSTM model is more capable of capturing rapid and abrupt changes in the CGM trend, owing to its capacity for learning the complex dynamics and correlations between variables in the data set. Sufficient data are required to produce the desired results, however, which accordingly raises the computational cost of the CNN-LSTM model as opposed to the reference models.
Conclusion and Future Work
In this article, we proposed a hybrid deep learning–based model, comprised of convolutional and LSTM layers, and proved its superior performance in predicting future BG levels, for two multivariate in vivo data sets of T1D patients, Replace-BG and DIAdvisor, respectively, over previously published models in the literature.
To account for intersubject variability, we used the FC, and trained the model on different train/test subsets of data set on a rolling basis with ratio of 80/20, to be able to leverage all patients both in train and in test subsets of both data sets. We found that the proposed method worked well for both short-term, 30-minute PH (Replace-BG: MAE 6.60 ± 0.76 mg/dL, RMSE 9.28 ± 1.31 mg/dL, and R2 97.92 ± 2.14%; DIAdvisor: MAE 6.92 ± 0.68 mg/dL, RMSE 9.81 ± 0.91 mg/dL, and R2 97.03 ± 1.24%) and long-term, 60-minute PH (Replace-BG: MAE 11.74 ± 1.66 mg/dL, RMSE 16.51 ± 2.19309 mg/dL, and R2 91.97 ± 3.33%; DIAdvisor: MAE 12.06 ± 1.87 mg/dL, RMSE 18.32 ± 2.76 mg/dL, and R2 91.23 ± 3.32%) and 90-minute PH (Replace-BG: MAE17.30 ± 2.07 mg/dL, RMSE 23.45 ± 3.18 mg/dL, and R2 84.13 ± 3.66%; DIAdvisor: MAE 18.23 ± 2.97 mg/dL, RMSE 25.12 ± 4.65 mg/dL, and R2 82.34 ± 4.54%). The clinical acceptability of the proposed model was further assessed using CG-EGA measures, as shown in Table 2. The suggested model was then trained and evaluated patient-by-patient to assess its robustness to intra-subject variability. Based on the results, it is observable that our suggested technique, like any other DNN-based methodology, is extremely dependent on the quality and size of the data set. In the future, we aim to leverage the transfer learning methodology, that is transferring the knowledge resulted from training on a large data set, to generalize the trained model on any unseen patient. Last, intensity and type of PA and stress level were not taken into account for BG prediction in this work. While we acknowledge the limitations introduced by this, we are currently planning to incorporate these signals into future studies.
Supplemental Material
sj-docx-1-dst-10.1177_19322968221092785 – Supplemental material for Long-term Prediction of Blood Glucose Levels in Type 1 Diabetes Using a CNN-LSTM-Based Deep Neural Network
Supplemental material, sj-docx-1-dst-10.1177_19322968221092785 for Long-term Prediction of Blood Glucose Levels in Type 1 Diabetes Using a CNN-LSTM-Based Deep Neural Network by Mehrad Jaloli and Marzia Cescon in Journal of Diabetes Science and Technology
Footnotes
Abbreviations
CGM, continuous glucose monitoring; CHO, carbohydrate; ANN, Artificial neural network; DNN, deep neural network; ML, machine learning; CNN, convolutional neural network; LSTM, long short-term memory; RNN, recurrent neural networks; MAE, mean absolute error; RMSE, root mean square error; SVR, support vector regression; R2, coefficient of determination; STD, standard deviation; CRNN, convolutional recurrent neural network; CG-EGA, continuous glucose-error grid analysis.
Declaration of Conflicting Interests
The author(s) declared the following potential conflicts of interest with respect to the research, authorship, and/or publication of this article: Dr Cescon serves on the advisory board for Diatech Diabetes, Inc. Mehrad Jaloli declares no conflict of interest relevant to this project.
Funding
The author(s) disclosed receipt of the following financial support for the research, authorship, and/or publication of this article: This work was supported by the University of Houston through a start-up grant.
Supplemental Material
Supplemental material for this article is available online.
References
Supplementary Material
Please find the following supplemental material available below.
For Open Access articles published under a Creative Commons License, all supplemental material carries the same license as the article it is associated with.
For non-Open Access articles published, all supplemental material carries a non-exclusive license, and permission requests for re-use of supplemental material or any part of supplemental material shall be sent directly to the copyright owner as specified in the copyright notice associated with the article.