
Abstract
Background:
Type-1 diabetes (T1D) management and glycemic control the year after diagnosis affects the long-term trajectory of T1D. Disparities in hemoglobin A1c (HbA1c) based on race, ethnicity, and socioeconomic status (SES) have been well-documented; however, there has been limited investigation into the timeline with which these disparities develop. This study aims to assess differences in HbA1c by race/ethnicity and SES among youth with T1D over 1 year post diagnosis.
Methods:
HbA1c at onset, and 3, 6, 9, and 12 months following diagnosis was collected from youth with T1D between 2016 and 2020. Mixed-effect models examined associations of HbA1c over time with race/ethnicity and SES.
Results:
Of 758 patients, 71% identified as white. Mean (± SD) HbA1c was 11.4% ± 2.2% at diagnosis and 7.3% ± 1.2%, 7.3% ± 1.3%, 7.7% ± 1.4%, and 7.9% ± 1.4% at 3, 6, 9, and 12 months, respectively. HbA1c trajectories over time differed significantly by race (adjusting for sex and zip-code education and poverty levels) with Hispanic and black youth demonstrating higher HbA1c 1 year after diagnosis (8.7% vs 7.7%, p < .001) than white youth.
Conclusions:
These data revealed that youth did not meet glycemic targets at 1 year post diagnosis and that racial/ethnic minority youth had higher HbA1c 1 year post diagnosis, highlighting the need to optimize glycemic control and mitigate disparities early. Understanding the time course of these outcomes helps to inform the need for early interventions, particularly in disadvantaged patient populations, to lay the groundwork for improved control. Further research must also be done to better understand overlapping axes of disparities including race, ethnicity, and SES.
Introduction
Optimizing glycemic control is central to improving outcomes and decreasing complications from type-1 diabetes (T1D). 1 Current registry-based data in the United States (US) suggest that only 17% of children and adolescents meet the previously set glycemic hemoglobin A1c (HbA1c) target of <7.5% per the American Diabetes Association (ADA). 2 With the lowering of the ADA target HbA1c for some children to <7.0% in 2021, many more children do not meet glycemic targets. 3 The year following diagnosis of diabetes is crucial in shaping the path forward for pediatric patients and their families. The importance of establishing good management practices is supported by multiple studies demonstrating that initial glycemic control is predictive of long-term trajectories and complications.1,4,5 While there is a range of literature that examines different patterns of HbA1c in youth following diagnosis of T1D, this study adds a nuanced analysis of overlapping demographic, clinical, and socioeconomic status (SES) factors that may impact the postdiagnosis trajectory of glycemic control.
Methods
This analysis was a retrospective longitudinal study of children with T1D diagnosed and cared for at Boston Children’s Hospital (BCH) between January 1, 2016, and March 31, 2020. The study was deemed exempt by the Institutional Review Board, BCH.
Using the Type 1 Diabetes Quality Improvement (QI) Registry database, we identified patients who were diagnosed with T1D on or after January 1, 2016, with at least one follow-up measure of HbA1c. Demographic data, including race, ethnicity, language, interpreter need, primary/secondary insurance, and zip-code were pulled from the electronic medical record (EMR). Clinical data, including date of birth, diagnosis date, characteristics of initial diagnosis (venous pH, location of care, duration of admission), body mass index (BMI) z-score (repeated measure), HbA1c (repeated measure), and frequency of outpatient visits, were pulled from a combination of QI registry data, EMR data, and chart review where appropriate. SES characteristics were imputed from the patients’ zip-codes at time of diagnosis based on data from the 2018 American Community Survey (ACS). 6 This linking database enabled imputation of poverty and education level for patients based on neighborhood-level data.
Study demographics were described using summary statistics, including mean and standard deviation for parametric variables, median, and interquartile range (IQR) for nonparametric variables and frequency and percentage for categorical variables. Mixed-effect model with compound symmetry covariance matrix (Proc Mixed) was used to examine the association of HbA1c levels over time with potential risk factors. Covariates included race, sex, education level, and poverty level. The significance tests were two-sided, and p values less than .05 were considered statistically significant. Statistical analyses were performed with SAS, Release 9.4 (Cary, NC).
Results
There were 758 patients eligible for inclusion in the study (see Table 1). Of those patients, 44% identified as female. The plurality (48%) of patients were between 6 and 13 years of age at diagnosis; 19% were less than 6 years old with the remaining 33% greater than 13 years old. The sample’s race/ethnicity mirrored the U.S. Type-1 Diabetes registry data with 71% of the current sample identifying as white, 9% Hispanic, 5% black, 2% Asian, and 13% unknown/other. 7 Among the eligible patients, 682 (90%) were English-speaking; the second-most common preferred language was Spanish (25 patients, 3.3%). About a quarter (27%) was on public insurance at the time of diagnosis. Over one-third (38%) presented in diabetic ketoacidosis at the time of diagnosis. Average BMI z-score at presentation was −.08. BMI z-score at 1-year postdiagnosis was .50.
Patient Baseline Clinical and Demographic Characteristics.
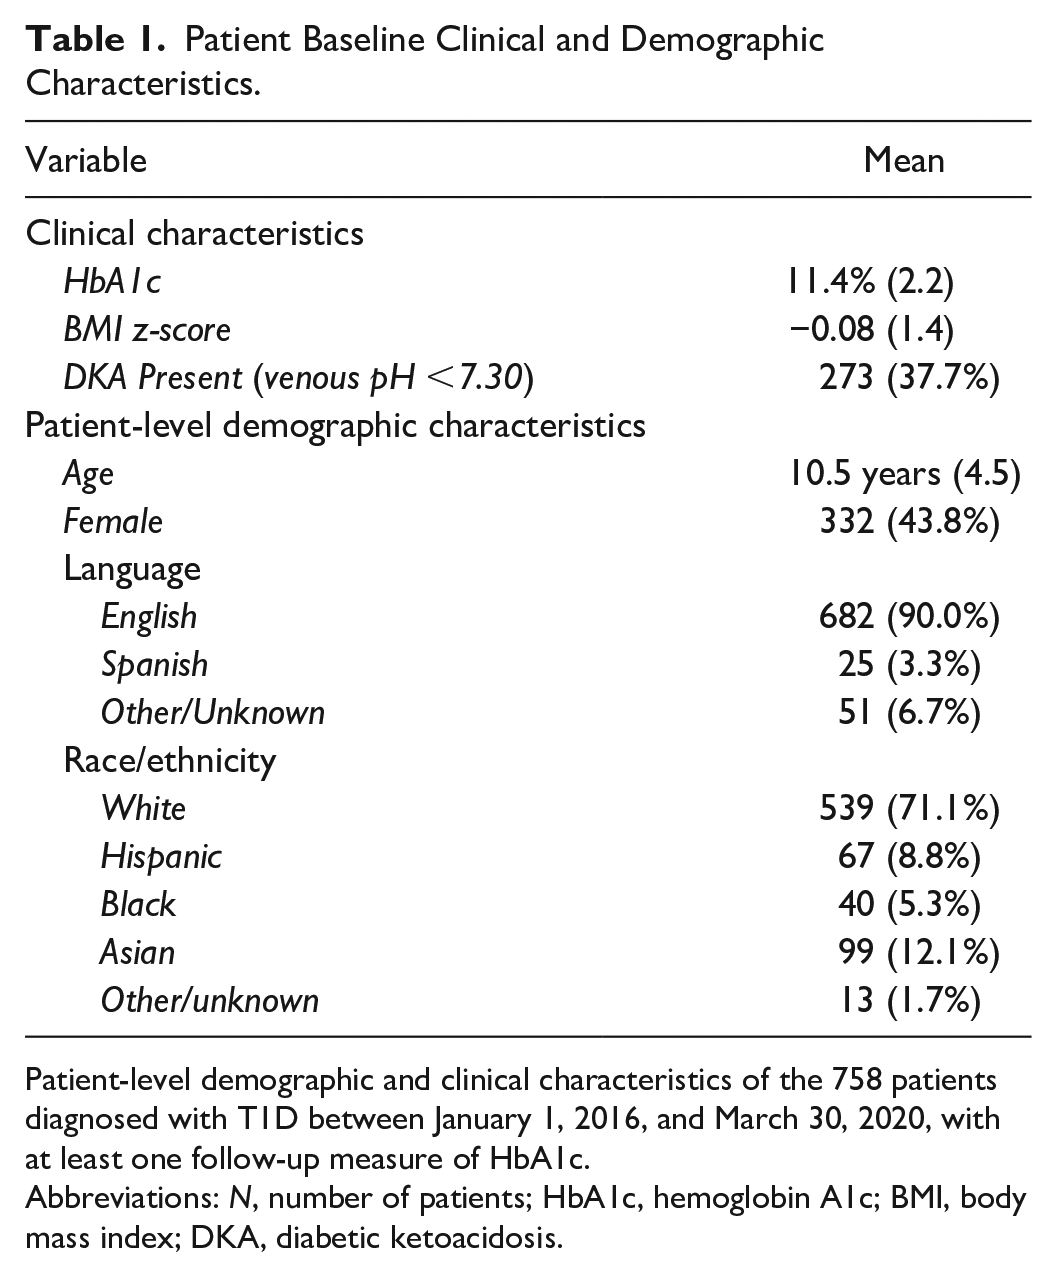
Patient-level demographic and clinical characteristics of the 758 patients diagnosed with T1D between January 1, 2016, and March 30, 2020, with at least one follow-up measure of HbA1c.
Abbreviations: N, number of patients; HbA1c, hemoglobin A1c; BMI, body mass index; DKA, diabetic ketoacidosis.
On average, patients experienced a decrease in HbA1c 1 year after diagnosis. Mean (± SD) HbA1c was 11.4% ± 2.2% at diagnosis and 7.3% ± 1.2%, 7.3% ± 1.3%, 7.7% ± 1.4%, and 7.9% ± 1.4% at 3, 6, 9, and 12 months, respectively.
HbA1c trajectories were additionally analyzed by race/ethnicity. Due to small samples, Hispanic and black categories (collectively Hispanic/black) and Other, Asian, and Unknown (collectively Other) categories were each combined for analysis. At baseline, Hispanic/black patients had a higher HbA1c than their white counterparts (11.7% vs 11.3%, p = .01). At six (7.7%, 7.2%, p = .02), nine (8.5%, 7.5%, p < .001), and 12 (8.7%, 7.7%, p < .001) months following diagnosis, this comparison maintained statistical significance. The Other category was intermediate.
Zip-code level matching to ACS data suggested that our sample lived in zip-codes with a median of 6.3% (IQR: 4.1%–10.7%) of households with income below the federal poverty level. 6 High-poverty zip-codes were defined as those in the upper quartile. One year following diagnosis, patients living in high-poverty zip-codes (>10.7% of households below poverty level) had higher HbA1c (8.2% vs 7.8%, p = .05) than their counterparts living in low-poverty zip-codes (<4.1% of households below poverty level). This HbA1c analysis was comparable for patients living in areas of lower and higher education, although the difference only achieved significance at the 9-month evaluation (8.1% vs 7.5%, p = .005).
In a multivariate model adjusting for sex, imputed poverty level, and imputed education level, race maintained statistical significance (see Figure 1) in association with HbA1c with an overall p value of 0.006.
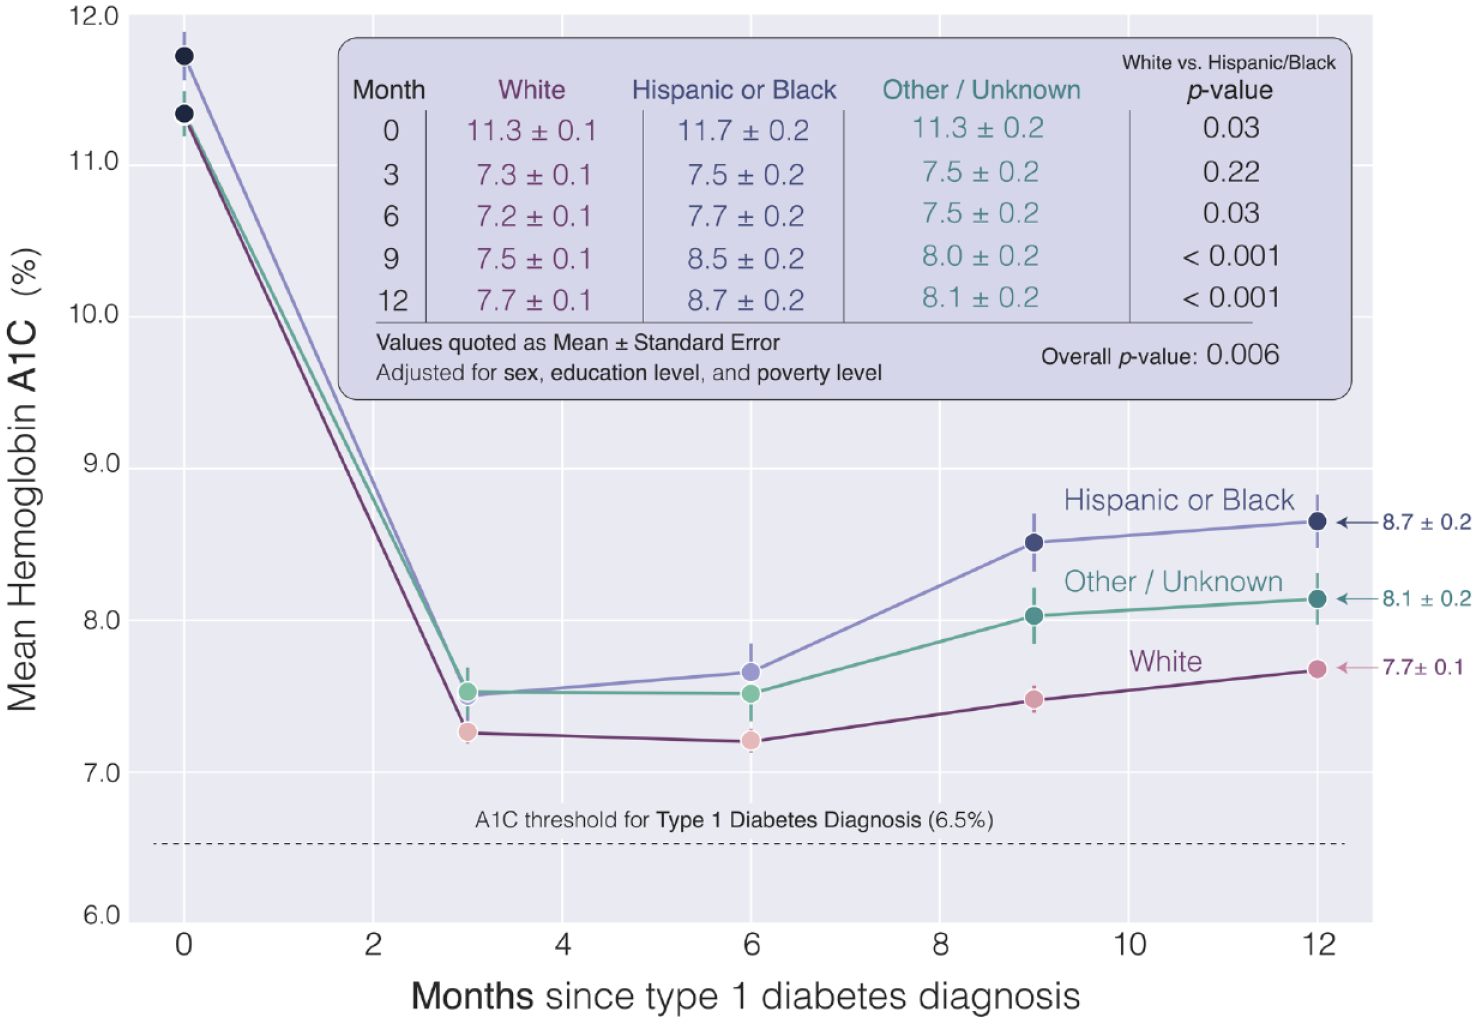
Hemoglobin A1C trajectories in the year following type-1 diabetes diagnosis, by race/ethnicity. In a model adjusted for sex and community-level education and poverty, there are significant differences in the hemoglobin A1c trajectories of newly diagnosed children with T1D based on race/ethnicity with Hispanic/black patients demonstrating higher HbA1c at diagnosis, 6 months, 9 months, and 1 year than their white counterparts.
Discussion
This single-center retrospective follow-up study at an urban tertiary care hospital covering more than 4 years demonstrated that there were significant differences in HbA1c trajectories according to race/ethnicity that emerged in the year following diagnosis of T1D, even after adjustment for poverty and education levels. Hispanic and black youth demonstrated higher HbA1c at diagnosis and 1 year postdiagnosis when compared with white youth. Furthermore, none of the racial/ethnic groups achieved optimal glycemic control at 1 year. Factors shown in the literature to affect these trajectories include demographic and clinical characteristics, such as age, race/ethnicity, family income, family structure, BMI, severity of presentation, and insulin regimen.4,5,8-10 In addition, biologic factors related to differences in red blood cell glycosylation may also yield higher HbA1c measurements in blacks, on the order of 0.4%, 11 compared with whites. However, the differences observed in our study were more than two-fold higher and were maintained in a heterogeneous grouping of minority youth.
The analysis of such trends is complicated by significant collinearity of SES and demographic factors. Our cohort recapitulates many national trends with 52% of Hispanic and black patients living in low education zip-codes and 67% in high-poverty zip-codes (compared with 15 and 14% of whites, respectively). Studies of inequitable outcomes must account for overlapping levers of disadvantage; failing to do so may lead to imprecise conclusions regarding drivers of disparities. 12 Longitudinal studies have shown that black patients demonstrate dramatic increases in HbA1c postdiagnosis 13 and have identified family structure as one explanatory variable of the rising trajectory seen 5 years postdiagnosis. 14 Other measures of social advantage (i.e., increased neighborhood income or two-parent households) also play a role and may function differently across racial/ethnic groups.8,15 This pattern extends internationally; a recent multinational comparison of HbA1c trajectories 10 years postdiagnosis also reported that minority youth were over-represented in the subgroup with above target and increasing HbA1c over time across all three countries. 16
In addition to overlapping levers of social inequality, disparities in T1D management may also impact HbA1c trajectories. Life-changing advances have been made in our ability to monitor glucose (e.g. continuous glucose monitors, CGM) and administer insulin (e.g. continuous subcutaneous insulin infusions). The ADA 2022 Standards of Care for Children and Adolescents with T1D advise incorporating such technology into clinical care when it is safe and appropriate; however, there is still insufficient widespread use to enable achievement of glycemic goals as well as notable racial/ethnic and socioeconomic disparities in the uptake and meaningful use of such technology.3,17 Evidence from analysis of U.S. Type-1 Diabetes registry data confirms that racial/ethnic and SES factors have a significant effect both on treatment modalities including technology and on outcomes (i.e. HbA1c and hospital admissions for complications of T1D).2,18 Single-center studies show associations between CGM use and race/ethnicity, language, and health insurance with minority populations with public insurance demonstrating lower CGM use and higher HbA1c.17,19 These disparities in CGM use likely explain some of the described pattern in HbA1c trajectories and suggest potential targets for intervention.
Limitations of this study include its relatively small minority sample and lack of patient-level SES factors, such as family structure, along with the extrapolation of household income and education of caregivers. Study strengths include its large sample size of over 700 youth and nearly 3,000 HbA1c measurements. Furthermore, incorporation of ACS data allowed for categorization of patients based on SES without prospective data collection.
Conclusions
Our observations from this multiyear retrospective follow-up study of youth with newly diagnosed T1D demonstrate continued global challenges in achieving optimal glycemic control in the year following diagnosis and further recapitulate disparities previously documented among socially disadvantaged and minority patients across time and geographic regions. The degree of disparities documented in this data further elucidates the immense challenges that medical providers, public health practitioners, and society more broadly face with regard to the impact of demographic characteristics and health. In addition to suggesting the importance of continuing to work to improve glycemic control among all children with T1D, these findings reinforce the need for future research of drivers of these disparate outcomes and design of targeted interventions to narrow care gaps that may underlie these disparities to ensure health equity from onset of T1D in youth.
Footnotes
Acknowledgements
The authors would like to acknowledge the assistance of research assistants Blair Dykeman, Sarah Clemons, Radhika Joshi, and James Zavadoski for their role in data collection, chart review, and database management as well as the role of Grant Tremblay in the creation of the included figure. They additionally acknowledge the role of the Quality Improvement program at Boston Children’s Hospital Division of Endocrinology (particularly Dr. Erinn Rhodes, MD, MPH and Sonal Nanavati) for sharing their database and their assistance in its use.
Abbreviations
ACS, American Community Survey; BCH, Boston Children’s Hospital; BMI, body mass index; CGM, continuous glucose monitoring; EMR, Electronic Medical Record; IQR, interquartile range; QI, Quality Improvement; SES, socioeconomic status; US, United States.
Declaration of Conflicting Interests
The author(s) declared no potential conflicts of interest with respect to the research, authorship, and/or publication of this article.
Funding
The author(s) disclosed receipt of the following financial support for the research, authorship, and/or publication of this article: Research reported in this publication was supported by the National Institute of Diabetes and Digestive and Kidney Diseases of the National Institutes of Health under award numbers K12DK094721 and P30DK036836. The content is solely the responsibility of the authors and does not necessarily represent the official views of the NIH.