
Abstract
Background:
There are few studies on the role of long-term glycemic variability in complications of type 1 diabetes (T1D). This study was aimed to investigate the associations of HbA1c variability represented by the coefficient of variation of HbA1c with incident microvascular complications in T1D by analyzing the data set from the DCCT/EDIC study.
Methods:
Patients (n = 1240) were divided into four groups by HbA1c variability quartiles. Incident microvascular complications were assessed for a duration of an average of 20.5 years. Multivariable models were performed to examine the associations between HbA1c variability and incident microvascular complications.
Results:
All incident microvascular complications were higher in the fourth quartile of the HbA1c variability group. After adjusting for clinical risk factors, HbA1c variability was positively associated with a higher risk of all diabetic microvascular complications (P < .05). Specifically, it had 1.125 (1.082-1.170), 1.114 (1.074-1.154), 1.061 (1.024-1.099), or 1.088 (1.052-1.125) times higher odds (95% confidence interval [CI]) of having retinopathy, nephropathy, clinical neuropathy, or autonomic neuropathy, independent of mean HbA1c values (P < .05). Furthermore, there were higher incident microvascular complications with higher HbA1c variability when HbA1c value was above the group median of 7.9%, while only higher incident autonomic neuropathy with higher HbA1c variability when HbA1c was below the group median.
Conclusions:
Our results showed a significant independent association between HbA1c variability and the risk of microvascular complications in T1D. HbA1c variability might be a supplemental risk stratification tool to mean HbA1c for microvascular complications in T1D.
Introduction
Landmark studies, such as the Diabetes Control and Complications Trial/Epidemiology of Diabetes and its Complications (DCCT/EDIC) study in type 1 diabetes (T1D) and the UK Prospective Diabetes Study in type 2 diabetes, demonstrated the relationship of long-term glycemic exposure with the risk of diabetic complications, as measured by mean hemoglobin A1c (HbA1c) values and exposed duration in these studies.1,2
Although patients can achieve identical mean HbA1c targets, they can present a wide fluctuation in their glycemic profile, which is known as glycemic variability. Short-term glycemic variability refers to within- or between-day fluctuations in an individual. Long-term glycemic variability refers to fluctuations over weeks, months, or even years and is often assessed by HbA1c variability. 3 Both standard deviation (SD) and coefficient of variation (CoV) of HbA1c values are measures of HbA1c variability. SD measures how much values differ from the group mean, whereas CoV is the ratio of SD to the mean, making it independent of the mean HbA1c.3,4
Data from the DCCT/EDIC study and the Finnish Diabetic Nephropathy study indicated that HbA1c variability represented by SD was independently associated with complication risk in T1D.5,6 These results are in line with other studies, where HbA1c variability was associated with nephropathy, retinopathy, and cardiovascular risk.3,7 However, SD is dependent on mean HbA1c, and there are few studies investigating the associations of HbA1c variability represented by CoV with incident microvascular complications in T1D. In the present study, by analyzing data sets from the DCCT/EDIC study, we investigated HbA1c variability represented by CoV and its risk for incident microvascular complications.
Methods
Participants
Between 1983 and 1989, 1441 patients with T1D were enrolled in the DCCT. 8 At the end of the DCCT in 1993, 1375 of the 1428 surviving participants volunteered for the follow-up EDIC study. 9 At the entry of DCCT, these patients were aged 13 to 39 years, had had T1D for 1 to 15 years, and were relatively healthy with no severe diabetic complications. These patients had no proliferative retinopathy and no albuminuria (urinary excretion of albumin < 200 mg/24 h). Subjects with a history of cardiovascular diseases or hypertension (blood pressure ≥ 140/90 mm Hg) or hypercholesterolemia (fasting serum cholesterol >3 SDs above age- and gender-specific means) were excluded. 10
The present report included follow-up data from DCCT entry through EDIC year 14 (2006), with 1240 participants with nonmissing data and an average of 20.5 years of follow-up. The deidentified data set was acquired from the National Institute of Diabetes and Digestive and Kidney Diseases Central Repository. This research protocol was approved by the institutional research ethics committee. Research has been conducted in accordance with the Declaration of Helsinki.
Medical and Biochemical Evaluations
During EDIC, participants had an annual history update, a physical examination, and laboratory testing, using the same methods employed during DCCT. 9 HbA1c was measured by high-performance liquid chromatography quarterly during DCCT and annually during EDIC. Fasting lipid profiles were measured annually during DCCT and on alternate years during EDIC. 9 Blood pressure was measured every 3 months during DCCT and yearly during EDIC. The DCCT/EDIC central biochemistry laboratory performed all laboratory measurements with standardized methods. Time-weighted values across the entire duration of the DCCT/EDIC study were used in our regression analyses. For covariates measured at different frequencies during DCCT and EDIC (eg, HbA1c), the updated time-weighted mean was calculated, weighting each value by the interval between measurements.
Microvascular Complications
Retinopathy was assessed by seven-field stereoscopic fundus photography according to the DCCT/EDIC protocol. 11 For these analyses, retinopathy was defined by the presence of proliferative diabetic retinopathy (PDR) and/or a history of panretinal scatter photocoagulation (laser) therapy. 11 The albumin excretion rate (AER) was measured yearly during DCCT and every other year during EDIC using supervised 4-hour urine collections. 12 Serum creatinine was measured annually throughout DCCT/EDIC and an estimated glomerular filtration rate (eGFR) was calculated by using the Chronic Kidney Disease Epidemiology Collaboration equation. 12 Nephropathy was defined by persistent microalbuminuria (AER ≥ 30 mg/24 h on two consecutive study visits), and/or impaired eGFR (eGFR <60 mL/min/1.73 m2 on two consecutive study visits), and/or end-stage renal disease (ESRD) in the DCCT/EDIC. ESRD includes kidney transplantation or dialysis. 12 The 74 subjects with microalbuminuria at baseline were excluded from these analyses.
Clinical neuropathy was confirmed by nerve conduction testing in EDIC years 13 or 14. 13 The presence of autonomic neuropathy was evaluated using cardiovascular autonomic reflex tests that assessed the R-R response to paced breathing (R-R variation), the Valsalva maneuver, and postural changes in blood pressure in EDIC year 13 or 14. 13 The 66 subjects with autonomic neuropathy at baseline were excluded from these analyses.
Statistical Analyses
The participants were divided into four groups based on the quartiles of HbA1c variability. The scale variables were expressed as mean ± SD. Fisher exact test or a one-way analysis of variance (ANOVA) followed by the Tukey post hoc test for multiple comparisons was performed to assess differences for trends in the four groups. Separate multivariable logistic regression models were evaluated using retinopathy, nephropathy, clinical neuropathy, or autonomic neuropathy as the dependent variable to assess the odds ratios (ORs) and 95% confidence intervals (CIs) of independent effects of HbA1c variability, with or without mean HbA1c values. Adjustments were made for clinical risk factors including sex, age, duration of diabetes, time-weighted body mass index (BMI), time-weighted systolic blood pressure (SBP) and diastolic blood pressure (DBP), time-weighted triglycerides, total cholesterol, high-density lipoprotein (HDL) and low-density lipoprotein (LDL) cholesterol, and the presence of nonproliferative retinopathy at baseline. Finally, these patients were assigned to four groups by above or below median of HbA1c and the 50th group-specific percentile of CoV to compare the incident microvascular complications. All statistical tests were two-sided and P values of less than .05 were considered statistically significant. Statistical analyses were done by using SPSS 19 (IBM, Armonk, NY).
Results
Demographic and Clinical Characteristics of Participants by Quartiles of HbA1c Variability
Among the 1441 study participants, 1240 were surviving and had nonmissing information to calculate HbA1c variability. The participants’ demographic and clinical characteristics by quartiles of HbA1c variability in EDIC year 14 are described in Table 1. Among those, 252 (20.3%), 287 (24.3%), 342 (30.0%), or 377 (32.2%) had retinopathy, nephropathy, clinical neuropathy, and autonomic neuropathy in EDIC year 14, respectively. Other than all incident microvascular complications, there were differences in the trend of age, gender, time-weighted triglyceride, time-weighted BMI, and time-weighted HbA1c in the four groups (P < .05). The patients in the fourth quartile of HbA1c variability group had the highest mean HbA1c (8.4 ± 1.1%), highest female ratio (61.6%), and the lowest age (48 ± 8 years) in the four groups (Table 1). All incident microvascular complications were also higher in patients in the fourth quartile of HbA1c variability. Time-weighted total and LDL cholesterol, time weighted SBP and DBP, and duration of diabetes were not different among the four groups.
Demographic and Clinical Characteristics of Participants by Quartiles of HbA1c Variability in Epidemiology of Diabetes Interventions and Complications (EDIC) Year 14.
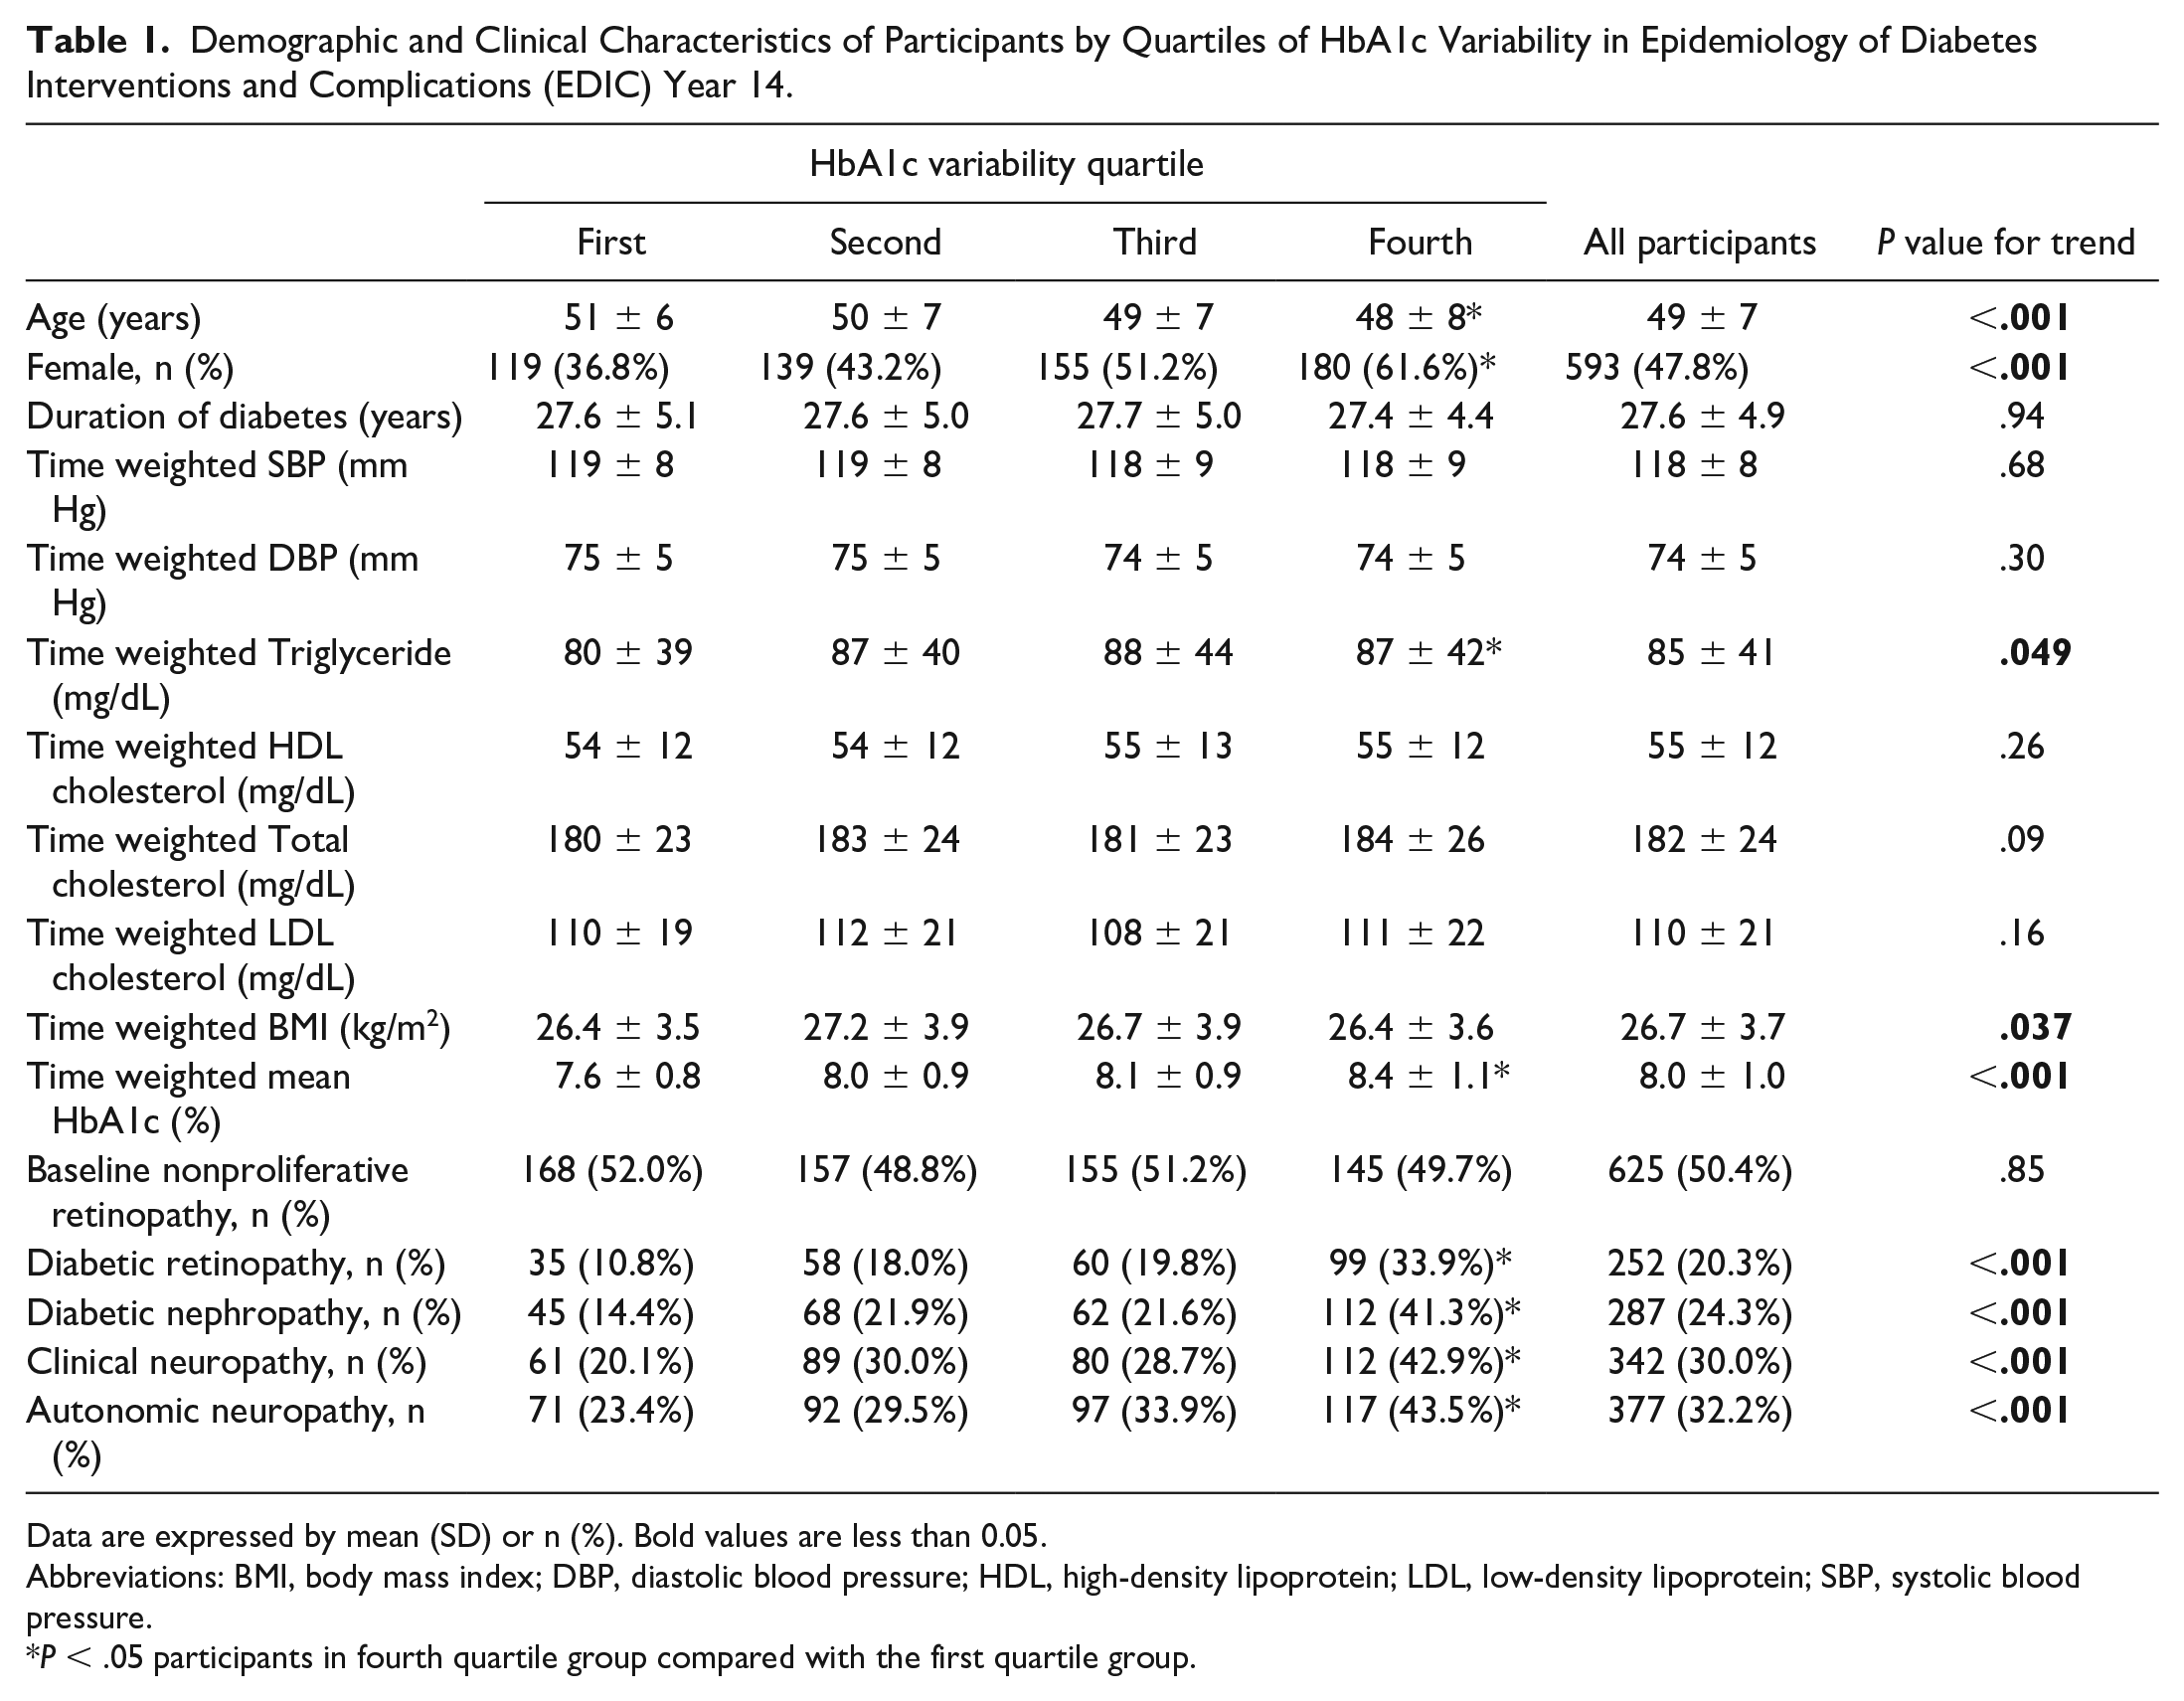
Data are expressed by mean (SD) or n (%). Bold values are less than 0.05.
Abbreviations: BMI, body mass index; DBP, diastolic blood pressure; HDL, high-density lipoprotein; LDL, low-density lipoprotein; SBP, systolic blood pressure.
P < .05 participants in fourth quartile group compared with the first quartile group.
Multivariable Modeling of Microvascular Complications
After being adjusted for clinical risk factors, the CoV of HbA1c (continuous values) was positively associated with all diabetic microvascular complications (P < .05; Table 2) with and without mean HbA1c adjustment. Specifically, it had 1.125 (1.082-1.170), 1.114 (1.074-1.154), 1.061 (1.024-1.099), or 1.088 (1.052-1.125) times higher odds (95% CI) of having retinopathy, nephropathy, clinical neuropathy, or autonomic neuropathy, independent of mean HbA1c values (P < .05, Table 2).
Odds Ratios of HbA1c Variability and Mean HbA1c to Microvascular Complications.
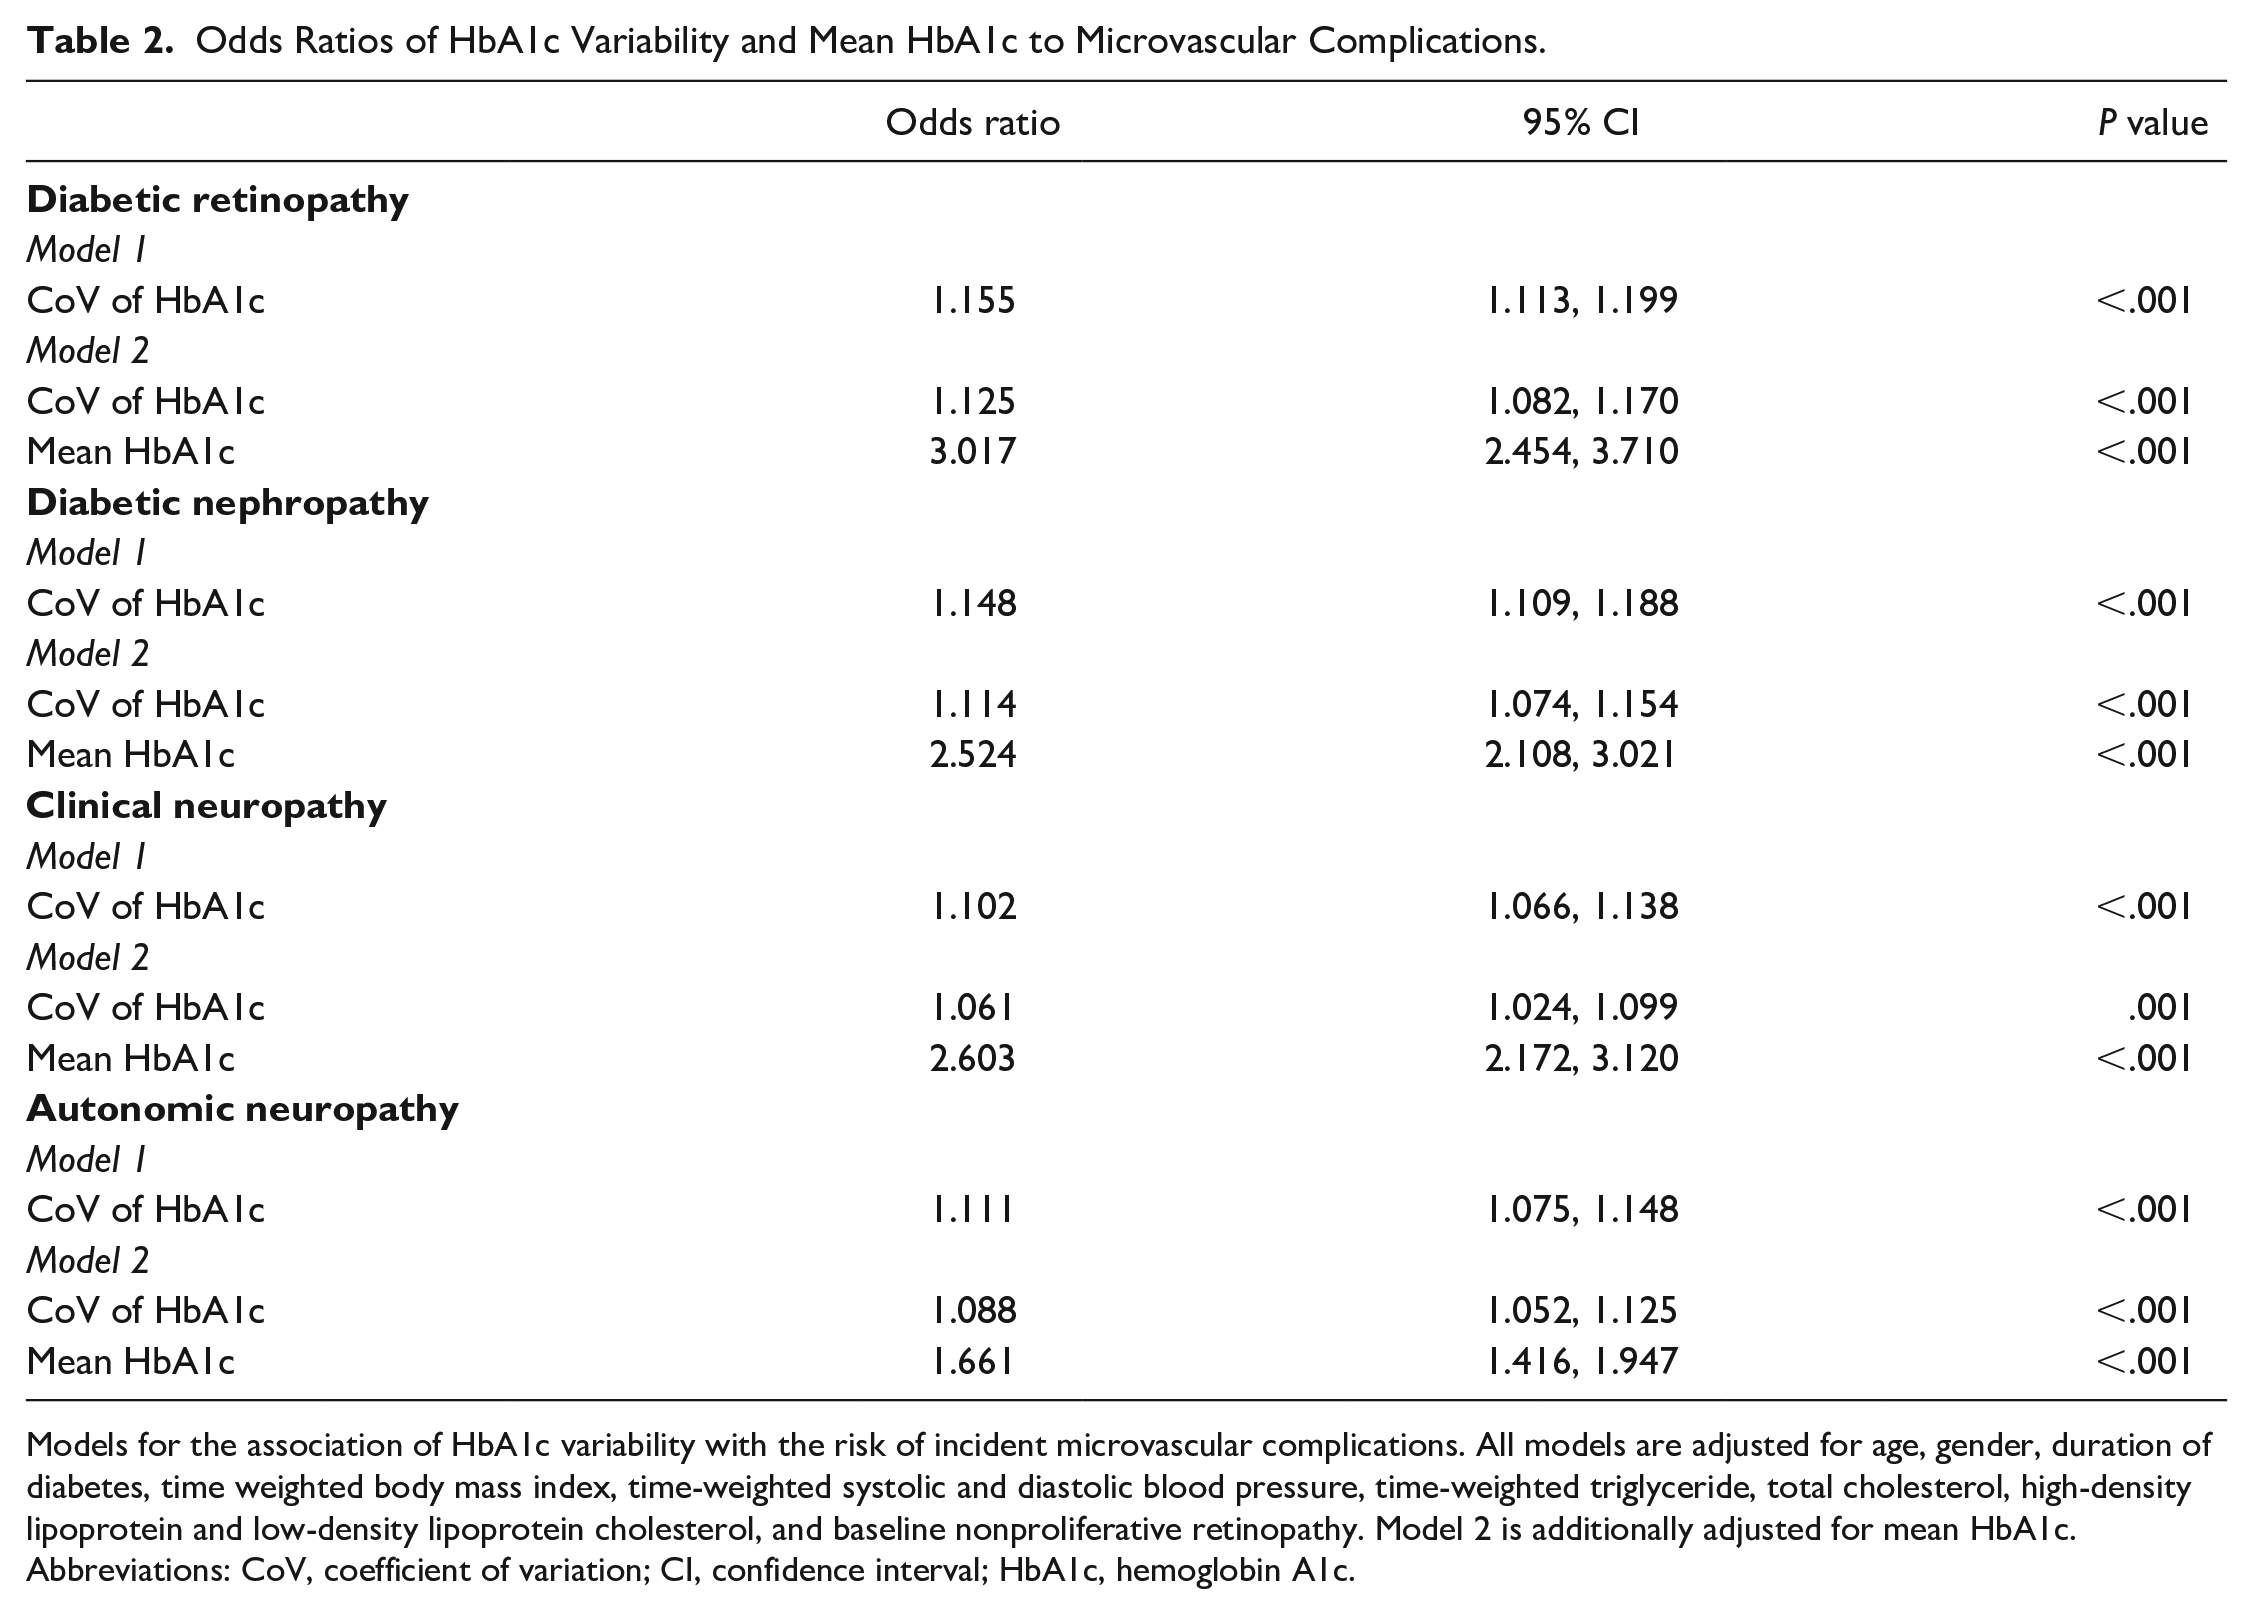
Models for the association of HbA1c variability with the risk of incident microvascular complications. All models are adjusted for age, gender, duration of diabetes, time weighted body mass index, time-weighted systolic and diastolic blood pressure, time-weighted triglyceride, total cholesterol, high-density lipoprotein and low-density lipoprotein cholesterol, and baseline nonproliferative retinopathy. Model 2 is additionally adjusted for mean HbA1c.
Abbreviations: CoV, coefficient of variation; CI, confidence interval; HbA1c, hemoglobin A1c.
Figure 1 shows the odds ratios with 95% CI of HbA1c variability or mean HbA1c values by quartiles for individual microvascular complications. After adjusting for clinical risk factors, the quartile of HbA1c variability or mean HbA1c was a significant risk factor for all incident microvascular complications (P < .05, Figure 1). Specifically, the highest adjusted risk for retinopathy (odds ratio 5.2 [95% CI 3.2, 8.4]), nephropathy (odds ratio 4.5 [95% CI 3.0, 7.0]), clinical neuropathy (odds ratio 4.3 [95% CI 2.8, 6.6]), and autonomic neuropathy (odds ratio 3.2 [95% CI 2.1, 4.8]) was seen in the fourth quartile compared with the first quartile of HbA1c variability (P < .05, Figure 1). Figure 2 shows the odds ratios with 95% CI of HbA1c variability quartiles by mean HbA1c quartiles to individual microvascular complications, and the statistical significance of the interactions between HbA1c variability quartiles and mean HbA1c quartiles. After adjusting for clinical risk factors, HbA1c had a much larger impact on all complications than HbA1c variability, and the impact of HbA1c variability on complications was greater when HbA1c was higher. However, no statistically significant interactions were identified between mean HbA1c and HbA1c variability (Figure 2).
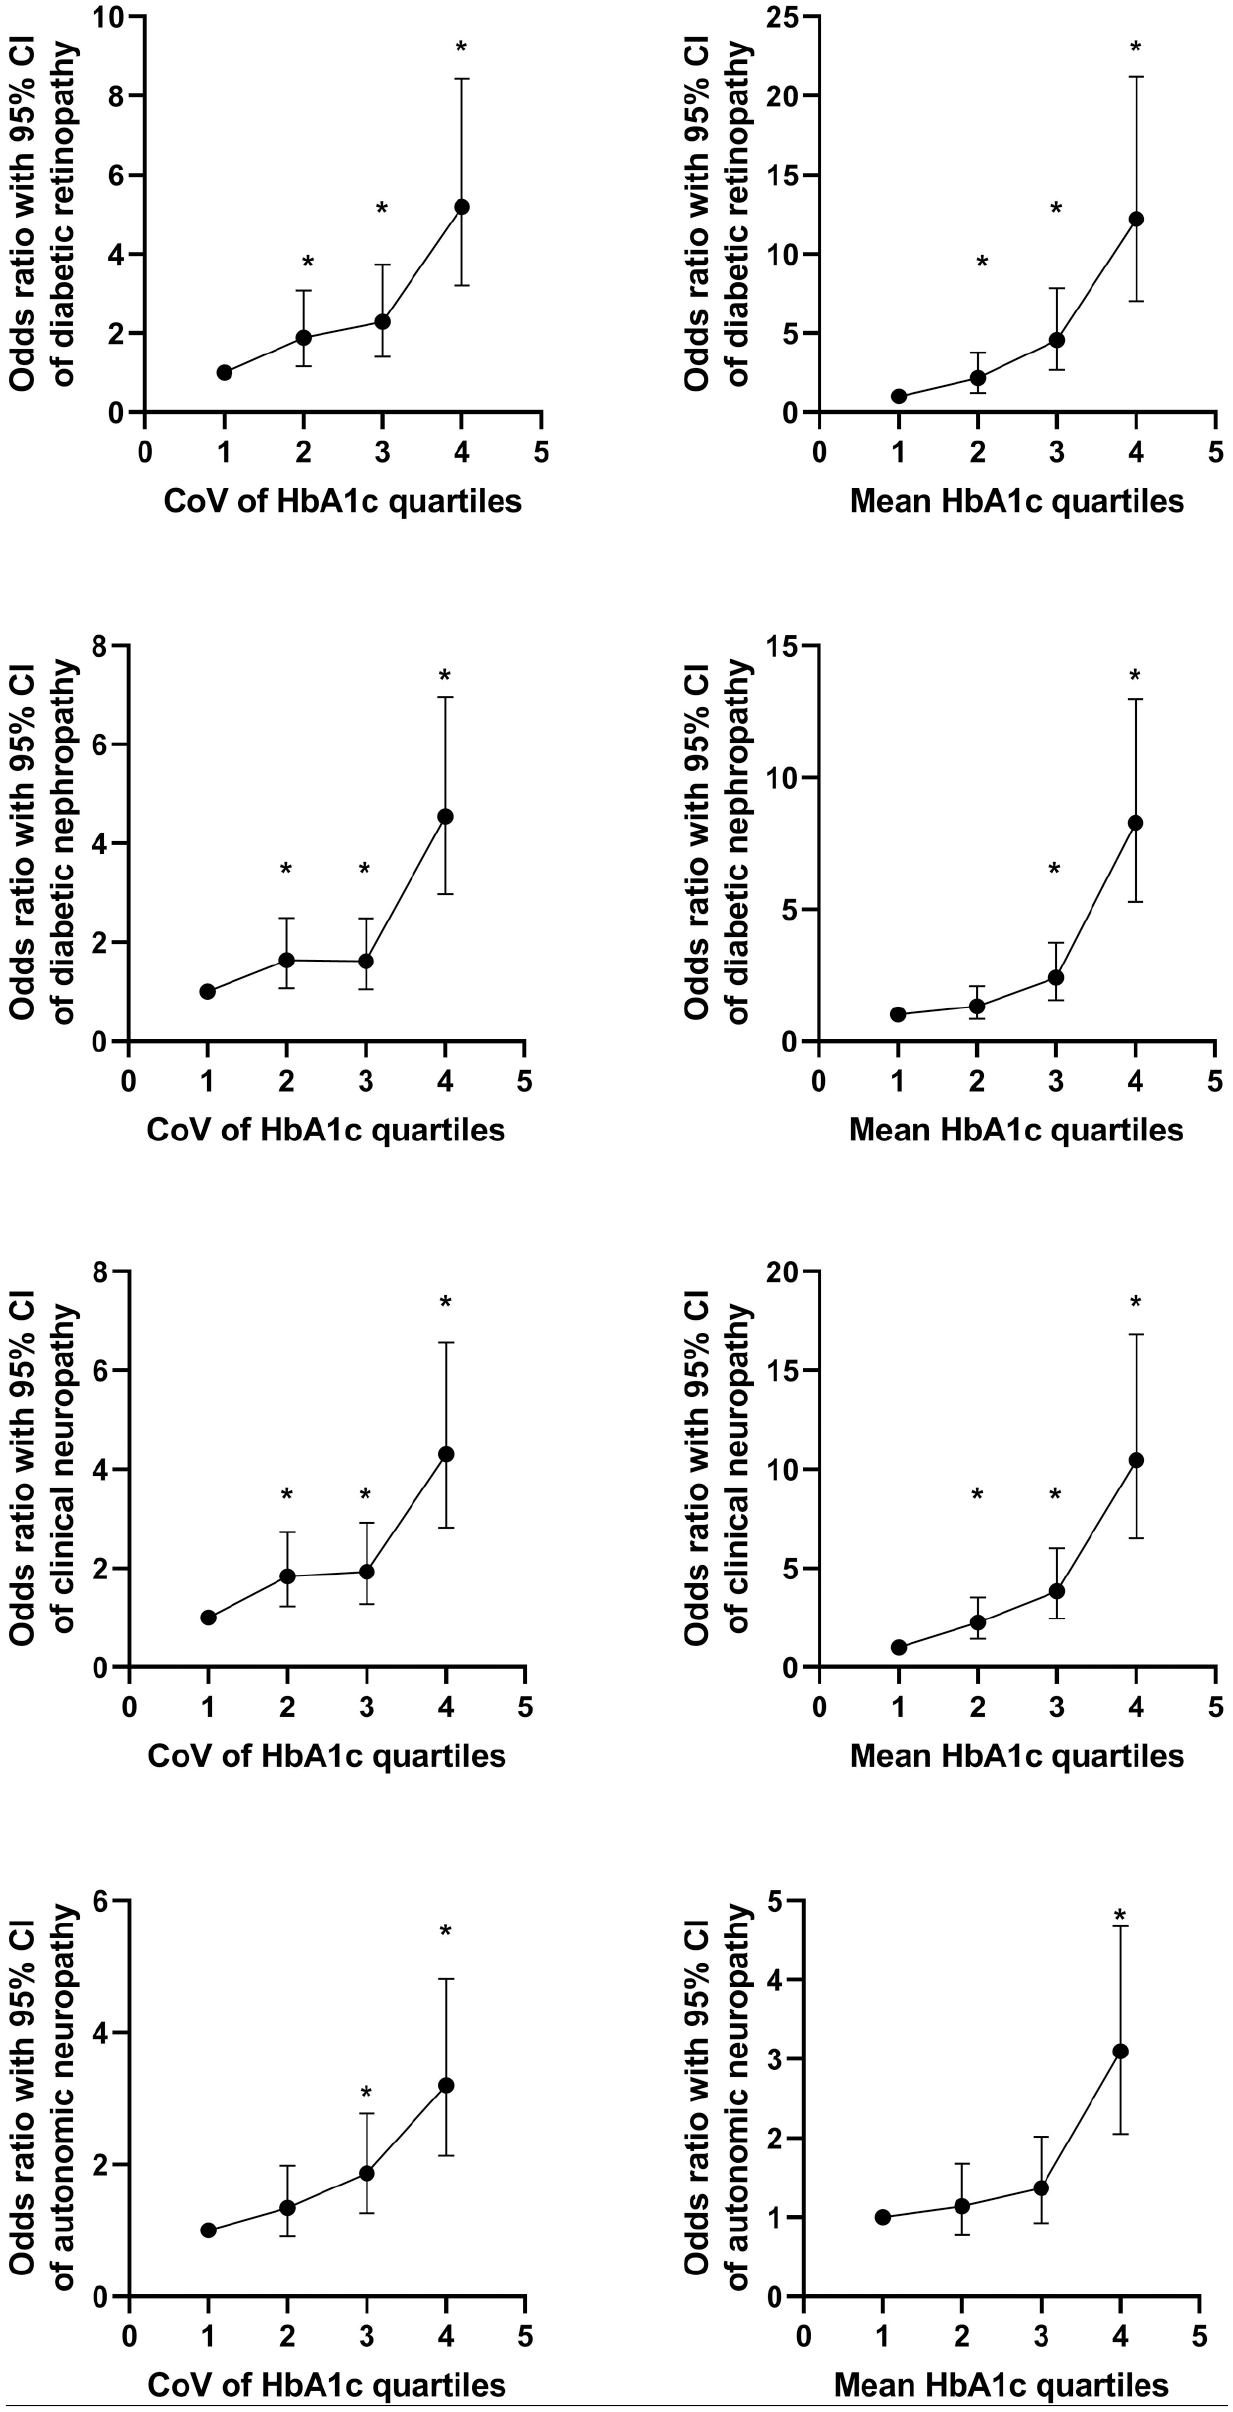
Odds ratios with 95% CI of HbA1c variability or mean HbA1c values to individual microvascular complications by quartiles, after adjusting for gender, age, duration of diabetes, time weighted body mass index, time weighted systolic blood pressure and diastolic blood pressure, time weighted triglyceride, total cholesterol, high-density lipoprotein and low-density lipoprotein cholesterol, and the presence of nonproliferative retinopathy at baseline. The quartiles of HbA1c variability were 4.1% to 8.8%, 8.9% to 11.1%, 11.2% to 14.2%, and 14.3% to 35.3%, while of mean HbA1c were 5.5% to 7.4%, 7.5% to 7.9%, 8.0% to 8.7%, and 8.8% to 12.6%, respectively. *, indicates a significant difference as compared with the first quartile group (P < .05). Abbreviations: CI, confidence interval; CoV, coefficient of variation; HbA1c, hemoglobin A1c.
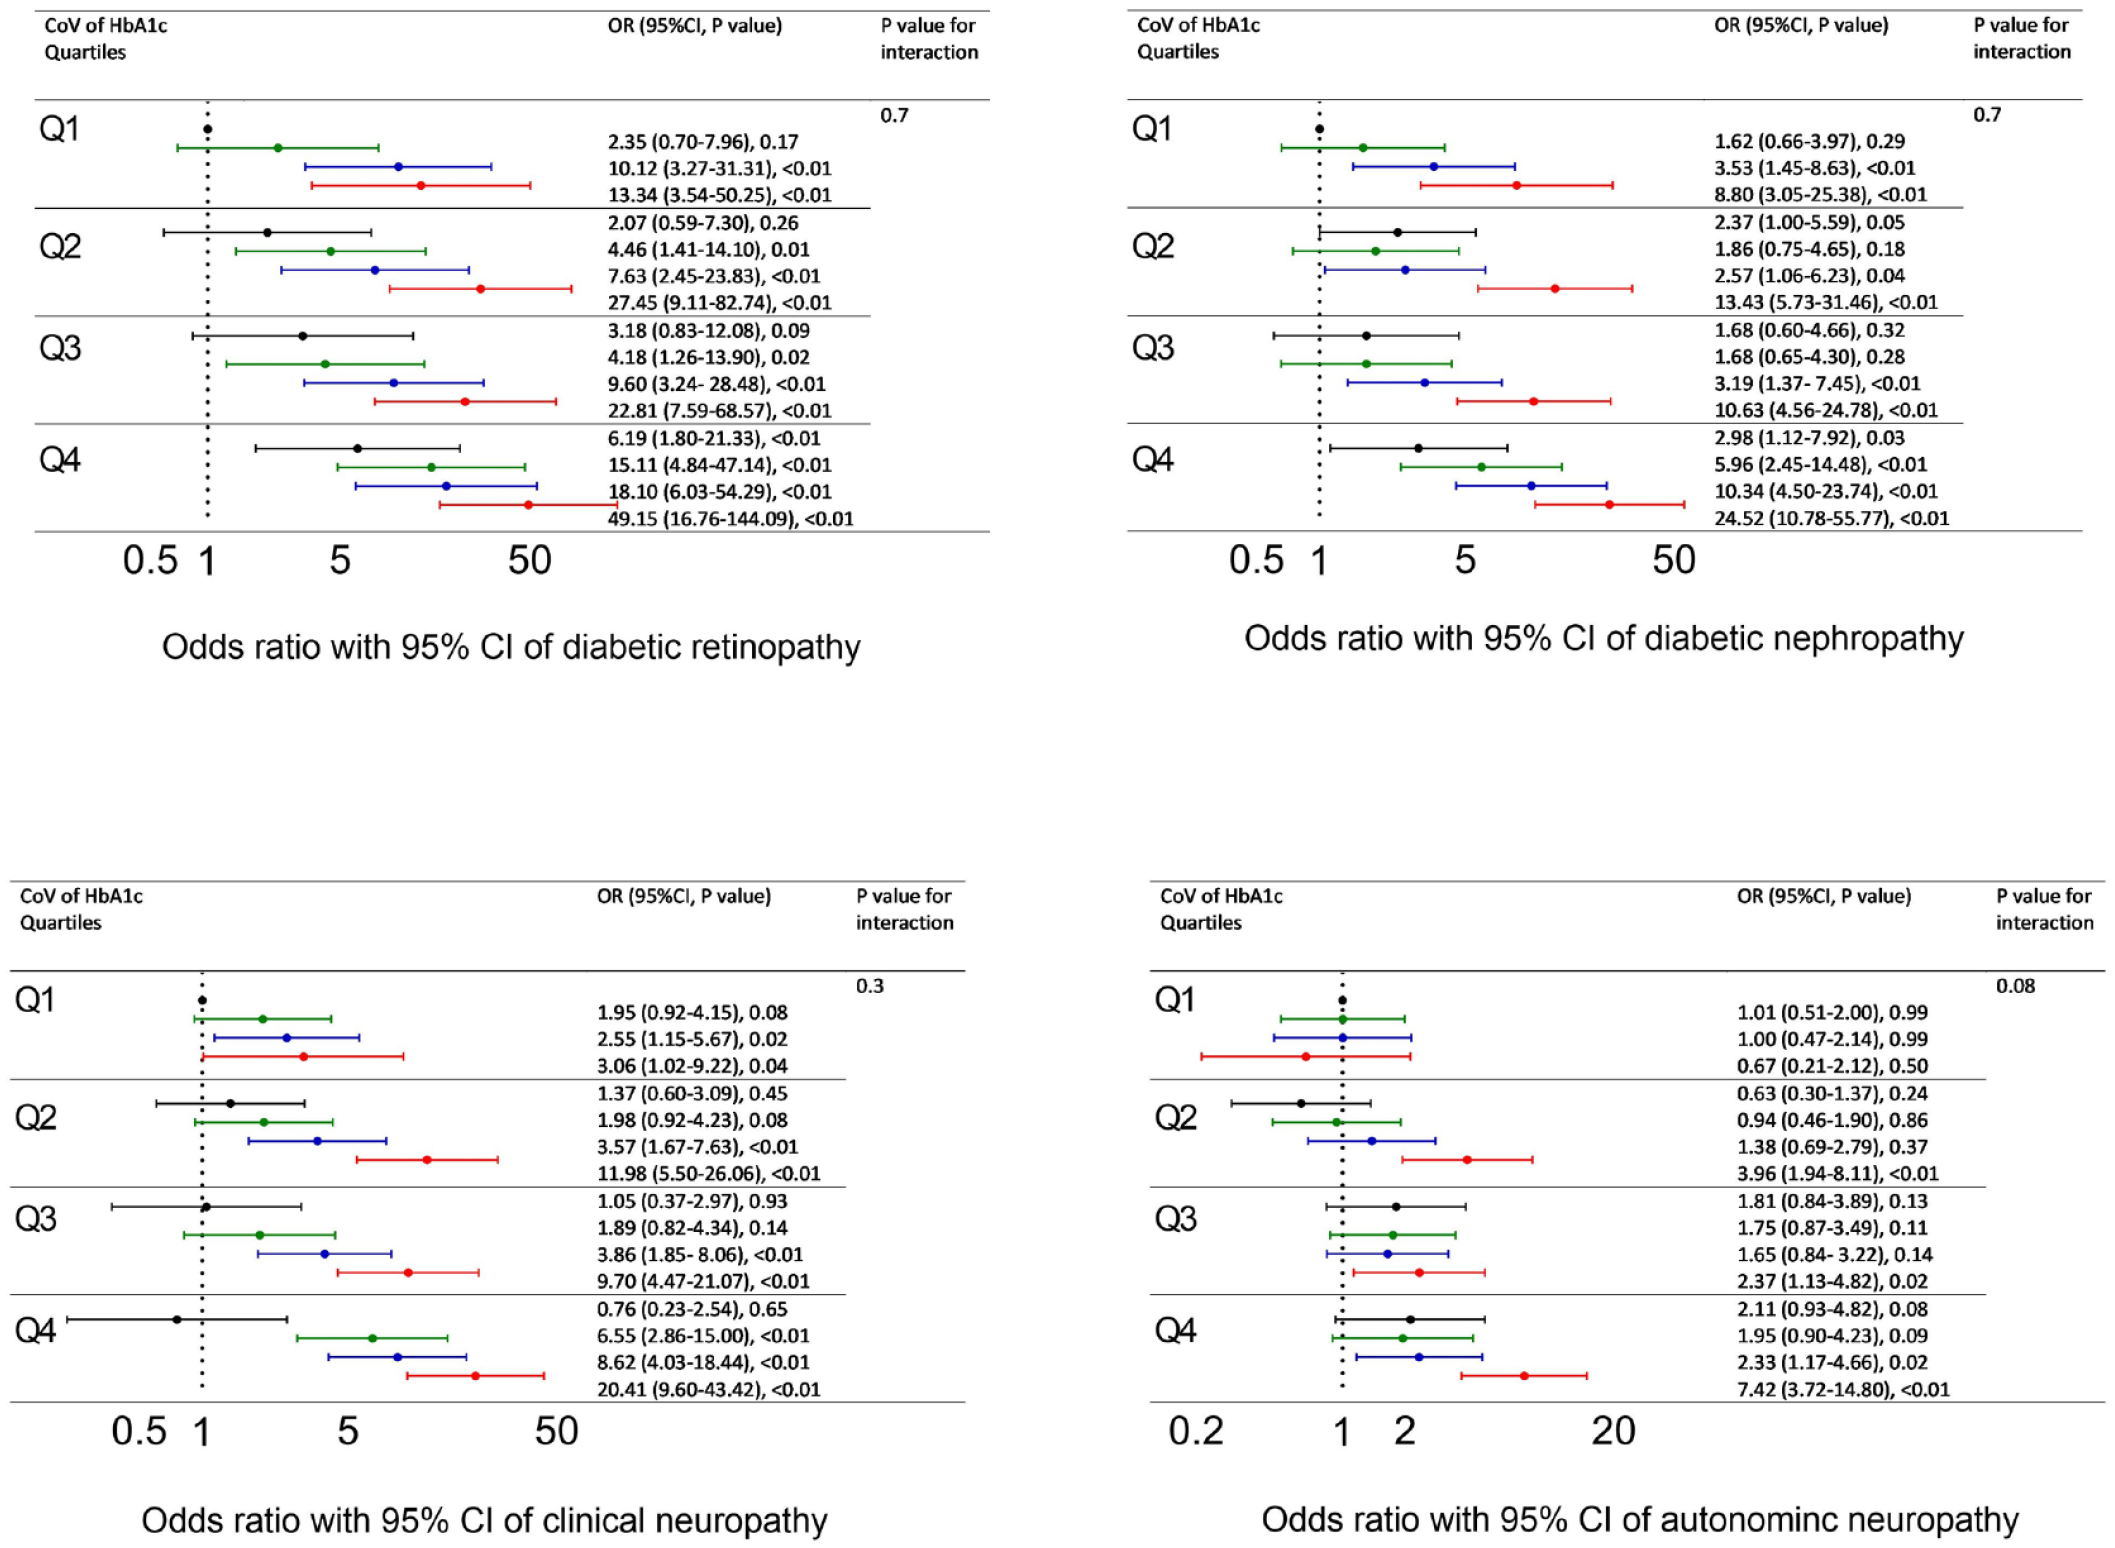
Odds ratios with 95% CI of HbA1c variability quartiles by mean HbA1c values quartiles to individual microvascular complications, after adjusting for gender, age, duration of diabetes, time weighted body mass index, time weighted systolic blood pressure and diastolic blood pressure, time weighted triglyceride, total cholesterol, high-density lipoprotein and low-density lipoprotein cholesterol, and the presence of nonproliferative retinopathy at baseline. The results were referenced to the incident individual microvascular complications in the first quartile of both HbA1c variability and mean HbA1c. Dark, green, blue, and red lines (dots) stand for the first, second, third, and fourth quartile of mean HbA1c, respectively. Abbreviations: CI, confidence interval; CoV, coefficient of variation; HbA1c, hemoglobin A1c; OR, odds ratio.
Incident Microvascular Complications by HbA1c Median and CoV 50th Percentile
All patients were assigned to four groups based on the above/below median of HbA1c (7.9%) and the 50th group-specific percentile of HbA1c variability (11.0%). The incident microvascular complications were compared (Figure 3). When the mean HbA1c value was under the group median of 7.9%, higher CoV (above 50th group-specific percentile) did not always significantly increase the incidences of microvascular complications (significance only found with autonomic neuropathy); however, when the HbA1c value was above 7.9%, higher CoV always increased the incidences of microvascular complications. In contrast, higher mean HbA1c (above median) always significantly increased the incidence of microvascular complications, regardless of whether CoV is above or below 50% group-specific percentile. The patient group who had both higher A1C and higher CoV had the highest incidences of all microvascular complications (Figure 3).
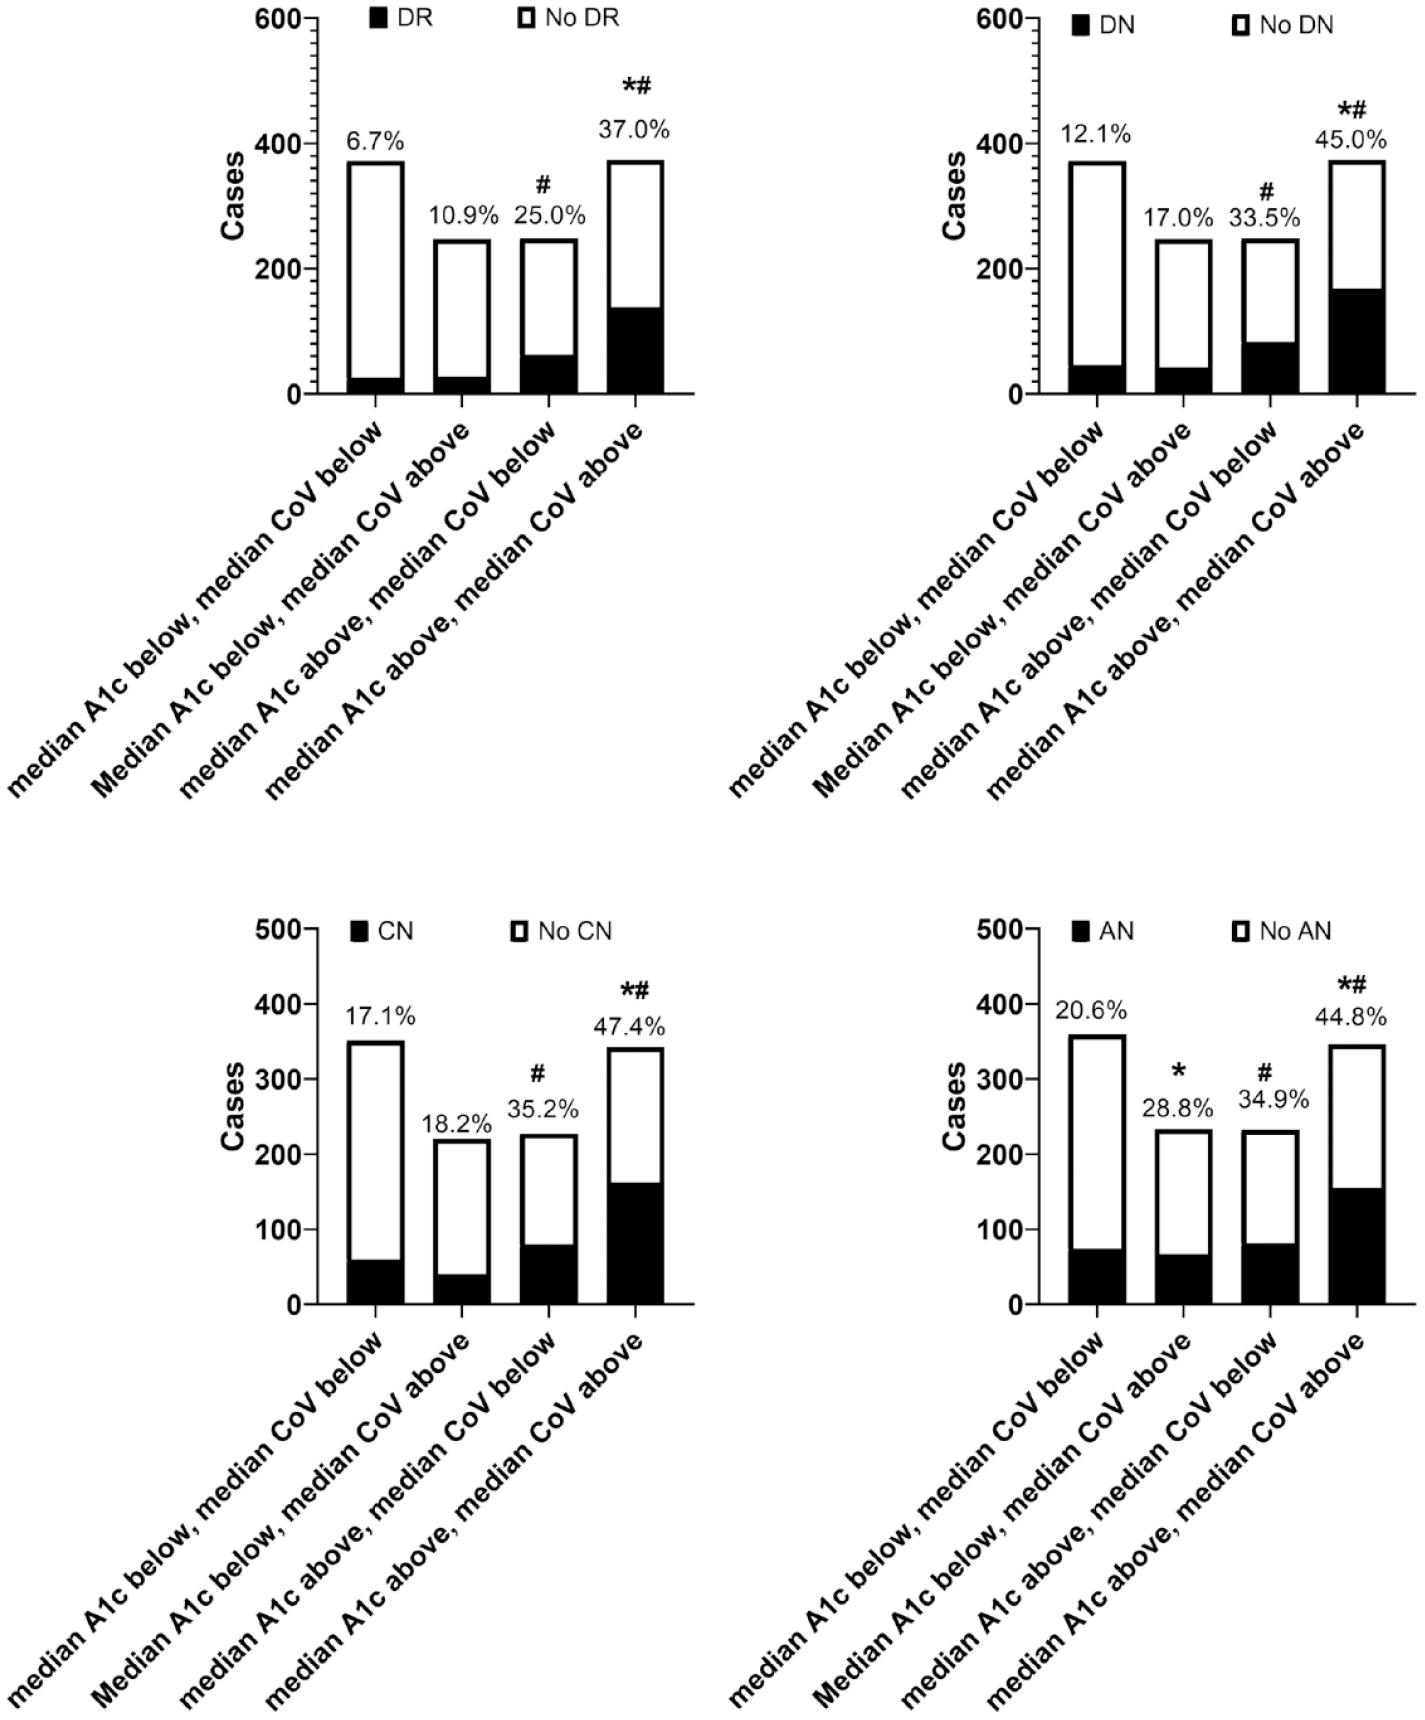
Incident microvascular complications by HbA1c median and CoV 50th percentile (median). All patients were assigned to four groups based on above/below the group median of HbA1c (7.9%) and above/below 50th group-specific percentile of HbA1c variability (11.0%). *, indicates P < .05 as compared with the CoV below group when in the same median groups; #, indicates P < .05 as compared with the Median below group when in the same CoV groups. Abbreviations: A1c, hemoglobin A1c; AN, autonomic neuropathy; CN, clinical neuropathy; CoV, coefficient of variation; DN, diabetic neuropathy; DR, diabetic retinopathy.
Discussion
By analyzing data from the DCCT/EDIC study, our results suggested that (1) long-term HbA1c variability represented by CoV was associated with a risk of all diabetic microvascular complications, independent of mean HbA1c; (2) the increased odds of having microvascular complications (except autonomic neuropathy) from CoV were about 35% to 45% of those from mean HbA1c at the fourth quartile (Figure 1); (3) the increased odds of having autonomic neuropathy from HbA1c variability was like from mean HbA1c at the fourth quartile (Figure 1); (4) there were higher incident microvascular complications with higher HbA1c variability when HbA1c value was above the group median of 7.9%, while only higher incident autonomic neuropathy with higher HbA1c variability when HbA1c was below the group median of 7.9%. In contrast to analyses of DCCT data investigating the effect of short-term glycemic variability on complication risk, 5 this study indicated that HbA1c variability may add to the mean HbA1c values in predicting microvascular complications in T1D.
Previous studies suggested that higher HbA1c variability, as measured by the SD of HbA1c values, was associated with adverse outcomes in micro- and macrovascular complications and mortality.5,6,14,15 Several studies also evaluated adverse outcomes by considering the impact of CoV.14,16,17 One study found an increased 5-year cumulative incidence of laser therapy in patients in the highest quartile of HbA1c variability. Patients in the highest quartile of HbA1c variability had an increased risk of PDR compared with the lowest quartile (hazard ratio [HR] 1.7 [95% CI 1.3, 2.2]). 14 HbA1c variability based on CoV was associated with a 3.5% higher risk of diabetic retinopathy per 1-unit increase in HbA1c CoV at 10 years of disease duration. 16 Consistently, our study also showed a significant risk of having PDR and/or laser therapy from HbA1c CoV, which was a 15.5% higher risk per 1-unit increase in HbA1c CoV at 20.5 years duration (Table 2). Besides, including 438 patients with T1D with an average follow-up of 9.2 years, another study did not show a significant impact of HbA1c variability on incident nephropathy. 17 Conversely, our current study included a larger scale of patients with longer follow-up duration and showed a significant impact of HbA1c variability on incident nephropathy. Moreover, there are no previous studies of the impact of HbA1c variability on incident diabetic neuropathy. Notably, our study showed a very strong impact of HbA1c variability on incident autonomic neuropathy even when mean HbA1c was relatively controlled (under the group median).
Several prior studies showed that HbA1c variability represented by SD was superior at predicting diabetes-related complications than mean HbA1c.5,6 However, by using CoV, which is independent of mean HbA1c, we found that HbA1c variability contributed to a much lower extent of microvascular risk (35%-45% of mean HbA1c) than mean HbA1c, except for incident autonomic neuropathy (comparable with mean HbA1c). Moreover, our results differed from previous studies on short-term glycemic variability and risk of complications.18,19 Those studies found no consistent evidence of a relationship between short-term glycemic variability and the risk of any complications in T1D. The different risk prediction results may indicate different pathological mechanisms from long- term glycemic variability.
Several different mechanisms have been proposed to explain the increased risk of microvascular complications in patients with higher HbA1c variability. Clinical and laboratory evidence shows periods of sustained hyperglycemia are “remembered” and so place patients at a higher subsequent risk of complications.20,21 The effect of HbA1c variability could be caused by the same mechanism underlying the “metabolic memory” phenomenon.22,23 Another plausible explanation is that both higher mean HbA1c and higher HbA1c variability increase the risk of microvascular complications.5,22 Therefore, their periods of sustained glycemia far above their mean will place them at an especially high complication risk, which cannot be canceled by having equal periods far below their mean.8,24 Notably, our data suggested that there were higher incident microvascular complications with higher HbA1c variability when the HbA1c value was above the group median (Figure 3). The risk of microvascular complications seems to rise nonlinearly as A1c or CoV rises (Figure 1).
The results of this study could be limited by the retrospective study design. Besides, based on the DCCT/EDIC study protocol, the participants were relatively healthy at baseline and were excluded if they had severe microvascular complications at entry, which is not typical of the general adult population with T1D. Therefore, the results could be limited by the source of patients and their generalizability.
Conclusions
In conclusion, our study showed a significant association of HbA1c variability with the incidence of microvascular complications in T1D. These associations were independent of mean HbA1c and were more prominent for adverse outcomes when mean HbA1c was relatively uncontrolled (above the group median of 7.9%). When HbA1c was below the group median, there was only higher incident autonomic neuropathy with higher HbA1c variability. These findings suggest that HbA1c variability may be a supplemental risk stratification tool to mean HbA1c for microvascular complications in T1D. Further research is required to assess whether HbA1c variability is clinically useful for risk stratification and whether it is a valuable therapeutic target.
Footnotes
Acknowledgements
The Diabetes Control and Complications Trial (DCCT) and its follow-up the Epidemiology of Diabetes Interventions and Complications (EDIC) study were conducted by the DCCT/EDIC Research Group and supported by National Institute of Health grants and contracts and by the General Clinical Research Center Program, NCRR. The data from the DCCT/EDIC study were supplied by the NIDDK Central Repositories. This manuscript was not prepared under the auspices of the DCCT/EDIC study and does not represent analyses or conclusions of the DCCT/EDIC study group, the NIDDK Central Repositories, or the NIH.
Abbreviations
AER, albumin excretion rate; BMI, body mass index; CoV, coefficient of variation; DBP, diastolic blood pressure; DCCT/EDIC, Diabetes Control and Complications Trial/Epidemiology of Diabetes and its Complications; eGFR, estimated glomerular filtration rate; ESRD, end-stage renal disease; HbA1c, hemoglobin A1C; HDL, high-density lipoprotein; LDL, low-density lipoprotein; ORs, odds ratios; PDR, proliferative diabetic retinopathy; SBP, systolic blood pressure; SD, standard deviation; T1D, type 1 diabetes.
Author Contributions
Y.M. designed the study, conducted data analysis, and wrote the manuscript. W.Z. conducted data analysis and reviewed/edited the manuscript.
Declaration of Conflicting Interests
The author(s) declared no potential conflicts of interest with respect to the research, authorship, and/or publication of this article.
Funding
The author(s) received no financial support for the research, authorship, and/or publication of this article.