
Abstract
Background:
Patients with Type 1 diabetes (T1D) have an increased risk of developing atherosclerosis and complications as myocardial infarction and peripheral artery disease. The thickening of the carotid wall and the brachial artery dysfunction are early and preclinical manifestations of atherosclerosis. The standard marker of care for assessment of glycemic control, glycated hemoglobin, does not associate with early atherosclerosis. We have hypothesized that the emerging metric of glycemic control, as the time spent in the target range (TIR), might be associated with carotid thickening and endothelial dysfunction. According to the hypothesis, we have designed the present research with the aim to evaluate the association between TIR collected in the short and long term and the measures of arterial morphology and function in patients with T1D.
Methods:
In our study, 70 patients and 35 healthy controls underwent ultrasound vascular study to measure carotid artery intima-media thickness (IMT) and brachial artery endothelial function by the flow-mediated dilation (FMD) technique. TIR was collected by a continuous glucose monitoring system for 2 weeks, 3 months, and 6 months before the vascular study.
Results:
Patients with T1D showed a significantly higher carotid IMT (mean±SE, 644±19 vs. 568±29 µ; p= 0.04) and a significantly lower FMD (mean±SE, 7.6±0.4 vs. 9.8±0.6%; p=0.01) compared with control subjects. No significant relationship between IMT, FMD, and TIR collected in the short and long term emerged.
Conclusions:
Young patients with T1D have early vascular abnormalities. The percent of TIR does not correlate with preclinical atherosclerosis. This finding underlines the complexity of the interplay between diabetes and atherosclerosis.
Keywords
Introduction
Type 1 diabetes (T1D) is a well-established risk factor for cardiovascular disease (CVD), which represents the major cause of mortality in this group of patients. The risk for cardiovascular mortality is at least two times higher in T1D than subjects without diabetes and patients with type 2 diabetes. It widely varies based on sex, age, disease duration, and presence of other complications.1,2 Patients who develop T1D in the first decade of life have a very high risk of CVD compared to patients developing T1D after the second and third decades of life. 3 The increased cardiovascular risk is attributable to several mechanisms, some of which are linked to chronic hyperglycemia, as the imbalance between atheroprotective and atherogenic properties of the endothelium, by reducing the bioavailability of nitric oxide (NO). NO is the principal regulator of vascular tone and the primary inhibitor of vasoconstrictors and pro-inflammatory molecules. 4 The abnormal synthesis and release of NO are detectable in the early stage of atherosclerosis characterized by arterial wall thickening and endothelial dysfunction. These preclinical or asymptomatic abnormalities are the early manifestations of atherosclerosis and predictors of incident cardiovascular events. Arterial thickening and endothelial dysfunction can be detected using ultrasound-based techniques, therefore offering the opportunity to identify patients requiring intensive treatment to prevent CVD.5–9
Several studies have clearly demonstrated that patients with T1D diabetes have increased carotid artery wall thickening and endothelial dysfunction.10–15 However, fasting hyperglycemia and glycated hemoglobin (HbA1c) do not associate or predict these vascular abnormalities.11,12,16
Thanks to the introduction into the market of the devices continuously monitoring blood glucose and software automatically analyzing glucose data, we have had the opportunity to evaluate glycemic control beyond HbA1c. Although HbA1c is the gold standard of care for assessment of glycemic control, it does not reflect the extent of the overall time spent in the target range (TIR), the glycemic variability (GV), and the burden of hypoglycemia. 17 This metric might have great potential in terms of disease management and prediction of complications. Recently, a significant and inverse relationship between TIR and the presence of micro-angiopathy, specifically retinopathy, nephropathy, and cardiac autonomic neuropathy, has been described.18-21 In type 2 diabetes, TIR seems to be significantly and inversely associated with early carotid atherosclerosis. 22 Currently, there are no data about the association between preclinical manifestation of atherosclerosis and metric of glycemic control in T1D and, as previously detailed, patients with T1D have a high cardiovascular risk. In the present research, we have investigated the association between TIR and intima plus media thickness (IMT) of carotid arteries and endothelial function at the brachial artery in patients with T1D. We have also evaluated the association between IMT, FMD and Time Below Range (TBR), Time Above Range (TAR), mean daily glucose, and GV.
Methods
Study Design and Patients: This is a cross-sectional study including patients with T1D who consecutively attended in six months the diabetes care center, University Magna Graecia teaching hospital. In addition to T1D, the further inclusion criteria were the use of real-time continuous glucose monitoring (rtCGM) from at least six months, at the time of the enrolment, and a wear time ≥ 70%. Exclusion criteria were: known cardiovascular disease (myocardial infarction, angina, stroke, peripheral arterial disease), use of vasoactive drugs as calcium channel blocker, nitrates, beta and alfa blockers, concomitance of diseases such as infection, surgery, and any acute event requiring intensification of insulin treatment, treatment with corticosteroids, and pregnancy. Control subjects, comparable for sex and age, were enrolled among students attending the Medical School and Hospital personnel on a voluntary basis. The exclusion criteria were diabetes, both type 1 and type 2 and, as for patients with T1D, known cardiovascular disease (myocardial infarction, angina, stroke, peripheral arterial disease), use of vasoactive drugs as calcium channel blocker, nitrates, beta and alfa blockers, and pregnancy. The research was submitted to the local Ethical Committee ‘Azienda Ospedaliero-Universitaria Mater Domini’, and eligible patients and control subjects who gave their informed consent were enrolled. The research was performed according to the principles of Good Clinical Practice. Systolic and diastolic blood pressure (SBP, DBP), body weight, height, HbA1c, fasting plasma glucose, lipids (total cholesterol, HDL-cholesterol, triglycerides) were measured at the time of the recruitment in T1D. HbA1c was measured by high-performance liquid chromatography aligned with DCCT (HbA1c-DCCT). Fasting plasma glucose and lipids were measured with commercially available kits. Body mass index (BMI) was calculated according to the formula: kg/m2. Disease duration, concomitant diseases, diabetes complications, and ongoing treatment were obtained from the electronic clinical records. According to national guidelines, all patients with T1D attending our center are regularly screened for diabetes complications. 23 Among control subjects, the presence of hypertension and hyperlipidemia was self-reported and confirmed by ongoing treatment.
Glucose Metric: The novel glucose metric TIR, TAR, TBR, mean daily glucose, and GV was collected 2 weeks, 3 months, and 6 months before the vascular study by the ambulatory glucose profile (AGP) generated by the specific software as Clarity, Eversense diabetes management system, Carelink, and Diasen/Glooko. The most recent 2 weeks are a sufficient collection interval evaluating the overall time spent in the target range. A more extended collection period offers a more robust evaluation of time spent in hypoglycemia and GV. 17 We also believe that a more prolonged observation time may be appropriate for the aim of the study. The selection of the 3 and 6 months was arbitrary. TIR was defined as the percentage of the time spent in the target of 70–180 mg/dL, TBR range as the percentage of the time spent below the TIR, and TAR as the percentage of the time spent above the TIR. Mean daily glucose represents the mean of all glucose values measured in the selected time range (2 weeks and 3 months). TIR, TBR, TAR, and mean glucose are automatically generated by the software. GV has been expressed as the Coefficient of Variation (CV). CV is not automatically calculated by all the available software analyzing data. Therefore, when applicable, the following formula was used: CV= (Standard Deviation/mean daily glucose) × 100.
Vascular study: The study was performed in the morning using an Echo-Doppler Philips HD 11XE (Royal Philips Electronics, the Netherlands) equipped with a 12–3 MHz linear array transducer and simultaneous ECG recording, in a temperature-controlled (20–24°C) room, and after the patient was at rest for 10 minutes in the supine position. Participants were asked to abstain from exercise, alcohol, caffeine, food, and smoking for 12 hours before the study.
Participants were invited to extend the neck to visualize the common carotid artery (CCA) 1 cm below the carotid bulb in three different projections, anterior, lateral, and posterior. The transducer position was then adjusted to obtain an angle between the ultrasound beam and the vessel’s longitudinal axis at 90°. The gain was fine-tuned to improve the image of the intima plus media complex of the far wall, defined as the distance between the leading edge of the lumen–intima interface and the inner edge of the media–adventitia interface. Images were then recorded for the offline measurement of IMT using dedicated software. 6 Mean IMT was defined as the mean of the values measured at the three projections in the right and left CCA. The mean-maximal IMT was defined as the maximal value between the mean IMT of the right and the left CCA.
Eleven participants (6 with T1D and 5 healthy subjects) were studied twice apart to estimate the intra-operator reproducibility of the IMT measurement. The calculated coefficient of correlation was 0.98.
The endothelial function of the brachial artery was evaluated in the non-dominant arm by using
two different stimuli, ischemia and exercise. Ischemia is a transient and vigorous stimulus, while exercise is a less vigorous and sustained stimulus that produces a more common in-vivo occurrence.24,25 Both stimuli induce the reduction of peripheral resistance downstream to the brachial artery, causing the increase of brachial artery blood flow velocity. This phenomenon, defined as reactive hyperemia, is responsible for the following brachial artery dilation, known as flow-mediated dilation (FMD). FMD is expressed as the percentage change of brachial artery diameter from baseline to the end of each test. The magnitude of FMD is proportional to the endothelium’s ability to stimulate the dilation of the brachial artery in response to stimuli.
In both tests, the brachial artery internal diameter (ID) was defined as the distance between the intima–lumen interface of the near-wall and lumen–intima interface of the far wall. Ischemic and exercise tests were performed on the same day, at least 30 min apart. The second test was not performed until the baseline brachial artery ID was restored. In both the experiments, the brachial artery was imaged ~3–4 cm above the elbow in the longitudinal section on the anterior side of the biceps muscle keeping the angle between the ultrasound beam and the vessel at 90°. The gain was fine-tuned until the lumen–intima interface was clear. Images were recorded for offline measurement. 6 An ischemic test was carried out by inflating a pneumatic cuff around the forearm up to 250 mmHg and maintaining inflation for 5 min. Brachial artery ID was recorded at baseline and 1 min after cuff release. The exercise test was performed using the handgrip manometer. Participants were instructed on how to perform a maximal voluntary contraction (MVC) and a short bout of isometric handgrip exercise in a 2 s contraction:3 s relaxation ratio with the non-dominant arm. The exercise test consisted of 12 contractions min-1 for a total of 6 minutes of handgrip exercise at 30% intensity of MVC. MVC was evaluated at the beginning of the visit to avoid any interference with vascular tests. The duration and the intensity of the exercise were preliminarily established in healthy volunteers. Six minutes and 30% of MVC represented the maximal contraction, ensuring an adequate vasodilation without systemic hemodynamic changes (heart rate and blood pressure) and pain or fatigue.
FMD after ischemia was calculated using the following formula: [(after ischemia ID)-(baseline ID)/(baseline ID)] × 100.
FMD during handgrip exercise was expressed as percentage change from baseline and calculated using the following formula: [(1-2-3-4-5-6-min exercise ID) – (baseline ID)/(baseline ID)] ×100.
The reproducibility of the FMD after ischemia and exercise was calculated in 6 patients with T1D and 5 healthy subjects. Vascular studies were performed on two different days and in the same condition. The coefficient of correlation between the first and the second ischemic test was 0.99, and between the first and the second exercise test 0.98.
Statistical analyses: The sample size was calculated using the correlation sample size formula for one group: N=[(Zα+Zβ)/C]2+3, where Zα (standard normal deviate for α)=1.96, Zβ (standard normal deviated for β)=0.842, alfa= 0.05, and beta=0.20, C=0.5*ln[(1+R)/(1 – R)]. 26 The formula estimates the number of subjects to be recruited to establish a significant correlation between TIR and IMT and FMD. Currently, there are no data evaluating the linear association between TIR and preclinical atherosclerosis. Therefore, we have set the expected correlation (R) = 0.35 according to the known association between IMT, FMD, and age. 12 The total calculated number of subjects to be recruited, with an anticipated drop-out=10%, was 68.
All tests were performed using SPSS 23 for Microsoft (SPSS, Inc., Chicago, IL). Shapiro-Wilk test was applied to verify the normal distribution of the data. Variables not normally distributed were TBR and CV. The two-step rank transformation before applying parametric tests was used. Patients with diabetes were divided into three groups, according to TIR tertiles. The two-tailed t-test for unpaired data was used to compare continuous variables between T1D and the control group. The analysis of variance (ANOVA) test for repeated measures was applied to evaluate the difference among glucose metrics collected over 2 weeks, 3 months, 6 months. The one-way ANOVA was used to compare IMT and arterial dilation during ischemia and handgrip exercise among TIR tertiles. The univariate general linear model, and the general linear model for repeated measures were used to compare variables between T1D patients and control subjects after correction for SBP and BMI. The linear regression analysis was performed to evaluate the association between mean-maximal IMT, FMD (after ischemia and at the 6th min of exercise), and glucometric parameters. An additional linear regression analysis was performed to evaluate the association between IMT, FMD, age, and disease duration. Results have been displayed as beta coefficient and 95% confidence interval. Two-tailed p < 0.05 was set as the statistical significance level.
Results
Consecutively 70 patients with T1D who met inclusion criteria and 35 control subjects were enrolled. Anthropometric and clinical characteristics of patients with T1D and controls are shown in Table 1. Patients with T1D had a significant higher BMI and SBP compared to control subjects. Hypertensive and hyperlipidemic patients and controls were all taking renin–angiotensin–aldosterone system (RAAS) blockers and statins. Among patients with T1D, 22 (31%) were on continuous subcutaneous insulin infusion (CSII) and 48 (69%) on multiple daily insulin injections (MDI). They were all using rtCGM (Eversense, Dexcom, and Enlite/Guardian). Mean±SD of glucose parameters evaluated 2 weeks, 3 months, and 6 months before HbA1c has been listed in Table 2. No statistically significant difference was detected among the percentage of TIR, TBR, TAR collected in the three-time intervals. The CV was significantly different among the three groups, and the value was higher in the 6-month interval. The thickness of the CCA and the function of the brachial artery, adjusted for SBP and BMI, of T1D patients and control subjects are displayed in Table 3. The mean IMT of the right CCA and the mean-maximal IMT of CCA were significantly higher, and FMD significantly lower in T1D than the control group. The baseline brachial artery ID was comparable between groups. The percentage of brachial artery vasodilation significantly increased during handgrip exercise in both groups (ANOVA p=0.0001) but was significantly lower in T1D than controls (Figure 1).
Anthropometric and Clinical Characteristics of Patients with T1D and Controls. Data are Displayed as Mean ± SD or Percentage.
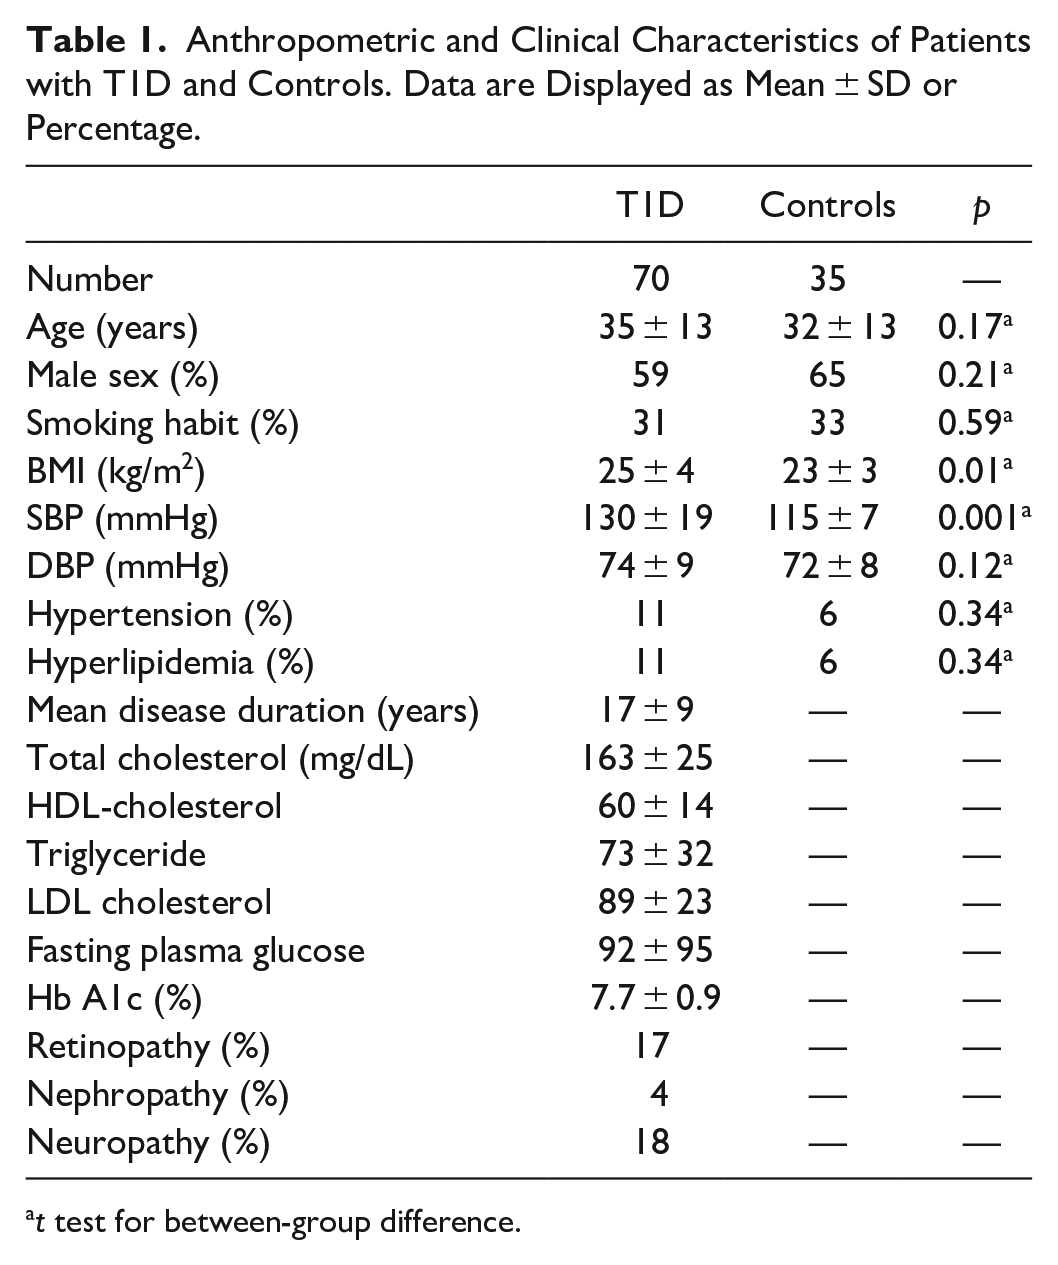
t test for between-group difference.
Glucose Metric Measured Over 2 weeks, 3 months, and 6 months in T1D Patients. Data are Displayed as Mean ± SD.
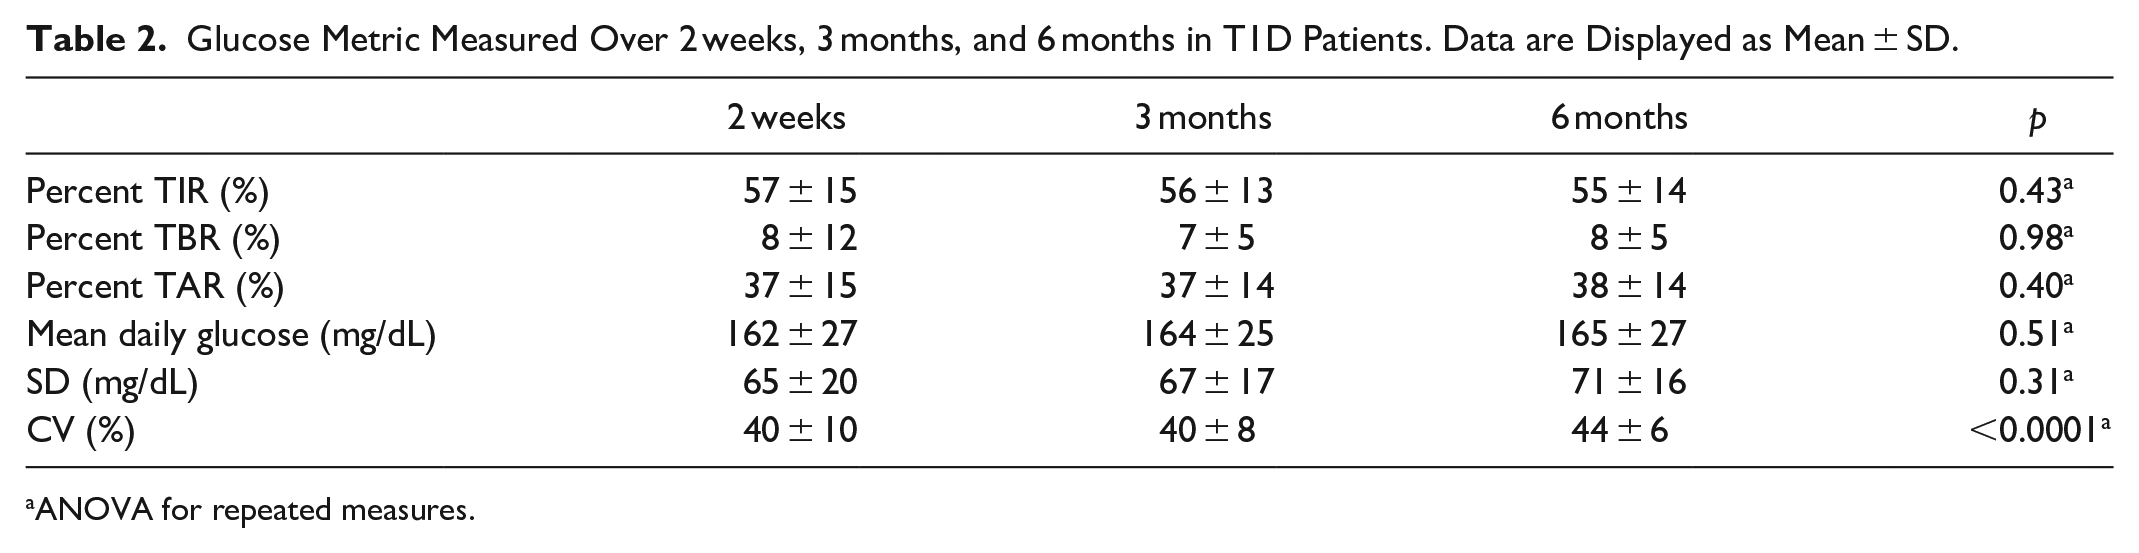
ANOVA for repeated measures.
Mean and Mean-Maximal IMT of CCA, Baseline Brachial Artery Diameter, and FMD After Ischemia in Patients with T1D and Control Subjects. Data are Displayed as Mean ± SE.
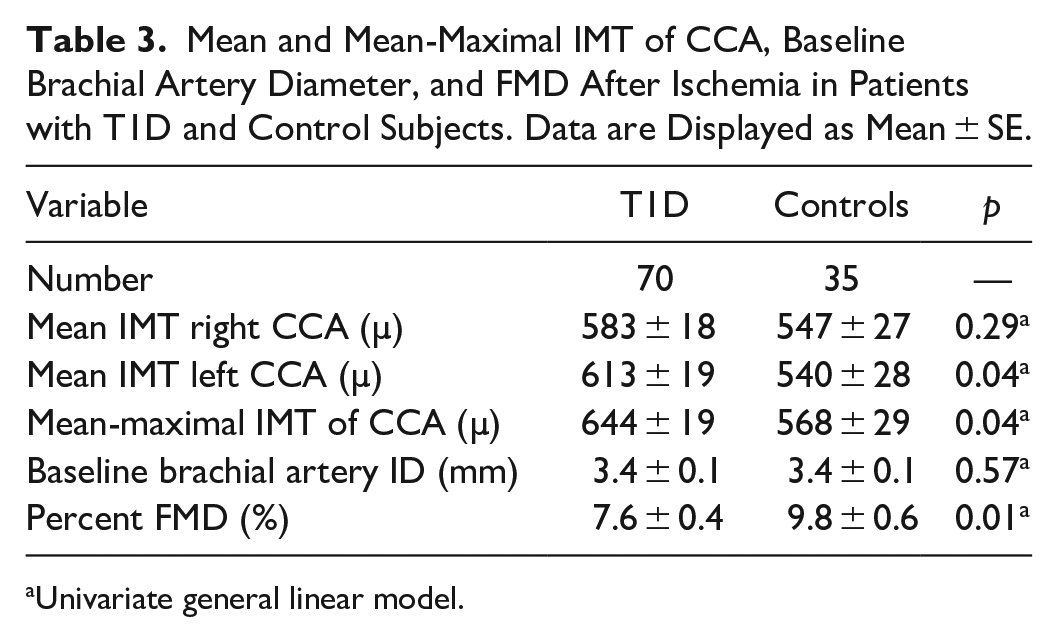
Univariate general linear model.
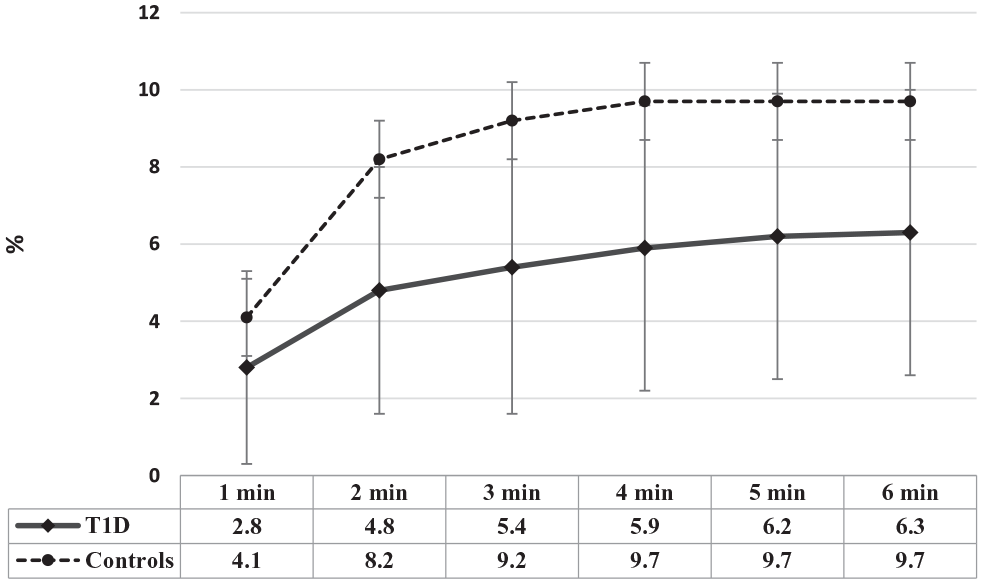
FMD during 6 min of handgrip exercise in T1D and control subjects. Data are displayed as mean ± SE.
We have then divided patients with diabetes according to TIR tertiles and compared mean-maximal IMT and FMD. No statistically significant difference was found among groups either when TIR was collected in 2 weeks, 3 months, and 6 months. In Figure 2 we have displayed the mean-maximal IMT of CCA, and FMD after ischemia and exercise in patients divided according to 6-month TIR tertiles.
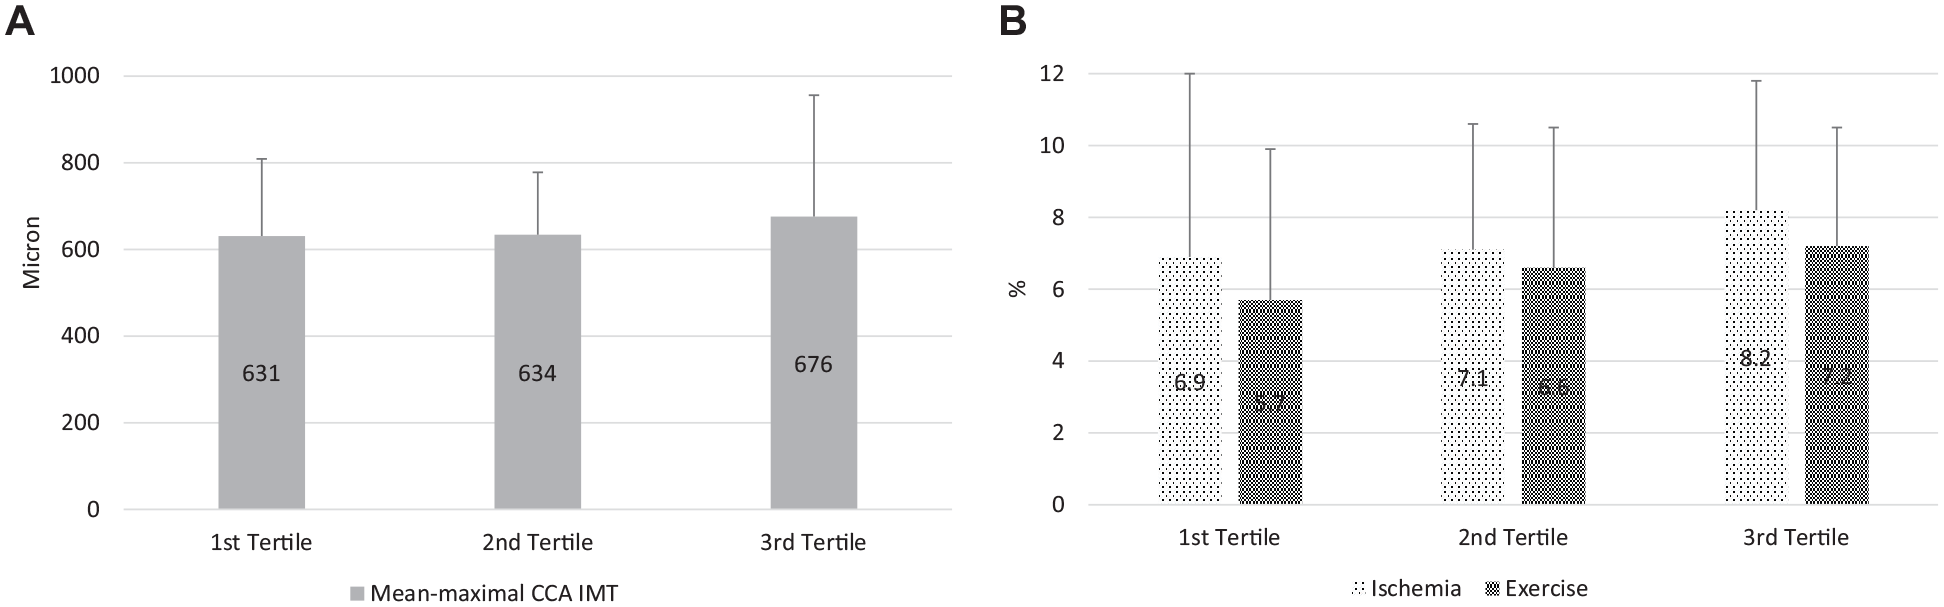
Mean-maximal IMT of CCA [panel A], and FMD after ischemia and at 6th minute of handgrip exercise [panel B] in patients divided according to 6-month TIR tertiles. Data are displayed as mean ± SD. One-way ANOVA
The regression analysis did not reveal any statistically significant association between TIR, mean-maximal IMT of CCA, and FMD of the brachial artery after ischemia and handgrip exercise (Table 4).
Association of TIR with mean-maximal IMT of CCA, and FMD after ischemia and at the 6th minute of handgrip exercise in Patients with T1D.
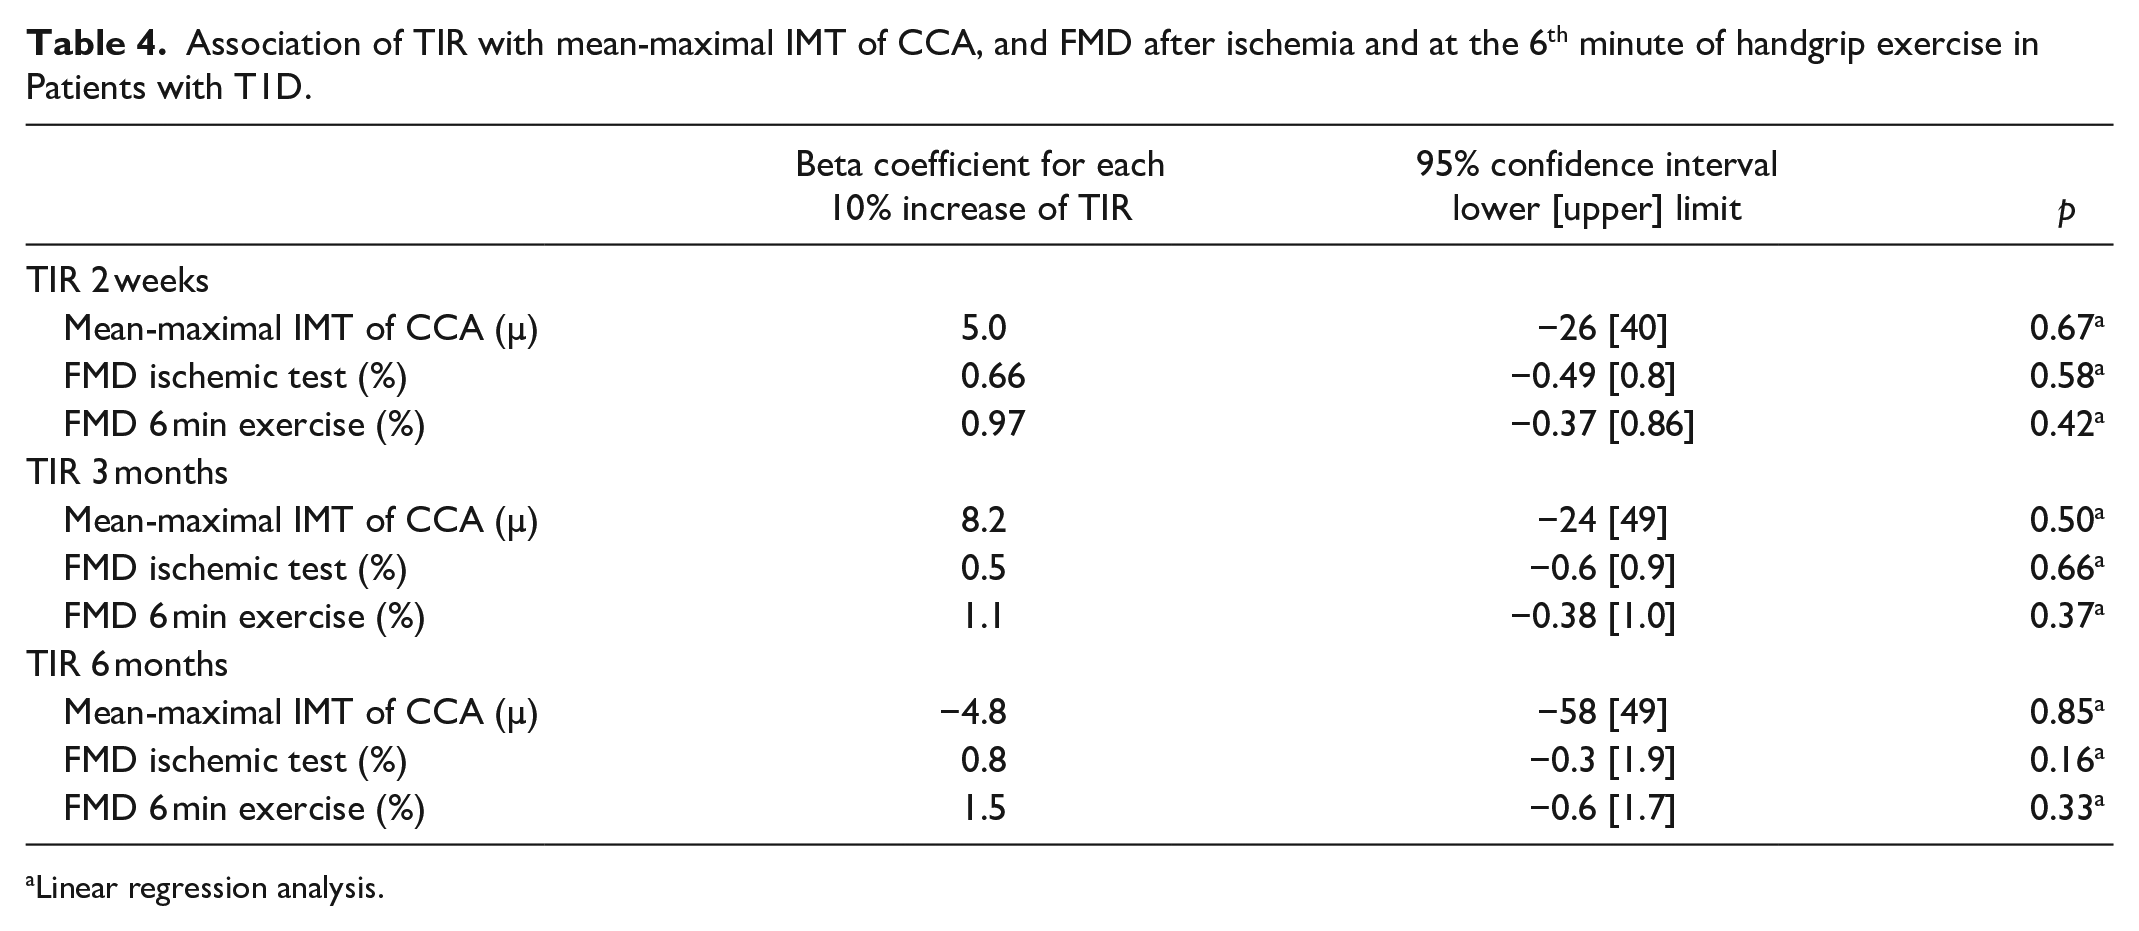
Linear regression analysis.
No association was also detected between the thickness of the CCA and the function of the brachial artery and TBR, TAR, mean daily glucose, and CV. HbA1c also did not significantly associate with IMT and FMD. Conversely, a significant association was found between mean-maximal IMT, FMD, age, and disease duration. The beta coefficient, and the 95% confident interval were respectively: mean-maximal IMT-Age 0.77 [9.7, 14.5], p<0.0001; mean-maximal IMT-disease duration 0.52 [6.5, 15.3], p<0.0001; FMD after ischemia-Age −0.30 [−0.2, −0.02], p<0.01; FMD after ischemia-disease duration −0.35 [−0.2, −0.1], p<0.02; FMD at 6th min exercise-Age -0.31[−0.2 −0.05], p<0.01; FMD after 6 min exercise-disease duration −0.31[−0.2 −0.03] p<0.01.
Discussion
Our study demonstrates that TIR does not associate with early preclinical atherosclerosis, such as common carotid artery IMT and FMD. TBR, TAR, mean daily glucose, and GV were also not associated with atherosclerosis.
Before discussing these results in detail, it is necessary to underline two findings of the present study. Patients with T1D exhibit higher mean-maximal IMT value of the CCA and lower vasodilation than healthy control subjects. IMT and FMD are significantly correlated to age and disease duration. These findings confirm similar observations already known in the literature and demonstrate that the data have been correctly collected and are consistent with what is expected.10–15
The lack of association between TIR and other glucose metrics and early markers of atherosclerosis has possible manifold explanations discussed below.
The chosen periods (2 weeks, 3 months, 6 months) may be too short of influencing the measured atherosclerosis markers. The 2-week time was selected to check whether a proper glucose-metabolic control of even a few days could affect endothelial function. The 3- and 6-month time were chosen to evaluate the effect of a more prolonged observation period on both endothelial function and arterial wall thickness. We cannot rule out that an extended glucose-metabolic control period may significantly affect the measured vascular parameters. That may be the object of further research.
Furthermore, TIR indicates the percentage of values between 70 and 180 mg/dL (3.9–10 mmol/L) overall the day. It does not explicitly identify postprandial hyperglycemic exposure that is independently associated with CVD and endothelial function.27,28 Moreover, the standard range may be too broad and may not precisely separate patients with proper metabolic compensation from those with less acceptable blood glucose. Another possible explanation is that our measurement systems evaluating arterial morphology and function were not accurate enough to detect small differences, such as those expected in this study. However, IMT and FMD measurements were done with the appropriate instrument and transducer and following suggested protocols. Measurement of IMT is a well-standardized technique. Although mean-maximal IMT in our T1D patients is below the value considered at high risk for incident cardiovascular events, it is higher than IMT detected in healthy subjects of similar age.
Two different techniques have explored endothelial function; the widely used FMD technique to induce forearm ischemia stimulating vasodilation and the original one, exercise FMD with standardized handgrip exercise. Exercise at a submaximal level is a physiological stimulus able, in a short time, to cause vasodilation without systemic cardiovascular adaptations. Therefore, even if both techniques explore the endothelial NO pathway, the vasodilatory response may be earlier dumped during exercise than after ischemia, which is a more intense stimulus. 29 Clinical studies have demonstrated a significant 8–13% higher cardiovascular risk for each percent point decrease in brachial artery FMD. 30 FMD after ischemia was 7.6% in T1D and 9.8% in control subjects; during exercise, 6.3% in T1D, and 9.7% in controls, a difference higher than 1%. Again this finding is worthy of attention even if obtained from an observational study.
The present study also shows that hypoglycemia and glycemic variability are not associated with FMD and IMT. The relationship between hypoglycemia and CVD is complex and strongly influenced by age, type of diabetes, disease duration, glycemic legacy, rate of severe hypoglycemic events, and comorbidities.31,32 Hypoglycemia does not seem to affect IMT or endothelial function in non-frail patients without long-standing uncontrolled hyperglycemia. 33 GV has attracted research in the last years. Again, studies indicate that variability defined as the rate of deviation from the target range in both directions might predict cardiovascular events. An interesting paper has demonstrated how glucose fluctuations may affect endothelial function. 34 However, the lack of robust prospective data limits the use of GV.
A very recent report, including a large population of patients with type 2 diabetes, has described the significant association between TIR and IMT in Lu et al. 22 Unfortunately, those data are hardly comparable to ours, as the two populations are completely different. Lu et al. enrolled hospitalized patients with an average age of over 60 years in treatment with other hypoglycemic drugs and associated pathologies. The glucose metric was collected in a 3-day interval. The IMT values were frankly higher than what we found in our population. Besides, those authors also found no association between TIR and IMT in women, probably because they were healthier than males.
The present study has several limitations and some strengths. Among the limitations, again, we underline the time range chosen to evaluate glycemic compensation and the lack of information about fasting and postprandial glycemia. About the first point, we have already explained why the two time periods have been chosen. The evaluation of longer time interval should have taken into account several confounding variables and exceeded the scope of the present study. About the last point, we may argue that more information on fasting and postprandial glucose could have helped to understand if changes in the short term can influence early markers of atherosclerosis. Further studies need to be planned in the future.
Conclusion
Our study demonstrates that TIR does not help to identify T1D patients with early atherosclerosis and likely at risk of overt cardiovascular disease. However, at the same time, the negative result of our study reinforces the hypothesis that atherosclerosis is a very complex disease involving different metabolic pathways. Finally, the evidence that vascular abnormalities occur early in T1D suggests that even in the presence of adequate time spent in the target range, we should make all the efforts to reduce cardiovascular risk.
Footnotes
Abbreviation
AGP, Ambulatory Glucose Profile; CCA, Common Carotid Artery; CV, Coefficient of Variation; CVD, Cardiovascular Disease; FMD, Flow-Mediated Dilation; GV, Glycemic Variability; HbA1c, Glycated Hemoglobin; ID, Internal Diameter; IMT, Intima-Media Thickness; MVC, Maximal Voluntary Contraction; NO, Nitric Oxide; rtCGM, real-time CGM; TAR, Time Above Range; TBR, Time Below Range; T1D, Type 1 Diabetes; TIR, Time in Range; SD, Standard Deviation; SE, Standard Error.
Declaration of Conflicting Interests
The author(s) declared no potential conflicts of interest with respect to the research, authorship, and/or publication of this article.
Funding
The author(s) received no financial support for the research, authorship, and/or publication of this article.