
Abstract
Aim:
Comparing continuous glucose monitoring (CGM)-recorded metrics during treatment with insulin degludec (IDeg) versus insulin glargine U100 (IGlar-100) in people with type 1 diabetes (T1D) and recurrent nocturnal severe hypoglycemia.
Materials and methods:
This is a multicenter, two-year, randomized, crossover trial, including 149 adults with T1D and minimum one episode of nocturnal severe hypoglycemia within the last two years. Participants were randomized 1:1 to treatment with IDeg or IGlar-100 and given the option of six days of blinded CGM twice during each treatment. CGM traces were reviewed for the percentage of time-within-target glucose range (TIR), time-below-range (TBR), time-above-range (TAR), and coefficient of variation (CV).
Results:
Seventy-four participants were included in the analysis. Differences between treatments were greatest during the night (23:00-06:59). Treatment with IGlar-100 resulted in 54.0% vs 49.0% with IDeg TIR (70-180 mg/dL) (estimated treatment difference [ETD]: –4.6%, 95% confidence interval [CI]: –9.1, –0.0, P = .049). TBR was lower with IDeg at level 1 (54-69 mg/dL) (ETD: –1.7% [95% CI: –2.9, –0.5], P < .05) and level 2 (<54 mg/dL) (ETD: –1.3% [95% CI: –2.1, –0.5], P = .001). TAR was higher with IDeg compared with IGlar-100 at level 1 (181-250 mg/dL) (ETD: 4.0% [95% CI: 0.8, 7.3], P < .05) and level 2 (> 250 mg/dL) (ETD: 4.0% [95% CI: 0.8, 7.2], P < .05). The mean CV was lower with IDeg than that with IGlar-100 (ETD: –3.4% [95% CI: –5.6, –1.2], P < .05).
Conclusion:
For people with T1D suffering from recurrent nocturnal severe hypoglycemia, treatment with IDeg, compared with IGlar-100, results in a lower TBR and CV during the night at the expense of more TAR.
Introduction
Glycated hemoglobin (HbA1c) remains the gold standard for evaluating glycemic control in insulin treatment. In studies of new insulins, a treat-to-target design is applied, aiming to show non-inferiority in terms of HbA1c reduction. When comparable levels of glycemic control are achieved, the safety profile of the insulin is evaluated based on the risk of hypoglycemia. 1 However, in people with type 1 diabetes (T1D) at high risk of hypoglycemia, HbA1c may not be the best measure of glycemic control as it does not reveal daily glucose fluctuations particularly outside the target range.2,3 This indicates the need for other metrics to evaluate glycemic control. Conventional continuous glucose monitoring (CGM) records 288 sensor glucose values per day, providing the possibility for treatment decisions and behavioral changes based on patterns in sensor glucose levels. CGM data may be beneficial in reporting and assessing new insulins’ effect on glycemic control. International consensus on reporting CGM data in randomized clinical trials was published in 2017 4 and recently elaborated. 5 Metrics from these consensus reports have previously not been reported in a randomized clinical trial comparing insulin degludec (IDeg) to insulin glargine U100 (IGlar-100).
The HypoDeg trial compared treatment with IDeg and IGlar-100 on hypoglycemia outcomes in a cohort of people with T1D who had experienced one episode or more of nocturnal severe hypoglycemia within the last two years.6,7 Here, we present CGM-recorded metrics from a sub-study of the HypoDeg trial and compare them with conventional glycemic control data from the same study.
Methods
Study Design
The HypoDeg trial is a two-year, investigator-initiated, controlled, multicenter crossover trial conducted in a PROBE (prospective, randomized, open, blinded endpoint adjudication of the primary outcome) design. Participants were randomized from January 2015 to March 2017 and the last participant’s last visit was in February 2019. The study aimed to investigate the occurrence of hypoglycemia during treatment with IDeg and IGlar-100 in people with T1D at high risk of hypoglycemia.
We included adults (≥ 18 years) with a diagnosis of T1D for the last five years and, most importantly, one episode or more of nocturnal severe hypoglycemia within the last two years.
Participants were randomized 1:1 to IDeg or IGlar-100 with prandial insulin aspart for both treatments. Each treatment period consisted of three months of run-in and nine months of maintenance treatment. After the first treatment period, participants switched to the other insulin analog for a second one-year treatment period. At baseline, insulin analogs and rapid-acting insulin were reduced by 20% and up-titrated subsequently to maintain baseline HbA1c (measured every three months) as previously described in detail. 6 The aim of this treatment target was to create a pragmatic real-life trial setting for these hypoglycemia-prone participants.
Insulin degludec and IGlar-100 were administered at dinner time, as this, for IGlar-100, provides more stable glycemic control during the night than if administered in the morning. 8
Sub-Study Procedures
Participants were invited to the optional predefined sub-study with CGM, consisting of two periods of six days blinded CGM (iPro®2 with the Enlite® sensor, Medtronic Minimed, Northridge, CA, USA) during each maintenance treatment period after 6, 12, 18, and 24 months, respectively. The sensors were inserted in the abdominal region, and participants were required to record blood glucose (BG) four times daily, the first time two hours after insertion and later calibration as recommended by the manufacturer. After six days, which was the lifetime of the sensor as indicated by the manufacturer, CGM data were uploaded to Medtronic Carelink iPro Therapy Management Software for Diabetes. The CGM data remained blinded until the end of the trial and were not used to adjust insulin dosage during the trial. CGM data were only collected during treatment steady state and all participants were CGM-naïve.
The Regional Committee on Biomedical Research Ethics (#H-3-2014-101), the Danish Medicines Agency (#201407615), and the Danish Data Protection Agency (I-suite no: 02945;#NOH-2014-018) approved the study. The study is registered at www.eudract.ema.europ.eu (#2014-001942-24) and www.clinicaltrials.gov (#NCT02192450), and was conducted according to the Helsinki Declaration and Good Clinical Practice (GCP) standards monitored by the Danish Agency for GCP.
All participants provided written informed consent.
Outcomes
CGM traces were reviewed for a selection of glucose metrics according to the international consensus on time in range.4,9 We included data in a CGM trace from the first CGM measurement with a corresponding blood glucose monitoring (BGM) calibration to the last CGM within 12 hours of the latest BGM calibration. Time in ranges was calculated as the total number of valid measurements within the specific range divided by the total number of recorded measurements. Time per day was calculated as the percentage of time in the range of the hours during the day, overall = 24 hours, daytime (07:00-22:59) = 16 hours, night-time (23:00-06:59) = eight hours.
Ranges
Time-within-target glucose range (TIR): percentage of readings and time at 70 to 180 mg/dL (3.9-10.0 mmol/L).
Time-below-range (TBR) overall: percentage of readings and time below 70 mg/dL (3.9 mmol/L), including readings below 54 mg/dL (3.0 mmol/L).
Time-below-range 1: percentage of readings and time at 54 to 69 mg/dL (3.0-3.8 mmol/L)
Time-below-range 2: percentage of readings and time below 54 mg/dL (3.0 mmol/L).
Time-above-range (TAR) overall: percentage of readings and time above 180 mg/dL (10.0 mmol/L), including readings above 250 mg/dL (13.9 mmol/L).
Time-above-range 1: percentage of readings and time at 181 to 250 mg/dL (10.1-13.9 mmol/L)
Time-above-range 2: percentage of readings and time above 250 mg/dl (13.9 mmol/L).
Glycemic variability and sensor glucose
We assessed the glycemic variability as the coefficient of variation (CV) calculated as the standard deviation (SD) divided by the mean sensor glucose concentration. Coefficient of variation is also described according to the time of day. The mean sensor glucose (mg/dL) is calculated overall and according to the time of day.
Statistical Analyses
Included data were only from participants who completed at least one CGM period in each treatment arm.
Due to the crossover design of the trial and the repeated measure of outcomes in participants, we used a linear mixed model to account for the repeated measures in the same participants. Participants were a random effect in the model and the treatment and period were fixed effects. The linear mixed model gave the estimated treatment difference (ETD), and descriptive statistics were used for the percentages of time in the different ranges according to treatment and time of day. To account for a possible between-period effect, as data were collected in two different periods of six days, the interaction between treatment and period in the model was included.
We set a level of statistical significance at 5% (two-sided) and used the statistical software SPSS (IBM SPSS statistics) for all analyses.
Results
The HypoDeg main trial randomization included 149 participants, among which 89 subjects accepted participation in the CGM sub-study. A total of 15 participants were excluded, as we only obtained traces from one of the treatment arms, leaving 261 CGM traces from 74 participants for evaluation.
The participants in the CGM sub-study were characterized by a long duration of diabetes (mean 28 years [13.4]), glycemic control with HbA1c: 7.9% (0.8%), C-peptide levels below the detection limit in 88% of participants, impaired awareness of hypoglycemia or unawareness (based on the Pedersen-Bjergaard method) 10 in 84% of participants, and reporting 2.4 (1-11) episodes of nocturnal severe hypoglycemia within the last two years (Table 1).
Baseline Characteristics of Participants.
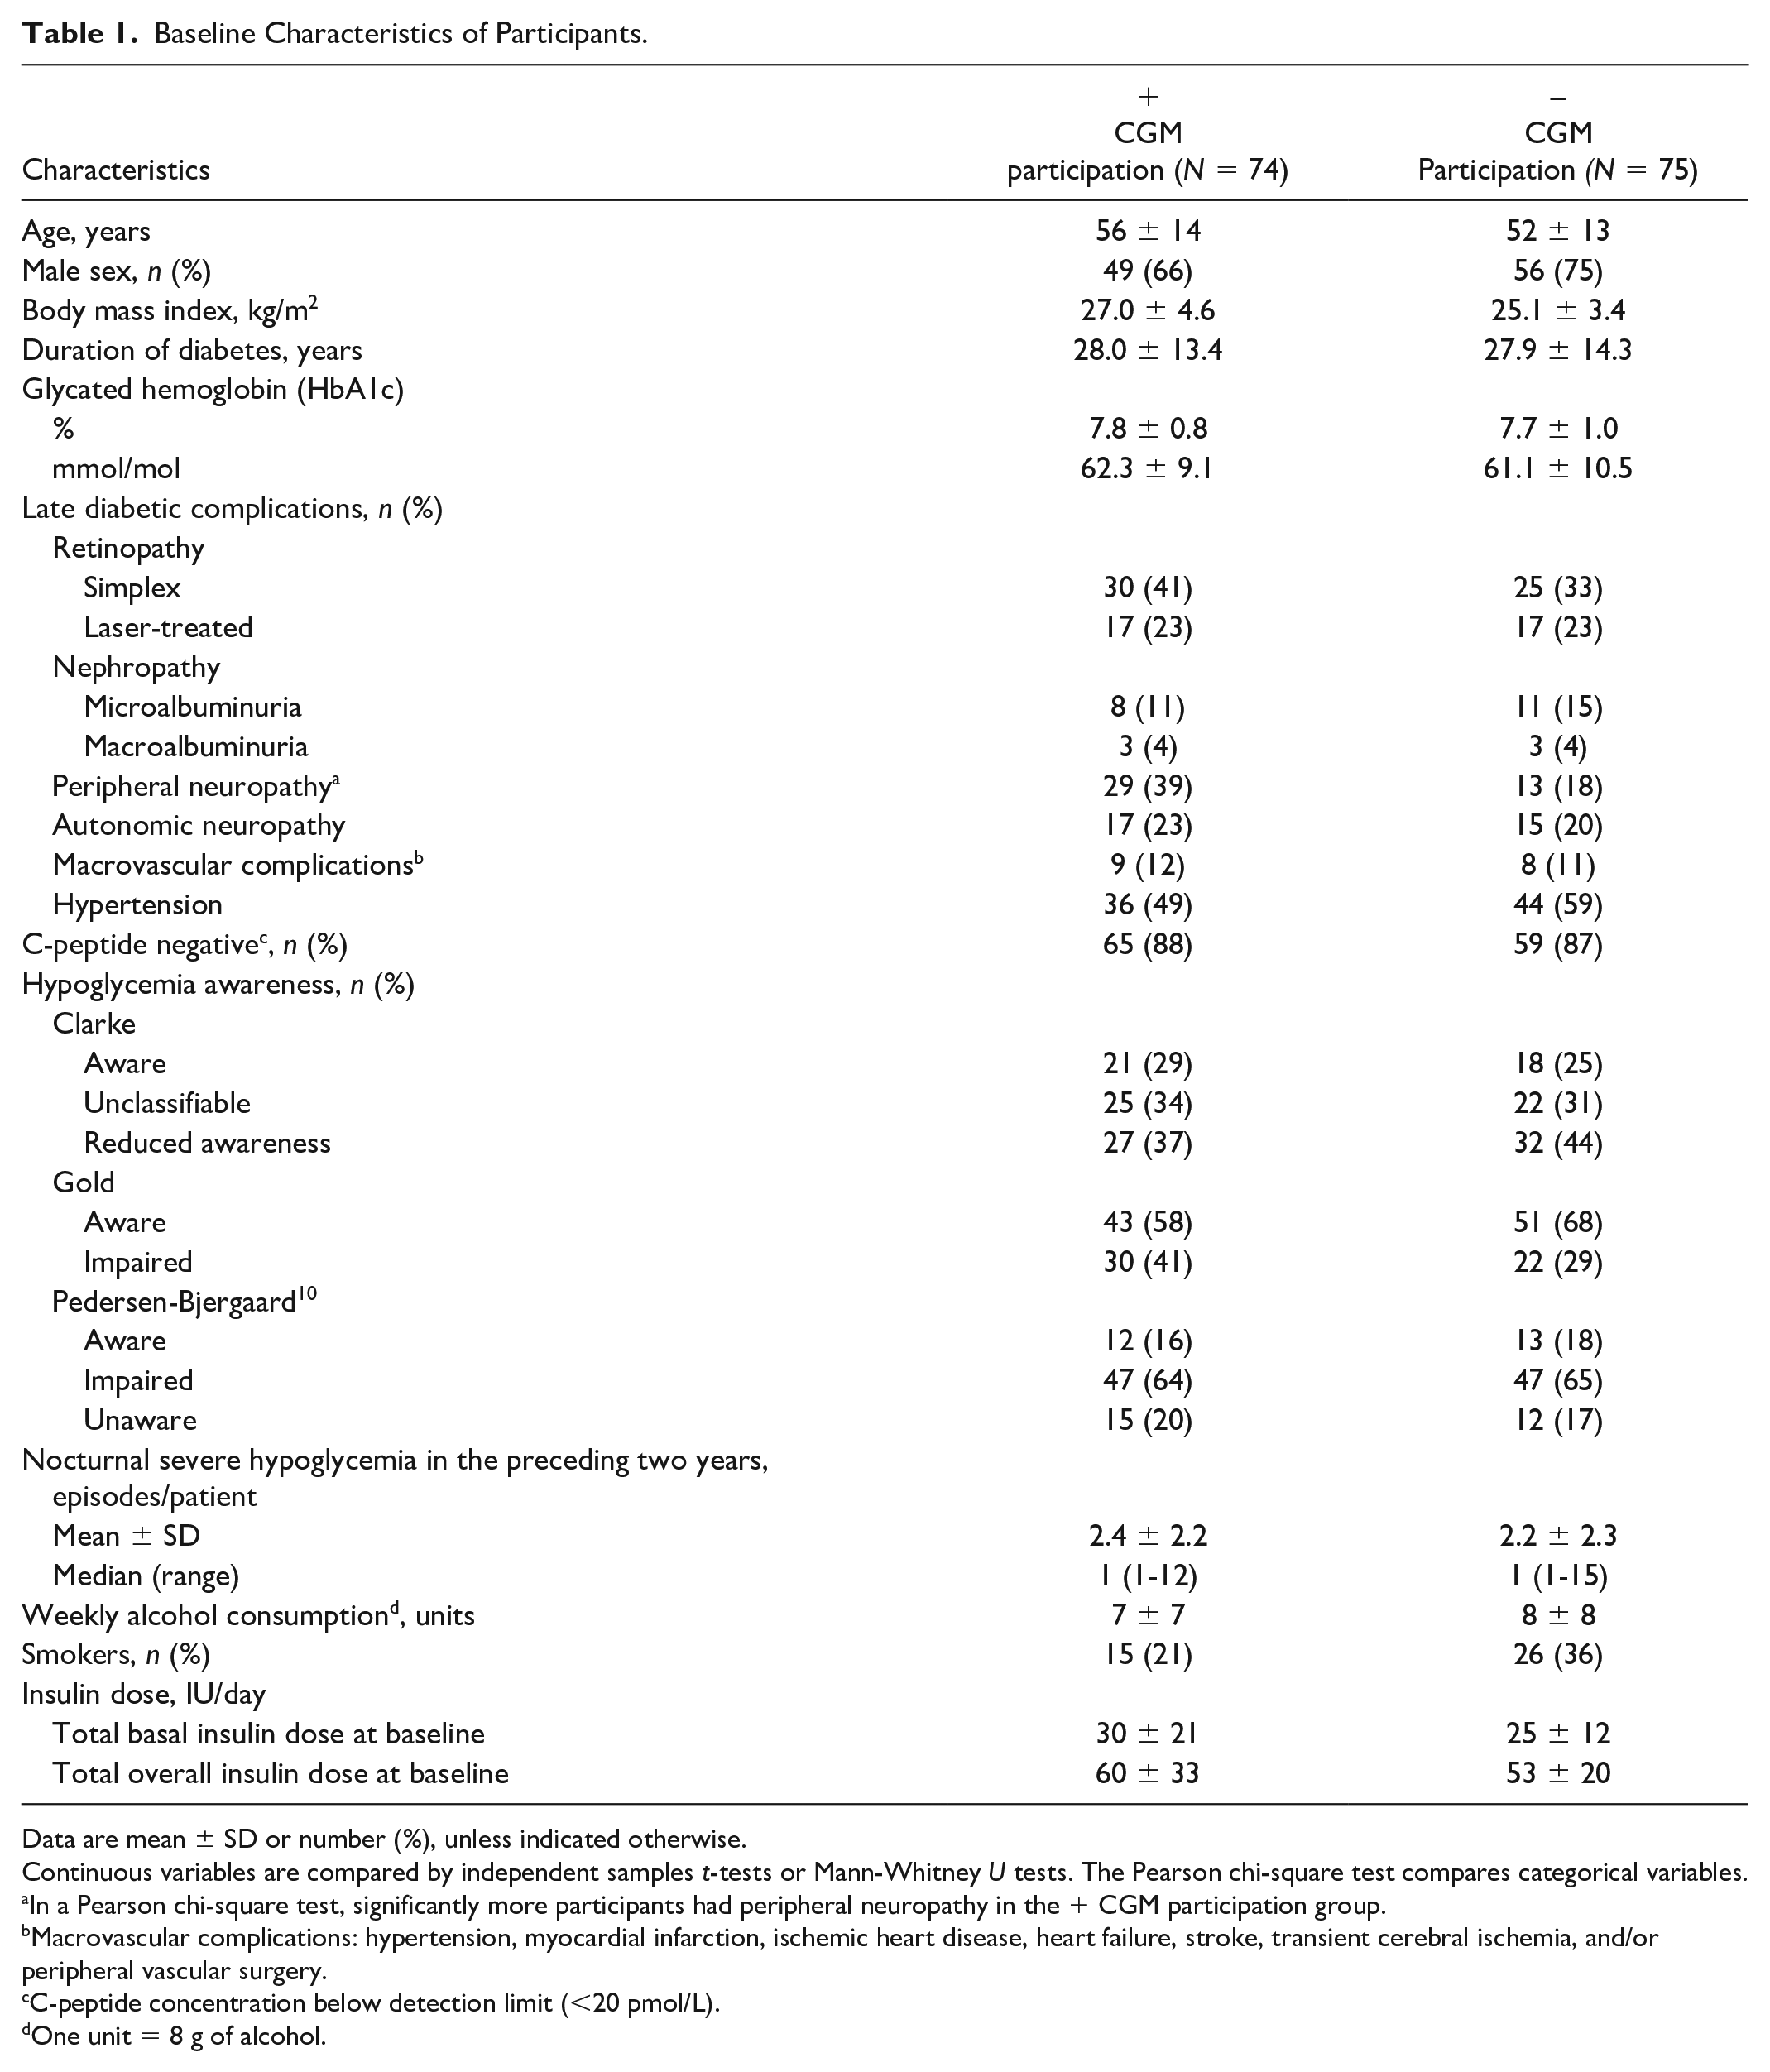
Data are mean ± SD or number (%), unless indicated otherwise.
Continuous variables are compared by independent samples t-tests or Mann-Whitney U tests. The Pearson chi-square test compares categorical variables.
In a Pearson chi-square test, significantly more participants had peripheral neuropathy in the + CGM participation group.
Macrovascular complications: hypertension, myocardial infarction, ischemic heart disease, heart failure, stroke, transient cerebral ischemia, and/or peripheral vascular surgery.
C-peptide concentration below detection limit (<20 pmol/L).
One unit = 8 g of alcohol.
During treatment with IDeg, we collected 128 CGM traces with a mean duration (SD) of 5.9 days (0.7), and with IGlar-100, 133 traces were collected with a mean (SD) duration of 5.9 days (0.8). This resulted in a cumulative mean of 11.8 days of CGM data.
During IDeg treatment, the mean valid percent of readings for six days was 97.9% (SD = 2.6) and 98.3% (SD = 1.8). During IGlar-100 treatment, the mean valid percent of readings for six days was 97.5% (SD = 4.1) and 97.8% (SD = 4.4).
TIR 70 to 180 mg/dL (3.9-10.0 mmol/L)
During treatment with IDeg and IGlar-100, the participants spent 49.3% and 49.9% in overall (24 hours) TIR, respectively. During daytime (07:00-22:59), there were no differences between treatments on TIR (Table 2). There was less TIR during night-time with IDeg 49.0% (19.9) vs 54% (18.0) for IGlar-100 (ETD: –4.6%, 22.1 minutes [95% CI: –9.1, –0.0], P = .049) (Table 2 and Figure 1).
Estimated Treatment Differences for CGM-Recorded Metrics According to Treatment and Time of Day.
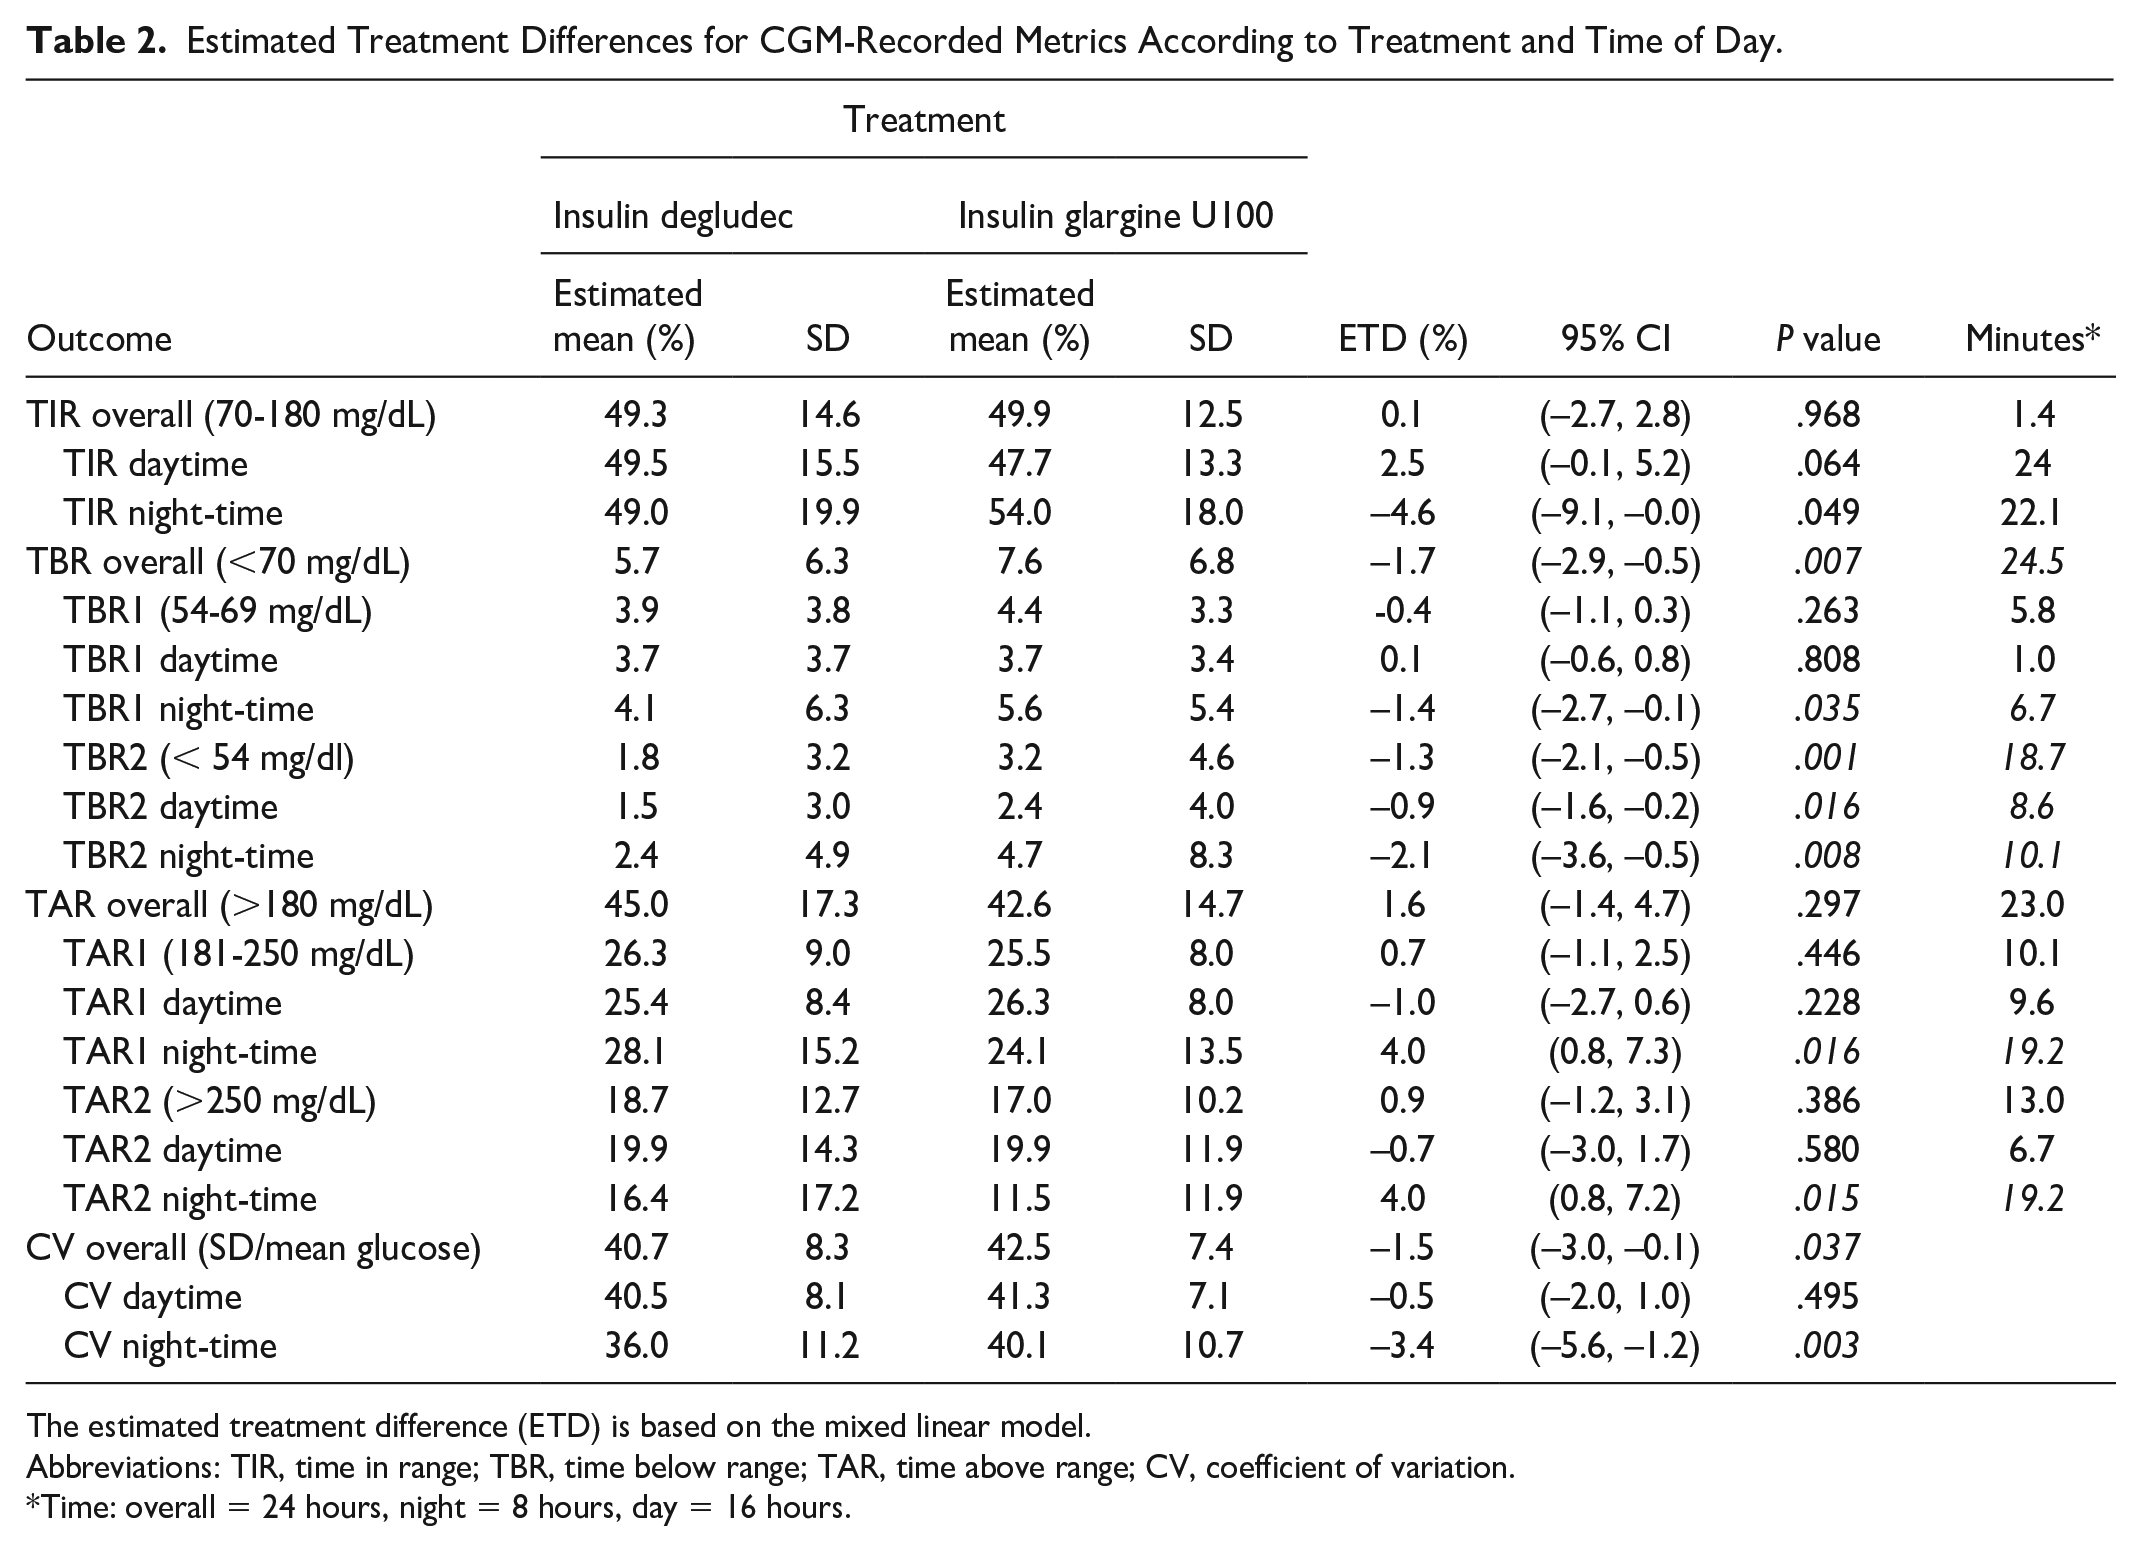
The estimated treatment difference (ETD) is based on the mixed linear model.
Abbreviations: TIR, time in range; TBR, time below range; TAR, time above range; CV, coefficient of variation.
Time: overall = 24 hours, night = 8 hours, day = 16 hours.
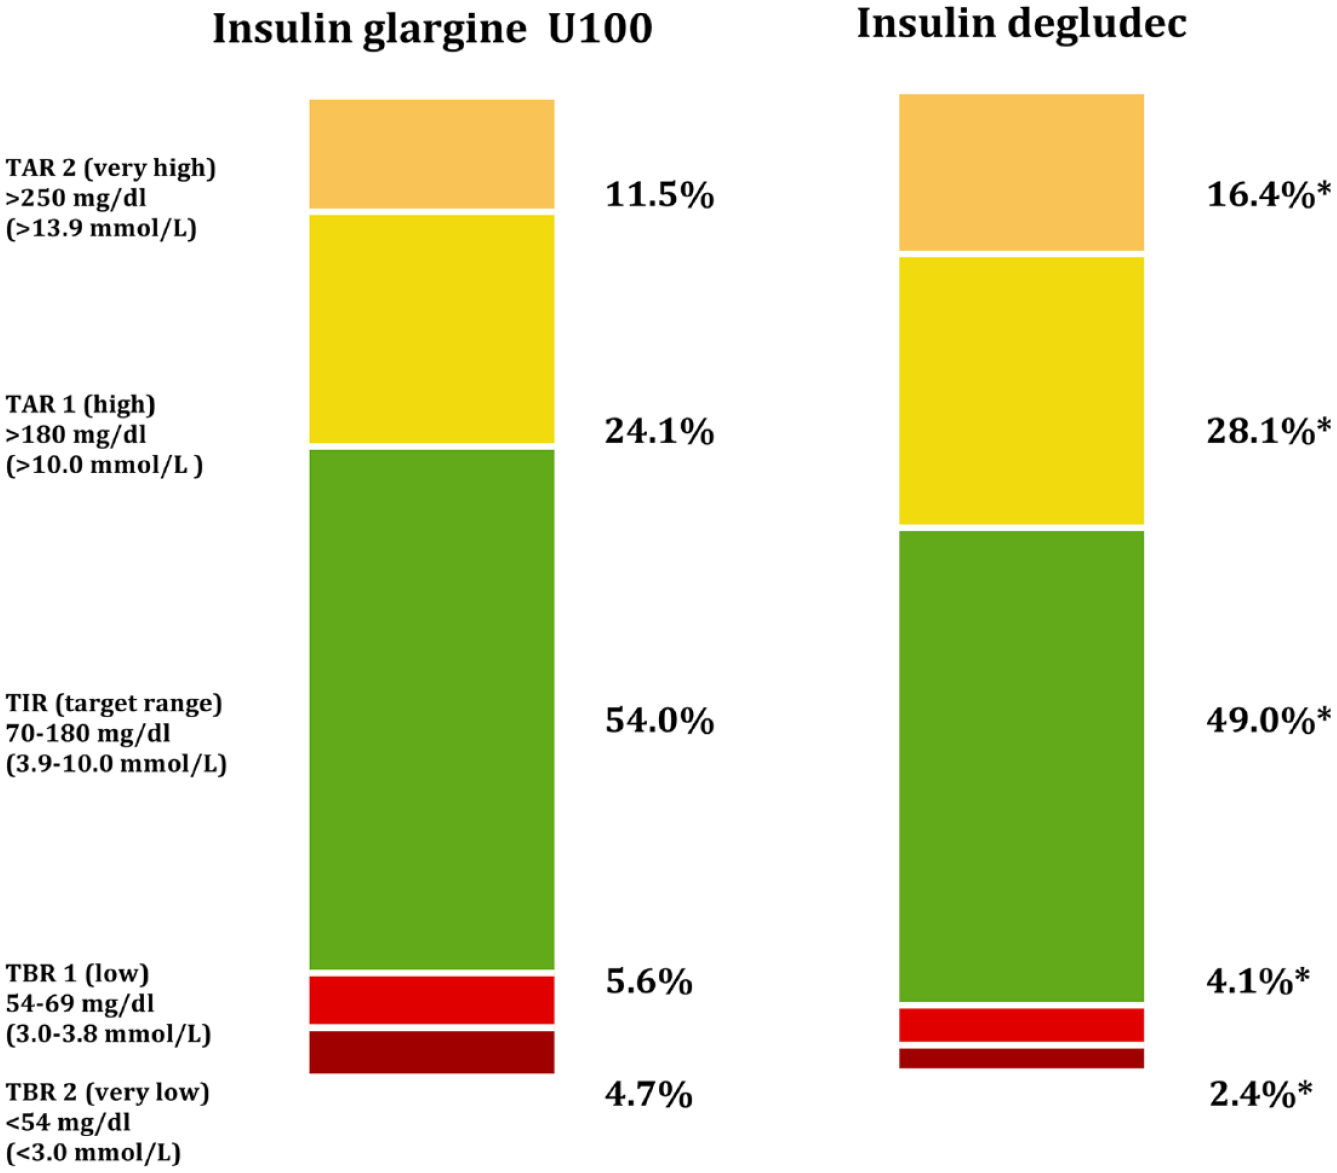
Percentage of time in ranges during the night (23:00-06:59) according to treatment. *P < .05.
Overall TBR <70 mg/dL (3.9 mmol/L)
In overall TBR, IDeg compared with IGlar-100 resulted in less TBR (5.7% [6.3] vs 7.6% [6.8]) (ETD: –1.7%, 24.5 minutes [95% CI: –2.9, –0.5], P < .05).
TBR1 (low) 54 to 69 mg/dL (3.0-3.8 mmol/L)
At this level of hypoglycemia, there were no differences between treatments overall (24 hours) or during daytime (07:00-22:59) (Table 2). Participants spent less TBR1 during night-time with IDeg than with IGlar-100 (4.1% [6.3] vs 5.6% [5.4]) (ETD: –1.4%, 6.7 minutes [95% CI: –2.7, –0.1], P < .05) (Table 2 and Figure 1).
TBR2 (very low) < 54 mg/dL (3.0 mmol/L)
Overall (24 hours), there was less TBR at this level of hypoglycemia with IDeg presenting a mean TBR2 of 1.8% (3.2) vs 3.2% (4.6) with IGlar-100 (ETD: –1.3%, 18.7 minutes [95% CI: –2.1, –0.5], P = .001). During daytime (07:00-22:59), the mean TBR2 with IDeg was 1.5% (3.0) and 2.4% (4.0) during IGlar-100 treatment (ETD: –0.9%, 8.6 minutes [95% CI: –1.6, –0.2], P < .05). During night-time, IDeg resulted in less TBR2 with a mean of 2.4% (4.9) vs 4.7% (8.3) with IGlar-100 (ETD: –2.1%, 10.1 minutes [95% CI: –3.6, –0.5], P < .05) (Table 2 and Figure 1).
Overall TAR > 180 mg/dL (10.0 mmol/L)
There were no differences between treatments on overall TAR (Table 2).
TAR1 (high) 181 to 250 mg/dL (10.1-13.9 mmol/L)
There were no differences in TAR1 overall (24 hours) or during daytime (07:00-22:59) (Table 2). During night-time, more time was spent above range of 28.1% (15.2) with IDeg vs 24.1% (13.5) with IGlar-100 (ETD: 4.0%, 19.2 minutes [95% CI: 0.8, 7.3], P < .05) (Table 2 and Figure 1).
TAR2 (very high) > 250 mg/dL (13.9 mmol/L)
There were no differences in TAR2 overall (24 hours) or during daytime (07:00-22:59) (Table 2). There was a higher TAR2 of 16.4% (17.2) during the night with IDeg vs 11.5% (11.9) during IGlar-100 treatment (ETD: 4.0%, 19.2 minutes [95% CI: 0.8, 7.2], P < .05) (Table 2 and Figure 1).
Glycemic Variability
Overall, there was a difference with less variability during IDeg treatment with a mean CV of 40.7% (8.3) vs 42.5% (7.4) with IGlar-100 (ETD: –1.5% [95% CI: –3.0, –0.1], P < .05). This difference was due to a difference in CV during night-time with IDeg of 36.0% (11.2) vs 40.1% (10.7) with IGlar-100 (ETD: –3.4% [95% CI: –5.6, –1.2], P < .05) (Table 2 and Figure 2).
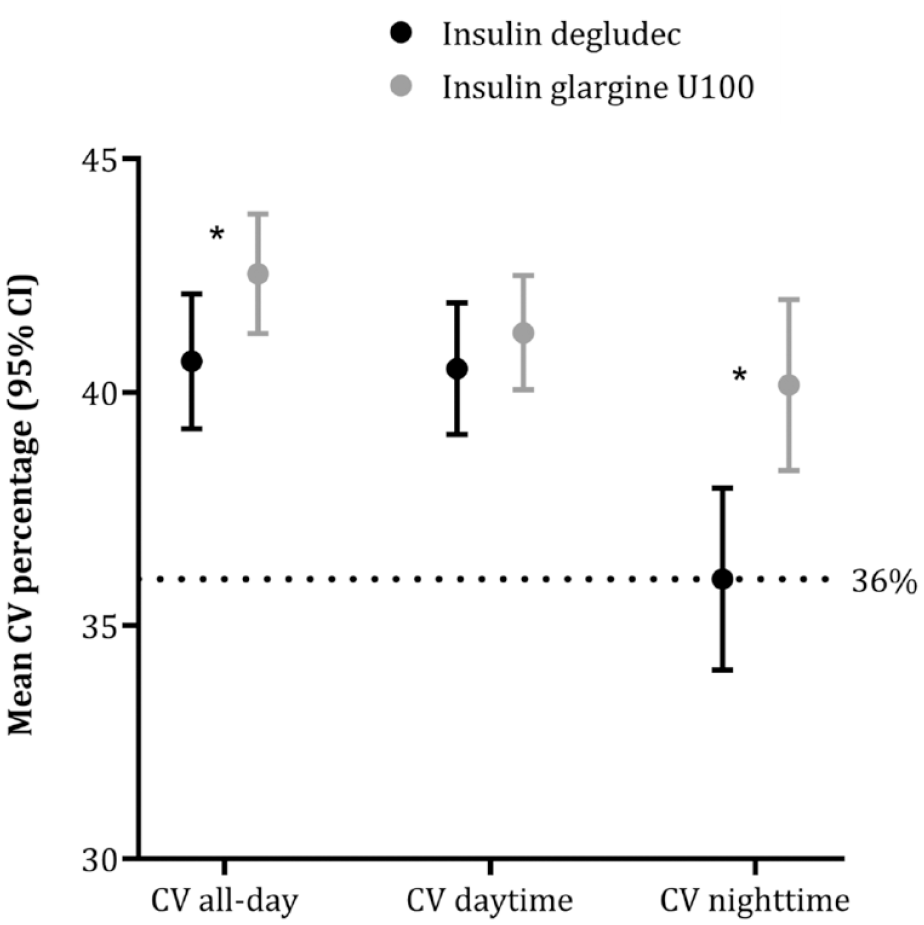
Mean coefficient of variation (CV) in percentage (95% CI) according to time period and treatment. Dotted line indicates a CV of 36%. 11 *P < .05. All-day = 24 hours, daytime = 07:00 to 22:59, night-time = 23:00 to 06:59.
Sensor Glucose Levels
Overall, the mean sensor glucose levels did not differ between treatments. The mean sensor glucose (SD) during IDeg treatment was 180 mg/dL (32), 10.0 mmol/L (1.8) vs 174 mg/dl (27), 9.7 mmol/L (1.5) during IGlar-100. The only difference between IDeg and IGlar-100 was a higher mean sensor glucose level (SD) during the night with IDeg; 177 mg/dL (43), 9.8 mmol/L (2.4) vs 160 mg/dL (34), 8.9 mmol/L (1.9) with IGlar-100 (ETD: 15 [95% CI: 7.2, 23.1], P < .001).
There was no between-period effect in any of the variables.
Discussion
In this CGM sub-study from the HypoDeg trial, comparing IDeg with IGlar-100 in people with T1D and recurrent nocturnal severe hypoglycemia, we found 24.5 minutes less overall TBR with IDeg. This was mainly driven by 18.7 minutes less overall TBR2 (< 54 mg/dL, 3.0 mmol/L) with IDeg. Furthermore, glycemic variability was lower with IDeg, with a 1.5% lower CV than IGlar-100. The reduced overall CV was due to a significantly lower CV during the night with IDeg.
The less TBR during IDeg treatment in these participants prone to severe hypoglycemia was at the expense of 19.2 minutes more TAR during the night at both levels of TAR (high [TAR1] and very high [TAR2]) and 22.1 minutes less TIR during night-time with IDeg. The American Diabetes Associations Standards of Medical Care 2022 and the international consensus on CGM5,9,12 emphasize that addressing hypoglycemia is essential when people with diabetes present with glycemia out of range. In the 2019 international consensus on CGM metrics, the recommendations for high-risk individuals make our findings even more relevant: long-term diabetes and a high prevalence of hypoglycemia unawareness are among the characteristics of people with diabetes at high risk of severe hypoglycemia. 9 In the present cohort, the mean duration of diabetes was almost three decades, and the vast majority had impaired awareness or unawareness of hypoglycemia (Table 1). In these high-risk individuals, a TIR of 50% is accepted as a target to avoid hypoglycemia and prevent excessive hyperglycemia (TAR1 < 50% and TAR2 < 10%).9,12,13 Both treatments achieved an overall TIR of ~49% in this sub-study (Table 2). Nearly, meeting the TIR target in these participants, we have also found a reduction in BGM-recorded nocturnal symptomatic hypoglycemia, severe hypoglycemia and CGM-recorded nocturnal non-severe hypoglycemic events.7,14 However, it is important to note that the lower TBR with IDeg compared with IGlar-100 (although not less than the recommended TBR < 1%), and close-to-target TIR comes at the expense of 8.7% more TAR2 than recommended in these patients.
As the HypoDeg trial was not a treat-to-target trial, we aimed at maintaining baseline HbA1c and, hence, recorded all endpoints at comparable levels of HbA1c. The basal insulin doses were significantly lower with IDeg; however, this difference did not influence fasting plasma glucose which was similar between treatments.7,15
The primary outcome of the HypoDeg trial was a significant relative rate reduction (RRR) in nocturnal symptomatic hypoglycemia (BGM-recorded) with IDeg of 28% at level 1(≤ 70 mg/dL, 3.9 mmol/L) and 37% at level 2 (≤ 54 mg/dL, 3.0 mmol/L). Severe hypoglycemia was a secondary outcome in the main trial and was significantly reduced with an RRR of 35% with IDeg compared with IGlar-100. In CGM-recorded hypoglycemic events, there was a significant RRR with IDeg compared with IGlar-100 in nocturnal hypoglycemic events of 36% at level 1 (70 mg/dL, 3.9 mmol/L) and 53% at level 2 (≤ 54 mg/dL, 3.0 mmol/L). These reductions were mainly driven by significant reductions in nocturnal asymptomatic hypoglycemia. 14
Based on CGM data in people with T1D, IDeg has only been compared with insulin glargine U300 (IGlar-300). The InRange study was a parallel-group, open-label, treat-to-target study, and 343 participants with T1D were treated with IDeg or IGlar-300 and wore blinded CGM. Time-within-target glucose range was the primary endpoint. 16 There were no improvements in TIR from baseline, and with IDeg, participants achieved a TIR of 55.1%, and with IGlar-300, a TIR of 52.7% without difference between treatments. There were no differences between treatments in the CV (41.2% with IDeg and 39.9% with IGlar-300). There were no differences in overall TBR; 6.5% with IDeg and 5.5% with IGlar-300. In overall TAR, 38.3% with IDeg and 41.52% with IGlar-300 were reported; likewise, no significant differences were found. With IDeg during night-time, there was 6.1% TBR1 and 6.7% with IGlar-300. In TBR2, during the night, they reported 2.6% with IDeg and 2.3% with IGlar-300. 17 The findings from the InRange study are comparable with our findings. Interestingly, the target of TIR > 70%, recommended for the general T1D population, was far from met. The InRange study excluded participants at high risk of hypoglycemia. At baseline, none of the participants used CGM, and despite a careful titration of fasting plasma glucose (at the lowest possible rate of hypoglycemia), target TIR was not reached. Likewise, the target of CV ≤ 36% was not reached. The glycemic variability above 36% might explain the overall TBR > 4%, which is above recommended in this population. 9 These findings indicate that not even newer basal insulin analogs can stand alone when attempting to achieve reasonable glycemic control.
Time-within-target glucose range has been identified as one of the most important factors to have a big impact on daily life for people with T1D. 18 From Diabetes Control and Complications (DCCT) data, derived TIR was calculated, and for every 10% decrease in TIR, the risk of retinopathy progression increases by 64%, and the risk of developing microalbuminuria increases by 40%. 19 Based on CGM data, an increase in TIR is associated with a decrease in microalbuminuria with a 19% decrease in urinary albumin-to-creatinine ratio (UACR) per 10% increase in TIR. 20
Glycemic variability is an important metric to target when aiming for good glycemic control at the lowest possible risk of hypoglycemia. 2 High glycemic variability is associated with severe and non-severe hypoglycemia.21-23 Glycemic variability, expressed by CV and recorded by CGM, is considered an indicator of stable glucose levels when it is below 36%. 11 In the current sub-study, neither treatment met this target in terms of overall CV, but IDeg treatment resulted in a CV of 36% during night-time. In data from the DCCT, glycemic variability was a predictor of nocturnal hypoglycemia, and therefore, it may be argued that instead of aiming for higher overnight BG, a reduction of glycemic variability should be sought to reduce nocturnal hypoglycemia. 24
In a modern approach to assessing glycemic control in a clinical trial, CGM is essential. CGM is the most feasible and comprehensive way to evaluate nocturnal hypoglycemia as it is often asymptomatic and passes unrecognized.25-27 In our previous results on CGM-recorded hypoglycemia, we saw that despite comparable relative differences in hypoglycemia across studies, the application of CGM translated these differences into significant absolute differences due to the inclusion of high-risk participants and application of CGM. 14 In the InRange study, the rate of CGM-recorded hypoglycemia was three- to six-fold higher than the rates reported by BGM. 16
The strength of the sub-study of the HypoDeg trial is, first and foremost, the inclusion of participants at high risk of hypoglycemia. These participants are typically excluded from clinical trials but including them supplements the previous findings in people with T1D who are at low or intermediate risk of hypoglycemia.28,29 Because hypoglycemia occurs in a skewed distribution, 30 the crossover design ensures that both treatments are tested in the same person, reducing inter-person variability. With a long (three months) crossover period, we reduce the carry-over effects of the previous insulin treatment. All endpoints were recorded during the nine months of maintenance treatment, ensuring a steady state. Reporting endpoints according to current international expert consensus is a strength because it allows comparing results across trials when endpoints are consistently reported.
At the time of the study, there was no consensus on data collection periods. The iPro2 had a lifetime of six days, and we collected a cumulative mean of 11.8 days of CGM data. Consensus on reporting CGM data recommends > 70% of CGM usage during 14 consecutive days for the most reliable data. 5
The main limitation of the study was the open-label design. In Denmark, insulin analogs are provided as pre-filled pens; blinding would not have been feasible. However, this limitation is minor as reporting biases in blinded CGM readings are probably negligible. Furthermore, the CGM had no alarms, and none of the participants used CGM as the standard of care, which reduced bias in reporting outcomes.
The study was conducted from 2015 to 2019 and applied the best sensor available. The sensor’s mean absolute relative difference (MARD) is 11% to 18.9% and even higher in the hypoglycemic range, which is above the recommended < 10%31-35 and a study limitation.
Conclusion
In people with T1D suffering from recurrent nocturnal severe hypoglycemia, treatment with IDeg compared with IGlar-100 results in significantly less TBR and a lower glycemic variability during the night. This was at the expense of higher mean sensor glucose levels during the night with IDeg, leading to more TAR and less TIR.
Supplemental Material
sj-docx-1-dst-10.1177_19322968231197423 – Supplemental material for The Effect of Insulin Degludec Versus Insulin Glargine U100 on Glucose Metrics Recorded During Continuous Glucose Monitoring in People With Type 1 Diabetes and Recurrent Nocturnal Severe Hypoglycemia
Supplemental material, sj-docx-1-dst-10.1177_19322968231197423 for The Effect of Insulin Degludec Versus Insulin Glargine U100 on Glucose Metrics Recorded During Continuous Glucose Monitoring in People With Type 1 Diabetes and Recurrent Nocturnal Severe Hypoglycemia by Julie Maria Bøggild Brøsen, Rikke Mette Agesen, Amra Ciric Alibegovic, Henrik Ullits Andersen, Henning Beck-Nielsen, Peter Gustenhoff, Troels Krarup Hansen, Christoffer Hedetoft, Tonny Joran Jensen, Claus Bogh Juhl, Charlotte Røn Stolberg, Susanne Søgaard Lerche, Kirsten Nørgaard, Hans-Henrik Parving, Lise Tarnow, Birger Thorsteinsson and Ulrik Pedersen-Bjergaard in Journal of Diabetes Science and Technology
Footnotes
Acknowledgements
First and foremost, the authors would like to thank the participants in the HypoDeg trial. They greatly appreciate and acknowledge their contribution to the study. They wish to acknowledge the great work of all personnel at the participating sites and the Endocrine Research Unit at the Department of Endocrinology and Nephrology, Copenhagen University Hospital—Nordsjælland, Hillerød, Denmark. Finally, they acknowledge the team at the Clinical Research Unit, Copenhagen University Hospital—Nordsjælland, Hillerød, Denmark, for coordination and assistance during the trial.
Author Confirmation Statement
U.P.-B., R.M.A., L.T., and B.T. initiated and designed the trial. R.M.A., A.C.A., H.U.A., H.B.-N., P.G., T.K.H., C.H., T.J.J., C.R.S., C.B.J., S.S.L., K.N., H.-H.P., L.T., B.T., and U.P.-B. participated in the coordination of the study and data collection. J.M.B.B. planned and executed the statistical analyses. J.M.B.B. was responsible for the development of the manuscript. All authors contributed to, read, and approved the final manuscript.
Abbreviations
BG, blood glucose; BGM, blood glucose monitoring; CV, coefficient of variation; CI, confidence interval; CGM, continuous glucose monitoring; DCCT, Diabetes Control and Complications; ETD, estimated treatment difference; MARD, mean absolute relative difference; RRR, relative rate reduction; SD, standard deviation; TAR, time-above-range; TBR, time-below-range; TIR, time-within-target glucose range; T1D, type 1 diabetes; UACR, urinary albumin-to-creatinine ratio.
Authors’ Note
The study is registered at www.eudract.ema.europ.eu (#2014-001942-24) and ![]() (#NCT02192450).
(#NCT02192450).
Data availability statement
Data can be requested by reasonable demand with the corresponding author.
Declaration of Conflicting Interests
The author(s) declared the following potential conflicts of interest with respect to the research, authorship, and/or publication of this article: J.M.B.B., H.B.-N., T.K.H., C.H., T.J.J., C.R.S., S.S.L., H.-H.P., L.T., and B.T. have no competing financial interests. U.P.-B. has served on advisory boards for Novo Nordisk and Sanofi and has received lecture fees from Abbott, Sanofi, and Novo Nordisk. A.C.A. and R.M.A. have been employed by Novo Nordisk A/S since September 2019 (after the finalization of the study). H.U.A. is on advisory boards for Abbott Laboratories, Astra Zeneca, and Novo Nordisk; has received lecture fees from Nordic Infucare; and owns stock in Novo Nordisk. P.G. has served on advisory boards for Abbott Laboratories, Astra Zeneca, Boehringer Ingelheim, Novo Nordisk, and Sanofi. C.B.J. serves on advisory boards for Novo Nordisk. K.N. serves as an advisor to Abbott Laboratories, Medtronic, and Novo Nordisk; has received fees for speaking from Bayer, Medtronic, Novo Nordisk, Roche Diabetes Care, Rubin Medical, Sanofi, and Zealand Pharma; and owns stock in Novo Nordisk.
Funding
The author(s) disclosed receipt of the following financial support for the research, authorship, and/or publication of this article: Novo Nordisk A/S provided an unrestricted grant and study medications for this study.
Supplemental Material
Supplemental material for this article is available online.
References
Supplementary Material
Please find the following supplemental material available below.
For Open Access articles published under a Creative Commons License, all supplemental material carries the same license as the article it is associated with.
For non-Open Access articles published, all supplemental material carries a non-exclusive license, and permission requests for re-use of supplemental material or any part of supplemental material shall be sent directly to the copyright owner as specified in the copyright notice associated with the article.