
Abstract
Access to real-time glucose data in real time allows users to make informed decisions about their insulin dosages, appropriate carbohydrate intake, exercise, and other health behaviors. Programmable alarms and alerts warn users about current and/or impending acute glycemic events. However, the value and utility of retrospective data analysis for clinical decision-making have gone mostly unrecognized. This article presents a series of patient case examples that illustrate how our use of retrospective data enables us to identify and effectively address patterns of problematic glycemia.
Introduction
Over the past five years, a rapidly growing number of individuals with type 1 diabetes (T1D) and insulin-treated type 2 diabetes (T2D) have benefited from the ability to frequently monitor their daily glycemic control using continuous glucose monitoring (CGM). Unlike traditional fingerstick blood glucose monitoring (BGM), using a blood glucose meter and test strips, CGM systems provide users with a continuous stream of glucose data presented in numerical and graphical formats that inform patients about their current glucose levels, glucose trends, and rate and direction of changing glucose.
Access to glucose data in real time allows patients to make informed decisions about their insulin dosages, appropriate carbohydrate intake, exercise, and other health behaviors. Moreover, programmable alarms and alerts can be individualized to warn users about current and/or impending acute glycemic events. The benefits of using CGM data for daily diabetes management are obvious and have been demonstrated in numerous clinical trials1-4 and real-world, observational, and prospective studies5-9 involving patients with T1D and T2D treated with intensive insulin regimens, basal insulin only, and noninsulin therapies.
However, despite the proven advantages of CGM use, the value and utility of retrospective data analysis for clinical decision-making have gone mostly unrecognized. Among the most common reasons for underutilization of the data are data overload, increased clinic staff time, and the need for clinician education and training on data interpretation. 10
In this article, we present a series of T1D and T2D patient case examples that illustrate how our use of retrospective data enables us to more efficiently determine patients’ glycemic status, assess the efficacy of treatment, and adjust therapies to safely and effectively address patterns of problematic glycemia. Our goal is to provide basic guidance in CGM data analysis and highlight the added efficiency that use of retrospective data confers in clinical settings.
Ambulatory Glucose Profile Report
The Ambulatory Glucose Profile (AGP) software automatically downloads data from patients’ CGM device cloud-based transmission and immediately analyzes and displays the data in a standardized report based on established CGM metrics for retrospective assessment of glycemic status.10,11 The first AGP graph was created by Mazze et al 12 and then further developed by the International Diabetes Center. The AGP report components have been incorporated into various product-specific software programs, which CGM manufacturers make available to both clinicians and patients. Figure 1 presents an example of the Overview report displayed by the Dexcom Clarity software (Dexcom, Inc., San Diego, California).
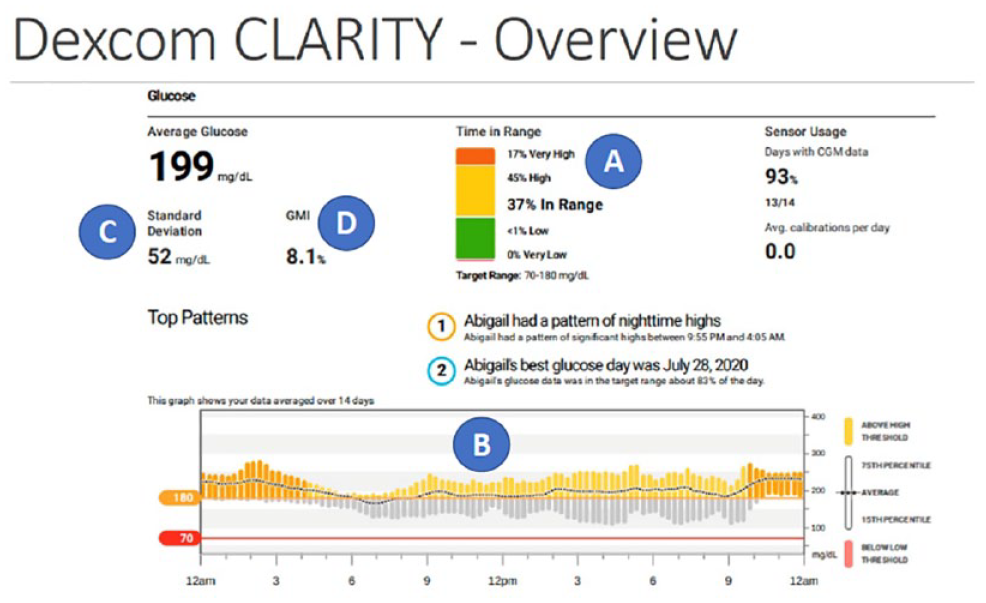
Clarity software overview report. Abbreviations: CGM, continuous glucose monitoring; GMI, glucose management indicator.
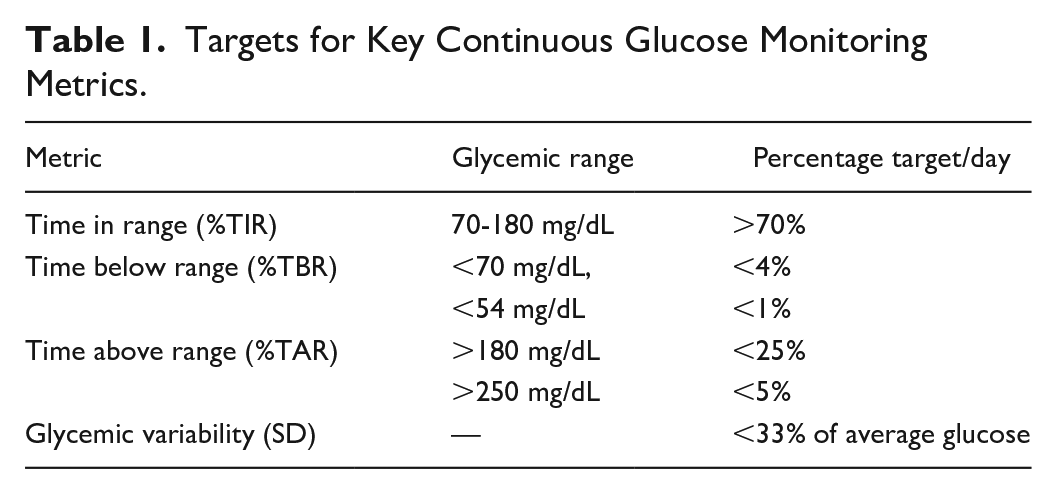
The key metrics that we use in our practice are the percentages of time in range (%TIR, 70-180 mg/dL), below range (%TBR, <70 mg/dL, <54 mg/dL), and above range (%TAR, >180 mg/dL, >250 mg/dL) (Figure 1a); glucose profile (Figure 1b), which combines all glucose data into 24-hour modal day graph; standard deviation (SD) for glycemic variability (Figure 1c); and GMI (glucose management indicator), which uses all downloaded glucose data to provide an estimate of the patient’s future glycated hemoglobin (HbA1c) (Figure 1d). The targets for glycemic variability and time in ranges are presented in Table 1.
Targets for Key Continuous Glucose Monitoring Metrics.
Clinical Case Examples
The following patient case examples illustrate how the use of retrospective data analysis provides critical information that can guide more effective clinical decision-making. Although the examples include patients who have been using CGM for varying durations, we have broken out our analysis timeframes as Baseline, Month 3, and Month 6 for simplicity.
Case Example: CG
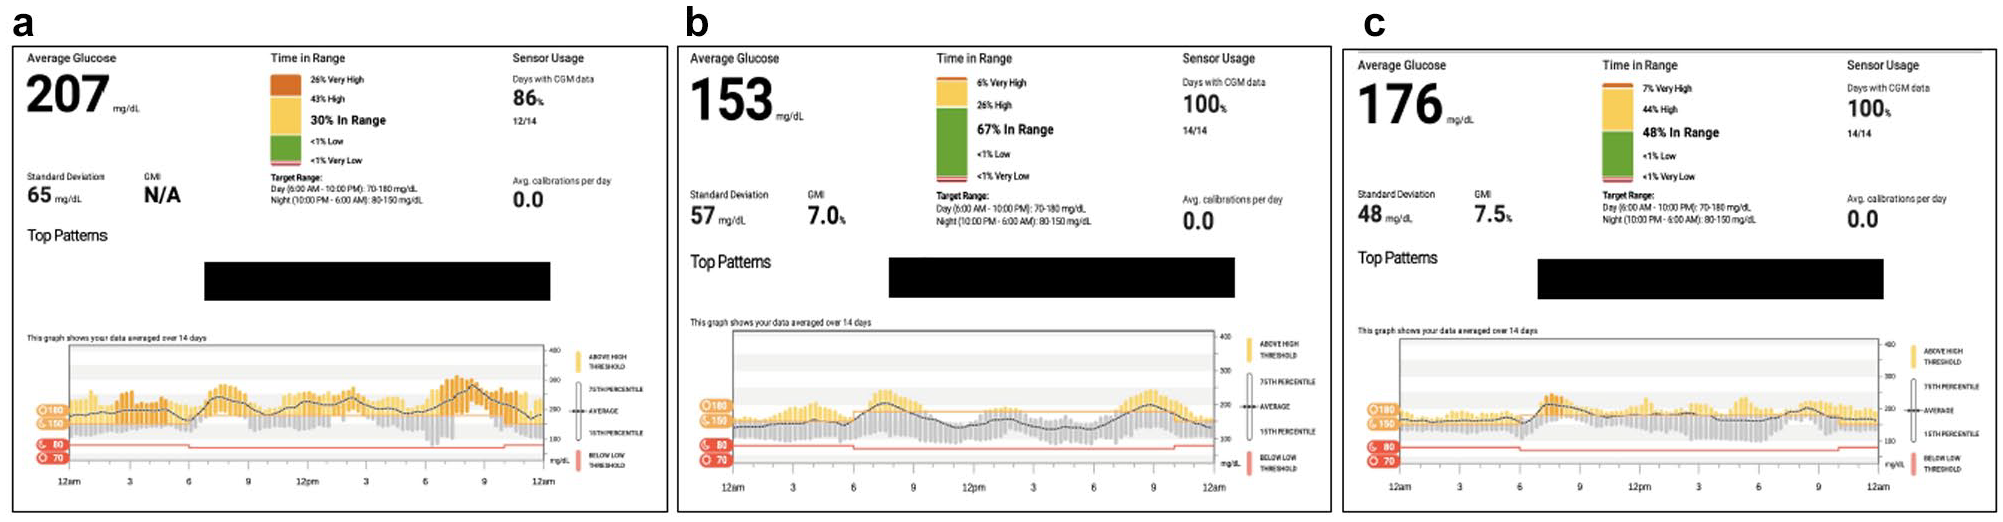
CG is a 37-year-old man with 23 years’ duration of T1D. At Baseline, his HbA1c was 10.0%, and he was treated with 8-12 U NovoLog (insulin aspart) at meals and 40 U Lantus (insulin glargine) at bedtime. He weighed 92.5 kg with a body mass index (BMI) of 31 kg/m2. His glycemic control at baseline was suboptimal in all CGM metrics, with an average glucose of 211 mg/dL and 74% of CGM values above target range (Figure 2a). CG indicated that he tended to eat light (if at all) at dinner, but generally had a snack before bed, which he often did not cover with NovoLog. Based on the glucose profile, we asked CG to uptitrate his Lantus in 2-unit increments every two days until his fasting glucose was at 100 mg/dL. We also made a slight increase in his insulin-to-carbohydrate ratio at lunch (his largest meal of the day) to address excessive postprandial excursions.
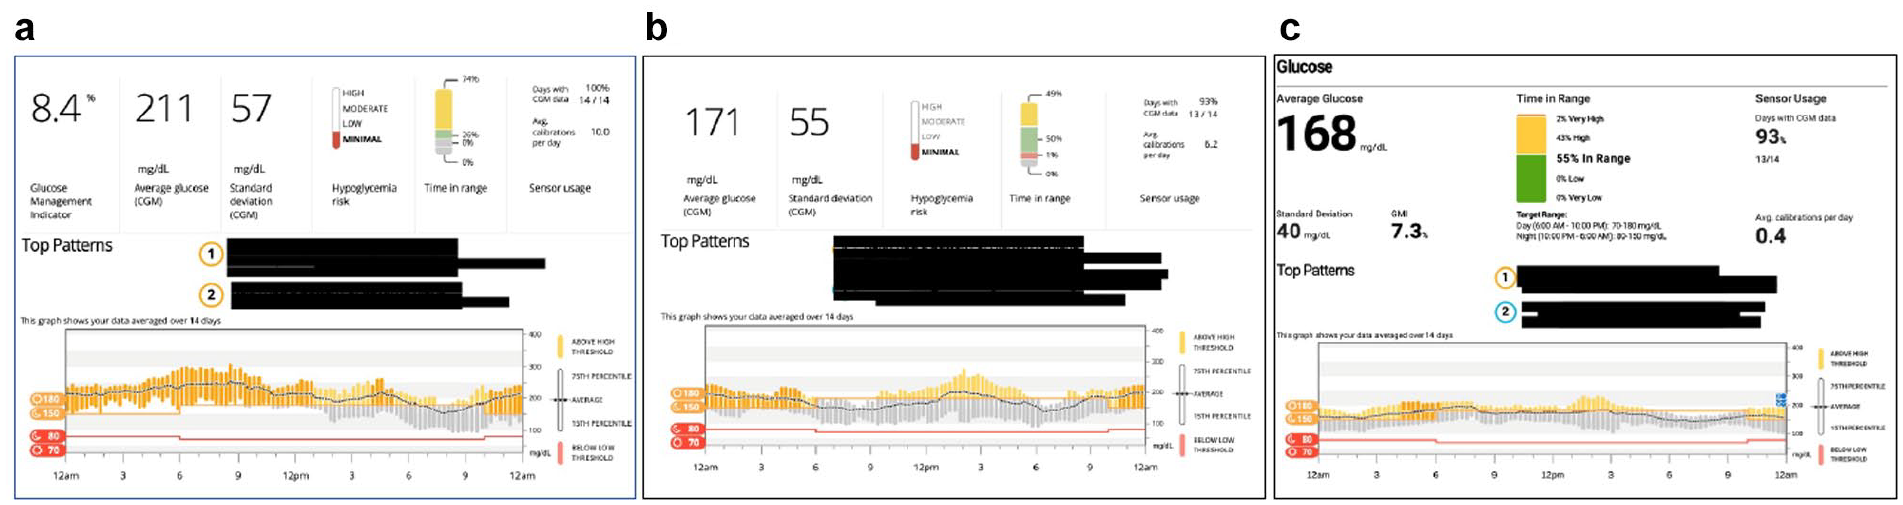
CG: retrospective data at Baseline (a), Month 3 (b), and Month 6 (c). Abbreviation: CGM, continuous glucose monitoring.
At the Month 3 visit, we saw a decrease in his average glucose with significant improvement in his fasting glucose. (Figure 2b) Although CG’s %TIR had increased from 26% to 50%, we asked him to continue uptitrating his Lantus until his fasting glucoses were at goal. We were not concerned about hypoglycemia given that his %TBR was only 1%. At Month 6, we saw improvements in all CGM metrics, with 55% of time spent in target range and no hypoglycemia. (Figure 2c)
Case Example: TJ
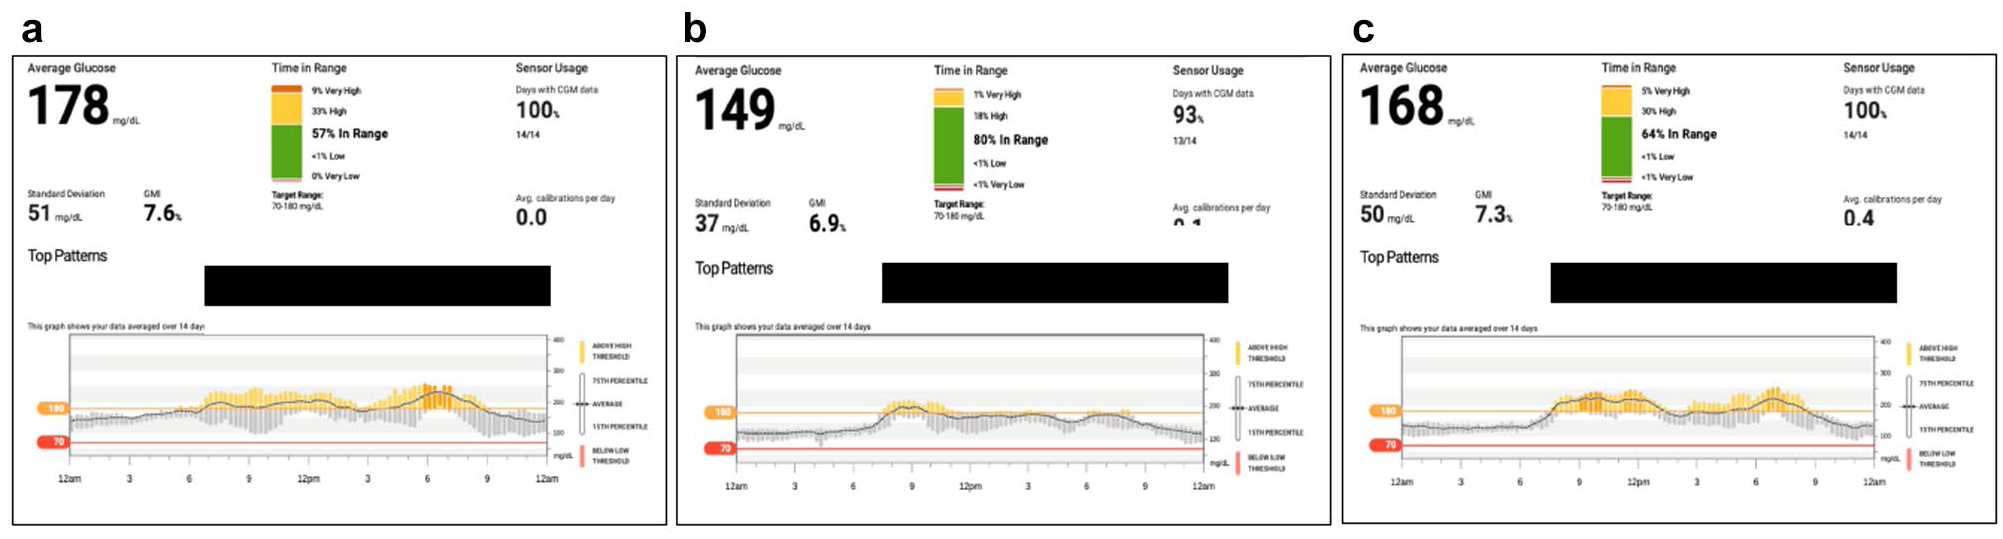
TJ is a 52-year-old man with 12 years’ duration of diagnosed T2D. At the Baseline visit, he was being treated with Soliqua (combination 15 U glargine/5 µg lixisenatide). His HbA1c from eight months ago was 11.1% and his current weight was 118.4 kg. The initial review of his AGP data showed persistent hyperglycemia as evidenced by the 24-hour glucose profile and confirmed by the %TIR of 23 and %TAR of 77 with no documented or reported hypoglycemia. There was an apparent improvement in HbA1c as indicated by the GMI (Figure 3a). Based on these data, we increased the Soliqua by 2 units and scheduled a follow-up visit at three months.
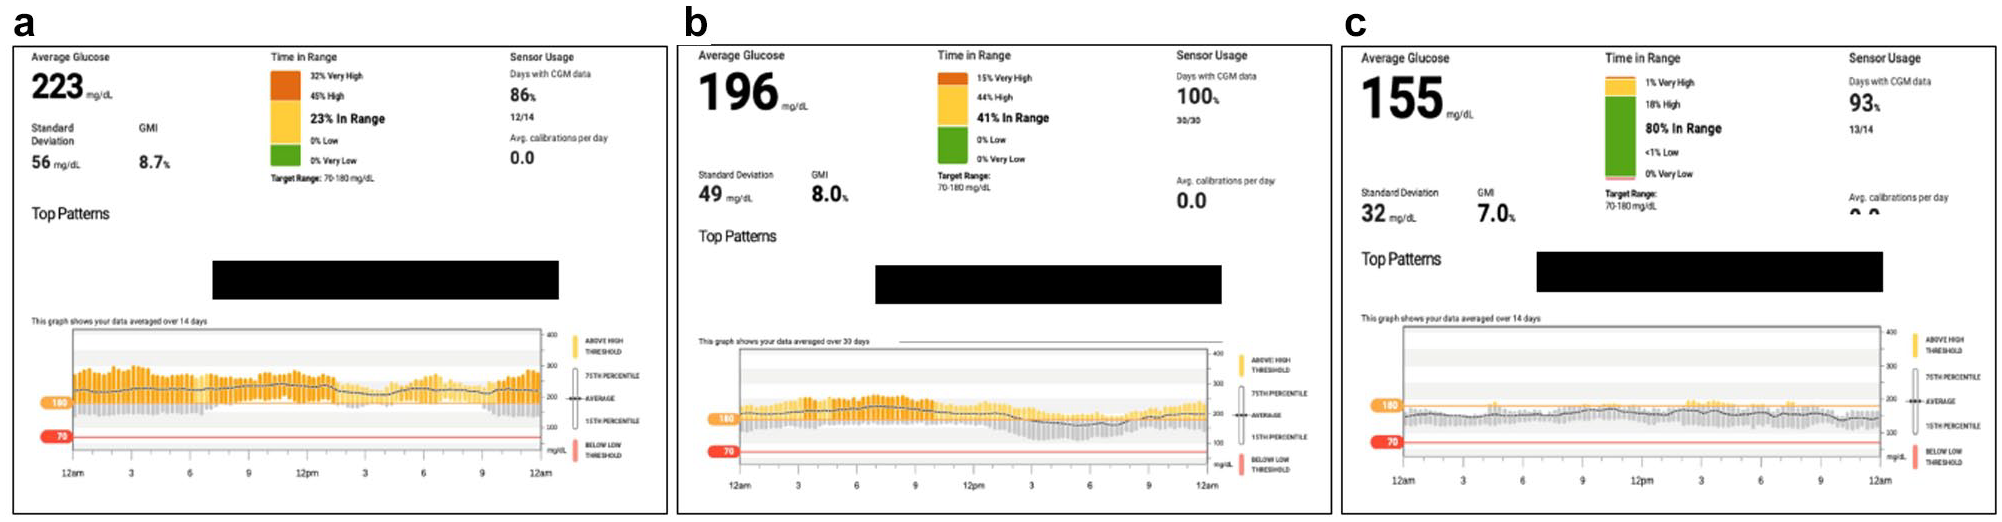
TJ: retrospective data at Baseline (a), Month 3 (b), and Month 6 (c). Abbreviations: GMI, glucose management indicator; CGM, continuous glucose monitoring.
At the Month 3 visit, we observed significant improvements in all metrics, with an increase in %TIR to 41 accompanied by a decrease in %TAR to 59 and a notably lower HbA1c (8.0%), which correlated with the GMI (Figure 3b). However, the 24-hour glucose profile continued to show problematic hyperglycemia throughout most of the day. We increased Soliqua by an additional 2 units and initiated Synjardy XR (combination of metformin 1000 mg/empagliflozin 10 mg once daily). At the Month 6 visit, the persistent hyperglycemia was mitigated (%TIR 80) and his laboratory HbA1c of 7.0% again correlated with the GMI (Figure 3c).
Case Example: AF
AF is a 60-year-old man with 15 years’ duration of diagnosed T2D. At Month 1, he was being treated with basal-bolus therapy (insulin glargine 80 U/aspart 8-10 U at meals). His HbA1c from eight months ago was 9.4% and his current weight was 99.3 kg.
At the Baseline visit, we observed persistent hyperglycemia with %TIR of only 30 (Figure 4a). The 24-hour glucose profile showed significant postprandial spikes at all meals. We adjusted the patient’s insulin sensitivity factor (ISF) to address the postprandial glucose excursions and asked him to increase his insulin glargine by 2 units every three to four days until he was within his target range on most days.
AF: retrospective data at Baseline (a), Month 3 (b), and Month 6 (c). Abbreviations: GMI, glucose management indicator; CGM, continuous glucose monitoring.
At the Month 3 visit, we saw notable improvements with an increase in %TIR and reductions in the magnitude of his postprandial excursions (Figure 4b). However, at the Month 6 visit, the patient’s glycemic control had somewhat deteriorated, with the data showing a reduction in %TIR and a higher GMI but with less glycemic variability (48 mg/dL SD) (Figure 4c). In discussion with the patient, we learned that he had discontinued his basal insulin titration but was still using his adjusted ISF for correction doses. We asked the patient to restart his basal titration, provided counseling on the use of CGM alerts, and scheduled a follow-up telehealth visit in one month.
Example Case: EW
EW is a 77-year-old man with six years’ duration of diagnosed T2D. At Month 1, he was being treated with basal insulin (insulin detemir 22 U). His HbA1c from two months ago was 9.2% and his current weight was 58.1 kg with a BMI of 22.5 kg/m2.
At the Baseline visit, we observed good glycemic control throughout the night, followed by a steady rise during the early morning (Figure 5a). Although his postprandial glucose excursions were not exceptional, the fact that he was starting breakfast with an elevated glucose level (>180 mg/dL) on most days, hyperglycemia persisted throughout the day as evidenced in the 24-hour glucose profile. We asked EW to uptitrate his insulin detemir by 2 units every three to four days until his fasting glucose was <130 mg/dL on most days. We then scheduled a follow-up visit in three months.
EW: retrospective data at Baseline (a), Month 3 (b), and Month 6 (c). Abbreviations: GMI, glucose management indicator; CGM, continuous glucose monitoring.
At Month 3, there was a notable improvement in glycemic control, particularly after the evening meal, with a significant increase in %TIR (Figure 5b). No medication changes were made at this visit. However, at the Month 6 visit, we saw that his postprandial glucose control had deteriorated to what we had observed at the Baseline visit (Figure 5c). Interestingly, despite the additional basal insulin, EW lost approximately 4.5 kg over the three-month period. Based on our assessment and the patient’s likely worsening insulinopenia, we initiated mealtime insulin with insulin lispro (4 U) at breakfast and dinner, assessed his use of CGM system alerts, and scheduled a follow-up telehealth visit in one month.
Discussion
During the past five years, numerous randomized controlled trials (RCTs) and real-world prospective and observational studies have demonstrated the clinical utility of CGM use in patients with T1D and T2D treated with intensive insulin regimens.1-4,13-17 However, a growing body of evidence is demonstrating that the use of CGM confers significant benefits on patients with T2D treated with less-intensive insulin and noninsulin regimens.5,7-9 In a recent RCT, Martens et al 5 reported that adults with poorly controlled T2D treated with basal insulin without prandial insulin who used CGM resulted in significantly lower HbA1c levels at eight months compared with traditional BGM use (−0.9% vs −0.6%, P = .02). Grace and Slyer 9 showed even greater HbA1c reductions in a similar population. In a retrospective analysis of 38 patients with T2D treated with basal-only insulin therapy or noninsulin therapy with 10.1% mean baseline HbA1c, investigators observed significant reductions in HbA1c (−3.0%, P < .001) and average glucose (−23.6, P < .001) after six months of CGM use. Importantly, patients showed significant improvements in recently established CGM glycemic targets, 11 with increases in the percentage of time spent in glucose range (%TIR), from 57.0% to 72.2% (P < .001). All patients maintained the targets for %TBR (<4% at 70 mg/dL, <1% at <54 mg/dL). The greatest improvements in %TIR were in patients treated with ≤1 medication. Several studies have shown that CGM use in T2D populations treated with nonintensive therapies is critical to detecting hypoglycemia.18,19
Apart from its utility in clinical decision-making, studies are not showing that even intermittent use of CGM in these populations increases treatment satisfaction, 20 patients’ understanding of their disease, 20 and significantly reduces diabetes-related distress, 21 all of which can impact treatment adherence and outcomes.
Although many clinicians may be unfamiliar with using retrospective CGM data with their patients, it is important to note that this is not a new concept. In fact, use of retrospective CGM data is an essential strategy for assessing and reporting glycemic outcomes in large RCTs and prospective, observational studies.1,3-5,16,17,22
However, despite the publication of several guides to interpreting an AGP report,23-25 including a tutorial from the International Diabetes Center (http://www.agpreport.org/agp/sites/default/files/CGM_Clinical_Guide_AGP.pdf), there still appears to be much room for uptake of systematic retrospective analysis of CGM data.
In the clinical setting, patients who are already benefiting from the use of CGM may gain additional clinical insight from the retrospective analysis of their CGM data. Whereas routine use of CGM data enables patients to monitor and act upon current glucose values and glucose trends, consistent use of retrospective analysis of these data allows clinicians to conduct a more complete assessment of each patient’s glycemic status, the impact of medication changes, and health behaviors.
As demonstrated in the case examples presented here, the ability to capture a continuous stream of accurate glucose data and then display those data in meaningful, actionable formats facilitates early identification of problematic glycemic patterns that require attention. Review of this information enables clinicians to make more informed treatment recommendations and creates opportunities for patients to learn more about how their medications and health behaviors impact their glycemic control.
For example, in our visit with AF at the Month 6 visit, we were able to use the 24-hour glucose profile graph to show the patient why he needed to continue uptitration of his daily basal insulin dose. Our review of the data also provided a strong indication that more frequent follow-up would be beneficial.
In addition, as we saw with EW, whose data showed significant improvement at the Month 3 visit but then largely deteriorated by the Month 5 visit, our review of data with the patient became a “teaching moment” for AF, who now understands the progressive nature of his diabetes and the need for ongoing therapy adjustment and, importantly, that these adjustments can be made safely as the subject benefits from the hypoglycemic alerts available in CGM systems.
Importantly, the discrepancies between EW’s laboratory HbA1c results and GMI values alerted us to the potential problems of using HbA1c measurements for assessing glycemic control with this patient due to his advanced age (77 years). As reported by Dubowitz et al, 26 HbA1c levels in elderly patients tend to be higher independent of their glucose levels. This highlights the value of the GMI as a more reliable indicator of long-term glycemic control given that age and other factors, such as iron deficiencies, 27 anemia, 28 hemoglobinopathies, 29 chronic kidney disease, 30 pregnancy, 31 and ethnic and racial differences in glycation rates,32-34 can impact the accuracy of HbA1c measurements.
Importantly, retrospective analysis of CGM data on a regular basis is essential to personalizing diabetes care. Whereas clinical trials report outcomes on a collective patient population, looking at changes in each cohort’s average HbA1c and other metrics, utilization of CGM data in the clinical setting puts a face on each patient’s individual level of glycemic control, facilitating more informed decision-making, stronger patient-clinician collaboration, and greater patient understanding of their disease and treatment regimen. All of these factors contribute to improved treatment satisfaction and better treatment adherence.35-37
In summary, using retrospective data enabled us to more efficiently determine patients’ current glycemic status and make more informed when adjusting therapy in our patients with T2D regardless of their treatment regimen. Importantly, use of remote monitoring of CGM data in conjunction with “virtual” telehealth visits enabled us to assess glycemic control and make therapy adjustments without the inherent patient burden and potential hazards in in-person clinic visits. As concerns about COVID-19 continue, we expect to see more widespread use of these technologies in the future.
Based on our experience, we strongly support modifying CGM eligibility criteria to allow access to CGM for all individuals with diabetes who benefit from this technology. However, additional research is needed to more fully elucidate the benefits and utility of retrospective analysis of CGM data in real-world clinical settings.
Footnotes
Abbreviations
AGP, Ambulatory Glucose Profile; BGM, blood glucose monitoring; CGM, continuous glucose monitoring; GMI, glucose management indicator; HbA1c, glycated hemoglobin; T1D, type 1 diabetes; T2D, type 2 diabetes; %TAR, percent of time above range; %TBR, percent of time below range; %TIR, percent of time in range
Declaration of Conflicting Interests
The author(s) declared the following potential conflicts of interest with respect to the research, authorship, and/or publication of this article: C.G.P. has received consulting fees from Abbott Diabetes Care, CeQur, Dexcom, Mannkind, Provention, Roche Diabetes Care, Tenex, and LifeScan. Q.N. and A.A.I. report no disclosures.
Funding
The author(s) disclosed receipt of the following financial support for the research, authorship, and/or publication of this article: Dexcom, Inc. provided funding for the development of this manuscript.